
Index Analysis
Intraday Analysis for 02 Oct 2026
KRV Prime04 October 202658 min
Educational/Derived AnalysisSource: KRV Prime Market Insights (End-of-Day)As of 04 Oct 2026, 08:25 AM IST
Intraday Analysis for 02 Oct 2026
Markets closed on a weak note on 01 Oct 2026, with NIFTY shedding 0.88% to 22,421.95, BANKNIFTY down 0.33% to 54,450.75, and SENSEX losing 0.79% to close at 71,909.70, all three indices printing below their respective weekly CPR bands — a structurally bearish alignment heading into the new session. India VIX data is unavailable for this session, which warrants extra caution in position sizing as unknown volatility regimes can produce outsized intraday swings. The options market is providing key context: NIFTY's weekly straddle at 260.55 points implies a ±1.16% expected move from ATM 22,400, while SENSEX's unusually tight weekly straddle of just 9.7 points signals near-zero premium left in the weekly book and heavy writer dominance near 71,900.
Key Market Signals — Intraday Setup
All three indices — NIFTY, BANKNIFTY, and SENSEX — are trading below their weekly CPR bands (NIFTY weekly P 23,216.82, BANKNIFTY weekly P 55,864.23, SENSEX weekly P 74,137.48), confirming broad-market bearish structural alignment; with daily CPRs descending and narrow across NIFTY and SENSEX, any flat-to-lower open on 02 Oct will immediately validate a trending bear day structure.
Deep Technical Analysis & Levels
NIFTY
Descending — Narrow (Width 0.02%)
▼ Bearish
Market Structure Trending (up or down trend) | Straddle ATM 22,400 weekly straddle = 156.95 (Call) + 103.60 (Put) = **260.55 points**, implying an expected intraday move of approximately ±260 points from 22,400, placing the upper bound near 22,660 and lower bound near 22,139 for the weekly expiry cycle. This straddle pricing indicates moderate premium with a slight call-skew (156.95 vs 103.60), meaning options writers are more fearful of an upside breakout than a downside breakdown, yet overall premium levels suggest the market expects contained movement unless a macro catalyst arrives. | Max Pain NIFTY weekly max pain is at **22,550** (expiry 06-Oct-2026), which sits approximately 128 points above Friday's close of 22,421.95 and comfortably above the daily CPR band (TC 22,419.29 / BC 22,413.95). This implies option sellers would ideally prefer the index to drift higher toward 22,550 through the week, meaning any recovery attempt that stalls near 22,530–22,550 (Camarilla H3 at 22,530.11 + max pain) will face coordinated selling pressure from option writers defending this zone. Monthly max pain at 23,300 is far above current levels, suggesting the market is significantly below where monthly writers are comfortable — adding a longer-term recovery bias that conflicts with near-term bearish day structure. |
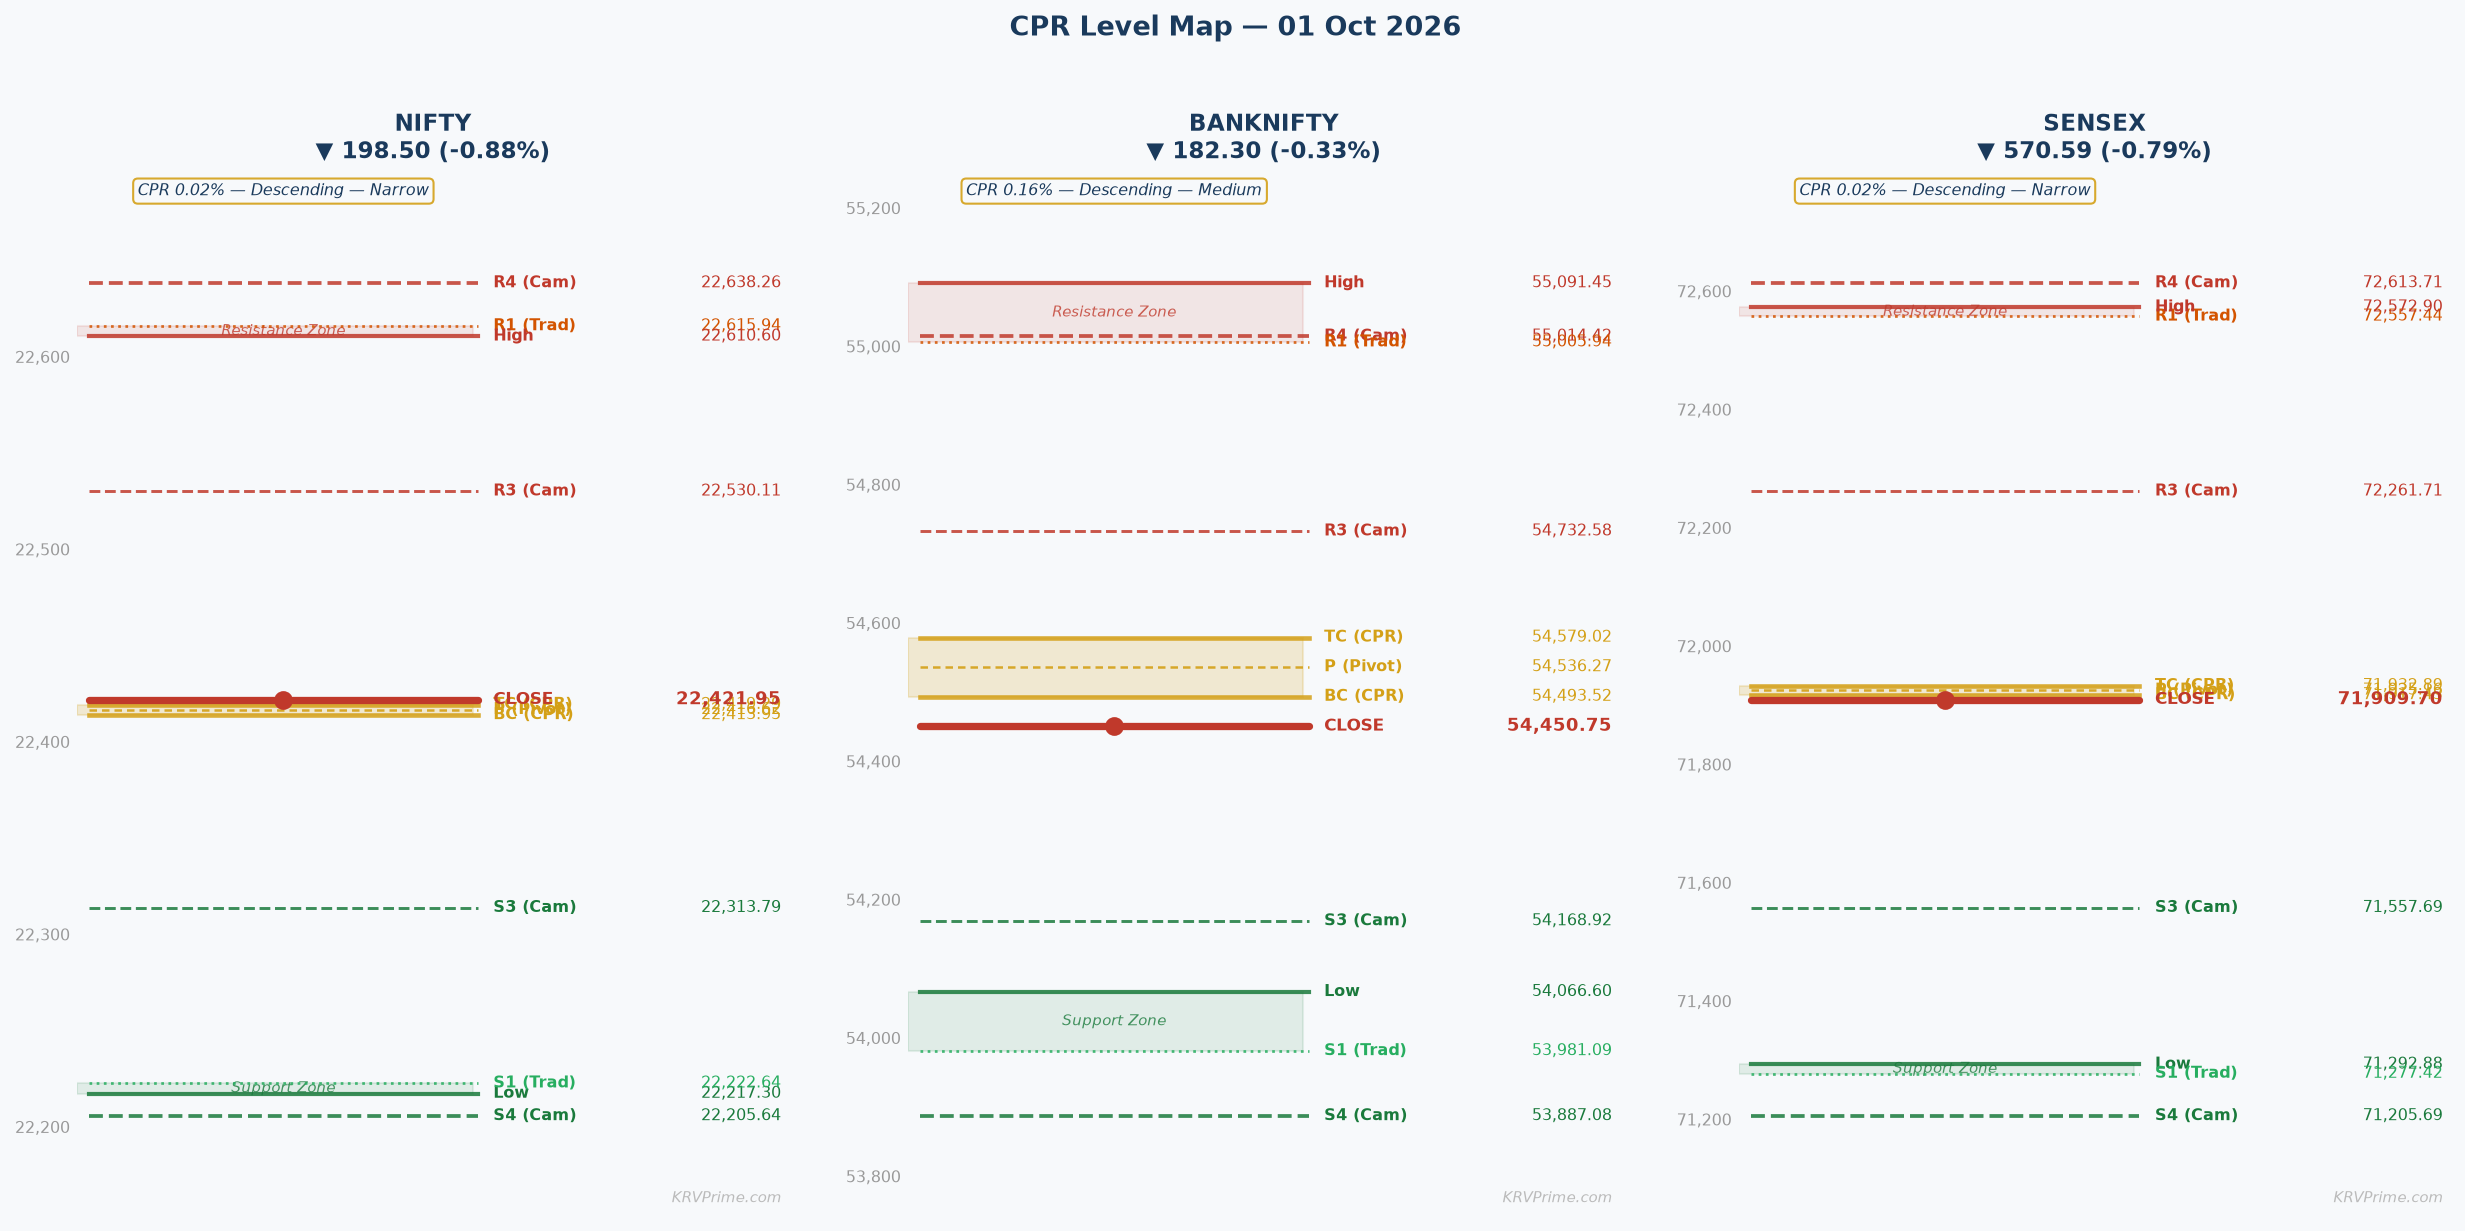
Tomorrow's Complete Level Map
OI-R: 23,000 R3: 23,009.24 H6: 22,818.87 H5: 22,764.58 R2: 22,809.92 H4 ▶: 22,638.26 R1: 22,615.94 PDH: 22,610.60 H3 ↩: 22,530.11
TC: 22,419.29 P: 22,416.62 BC: 22,413.95
L3 ↩: 22,313.79 PDL: 22,217.30 S1: 22,222.64 L4 ▶: 22,205.64 S2: 22,023.32 L5: 22,079.32 L6: 22,025.03 S3: 21,829.34 OI-S: 22,000
↩ = Camarilla reversal point | ▶ = Camarilla breakout/breakdown trigger | OI-R/OI-S = Options wall (CE/PE max OI)
▲ Higher Open (Gap Up) — Open > Prev Close
▲ Bullish
Open lands: For a Descending CPR, the entire CPR band (BC 22,413.95 to TC 22,419.29) sits below the previous close of 22,421.95. A gap up open places price ABOVE TC 22,419.29, which is the scenario where a descending CPR produces a surprise 'above TC' open — this is structurally the most bullish configuration possible given the descending setup, as price opens above the entire CPR band that was supposed to act as overhead resistance.
CPR role: Launch pad and first support zone — since price opens above TC 22,419.29 in a descending CPR framework, the entire CPR band (22,413.95–22,419.29) flips from overhead pressure to immediate support. Any pullback toward this 5.34-point wide band should be treated as a buy-the-dip opportunity in the morning session, with the band acting as a trampoline for longs rather than a lid.
Minor Gap (0.05–0.25%) — Structure Dominant
A minor gap up of 0.05–0.25% would open NIFTY between approximately 22,433 and 22,477, placing price modestly above TC 22,419.29 but still well below Camarilla H3 at 22,530.11. With a Descending Narrow CPR (width just 0.02%), the CPR structure remains the dominant signal — the gap adds a mild bullish lean but does not override the structural bearish tone implied by the descending CPR being below yesterday's close. The first confirmation is a sustained hold above TC 22,419.29 on the first 15-minute candle close (Narrow CPR rule), targeting Camarilla H3 at 22,530.11 as the immediate scalp target; failure to hold TC on the 15-min close reverses the trade immediately toward P 22,416.62 and then BC 22,413.95.
Significant Gap (0.25–0.5%) — Balanced
A significant gap up of 0.25–0.50% would open NIFTY between approximately 22,478 and 22,533, placing price at or just above Camarilla H3 at 22,530.11 — meaning the index would open directly into the first Camarilla mean-reversion resistance zone. This is a critical configuration: a gap into H3 creates an immediate fade risk, as H3 is designed as the first reversal reference, and opening right at this level with a descending CPR below means delta-hedging flows from call writers near 22,530–22,550 (max pain zone) could cap the early move aggressively. The preferred play in this scenario is to wait for a 15-minute close above H3 22,530.11 before initiating longs toward R1 22,615.94 and PDH 22,610.60; alternatively, a 15-minute rejection at H3 (first candle high near 22,530 then close below 22,490) creates a strong fade trade targeting BC 22,413.95 and L3 22,313.79.
Large Gap (>0.5%) — Gap Direction Dominant
A large gap up exceeding 0.50% would open NIFTY above approximately 22,534, potentially testing or exceeding PDH 22,610.60 and approaching R1 22,615.94 on the opening tick — a scenario where the gap becomes the dominant signal, overriding the descending CPR structure. Opening above PDH 22,610.60 in this configuration means the OI resistance wall at 23,000 is still far away (578 points), but the immediate Camarilla H4 breakout trigger at 22,638.26 and Traditional R1 at 22,615.94 cluster together to form a very strong resistance zone that could cap the initial surge. The straddle of 260.55 points implies a maximum expected weekly move of ~260 points from 22,400 ATM, so an open near 22,650 already consumes the bulk of the weekly premium — gap-fill risk is high, and a return toward H3 22,530.11 or even the CPR band near 22,419 within 60–90 minutes should be anticipated; abort gap-continuation longs if 15-minute candle closes below H4 22,638.26 after opening above it.
|
▲ Upside Path → OI-R The confirmed upside path from a gap-up open runs: **CPR band (22,413.95–22,419.29) → Camarilla H3 22,530.11 → PDH 22,610.60 / R1 22,615.94 → H4 22,638.26 → H5 22,764.58 → H6 22,818.87 → R2 22,809.92 → OI-R 23,000**, with H3 22,530.11 being the first partial profit level (take 40% off) and H4 22,638.26 requiring a confirmed 15-min close above it to justify continuation toward H5 and the OI resistance wall. Volume confirmation is critical at each Camarilla level — genuine momentum shows as expanding volume on the break of H3, while thin volume breaks of H3 that reverse within 1–2 candles should be treated as false breakouts and trigger trail stops. |
▼ Downside Path → OI-S The failure path from a gap-up open is: **TC 22,419.29 fails to hold → P 22,416.62 → BC 22,413.95 → L3 22,313.79 → PDL 22,217.30 / S1 22,222.64 → L4 22,205.64 → OI-S 22,000**, with a 15-min close below BC 22,413.95 being the trigger that converts a gap-up 'higher open' into a bearish trending day, consistent with the Descending CPR narrative where the gap was a trap. Loss of TC 22,419.29 means the descending CPR has re-established overhead control and the entire bullish gap-up thesis collapses — bears target the OI support floor at 22,000 which has massive PE open interest providing a gravitational pull on any sustained breakdown. |
| 🔴 OI-R: The OI resistance at **23,000** represents the highest CE open interest strike in the weekly series, meaning a massive concentration of call writers have sold the 23,000 CE — these writers will aggressively defend this level through delta-hedging (selling futures as price rises), creating an almost impenetrable ceiling for any single intraday session. In a gap-up scenario, 23,000 is not a realistic intraday target from 22,421 levels (578 points away, exceeding the full weekly straddle of 260.55), so it functions as a structural ceiling that keeps call premiums deflated and reduces the risk/reward of buying calls outright in the higher-open scenario. | 🟢 OI-S: The OI support at **22,000** is the highest PE open interest strike, where put writers have established a very large base — this level is 421 points below Friday's close and represents the zone where put writers would need to start covering, potentially creating a reflexive bounce if price were to approach it. In a gap-up scenario, 22,000 functions as the extreme abort level: if a gap-up open reverses and price collapses all the way to 22,000 during the session, the weekly straddle (260 pts) would be fully monetized on the put side and the session would have produced a textbook trap-the-bulls reversal day. |
⚡ Key Trigger: The primary trigger for the higher-open scenario is a **first 15-minute candle close above TC 22,419.29** (Narrow CPR confirmation rule), with the sustained hold of the CPR band (22,413.95–22,419.29) as support confirming that the gap-up structure is holding and bulls are in control of the morning session. If the 15-min candle closes above TC 22,419.29 with above-average volume, the trade is long toward H3 22,530.11 as the first partial profit target, with a trail stop moved to BC 22,413.95; a 15-min close back below BC 22,413.95 reverses the bias entirely to bearish, targeting L3 22,313.79 and S1 22,222.64.
▼ Lower Open (Gap Down) — Open < Prev Close
▼ Bearish
Open lands: For a Descending CPR where the entire band (BC 22,413.95 to TC 22,419.29) already sits just below the previous close of 22,421.95, a gap-down open places price decisively below the entire CPR band — the index opens below BC 22,413.95, below P 22,416.62, and below TC 22,419.29, confirming the Descending CPR's bearish structure from the very first tick. This is the highest-probability bearish configuration: the descending CPR was already signaling a 'resistance-below' structure, and a gap down confirms that sellers controlled the overnight session and are likely to remain in control.
CPR role: Overhead resistance and bearish confirmation zone — the entire CPR band (BC 22,413.95 to TC 22,419.29) now sits above the opening price, acting as a ceiling that price must reclaim before any bullish thesis can be activated. Any initial bounce attempt that stalls at or below BC 22,413.95 without a confirmed 30-minute close above it validates the bear trend resumption and targets L3 22,313.79.
Minor Gap (0.05–0.25%) — Structure Dominant
A minor gap down of 0.05–0.25% opens NIFTY between approximately 22,366 and 22,410, placing price just below BC 22,413.95 and below the entire narrow CPR band (22,413.95–22,419.29). The Descending Narrow CPR (width 0.02%) is the dominant signal, and with a Trending market structure, even a minor gap down into a descending CPR creates a high-probability trending bear day setup where the CPR band acts as resistance on any early recovery attempt. The trade setup is: watch the first 30-minute candle (Medium rule adjusted; Narrow CPR rule says 15-min) — a 15-min close that fails to reclaim BC 22,413.95 confirms bears are in control, targeting L3 22,313.79 → PDL 22,217.30 / S1 22,222.64 as the session's primary downside targets, with a stop above TC 22,419.29.
Significant Gap (0.25–0.5%) — Balanced
A significant gap down of 0.25–0.50% opens NIFTY between approximately 22,310 and 22,366, directly testing or breaching Camarilla L3 at 22,313.79, which is the first mean-reversion reference and a critical level for intraday sentiment. Opening at or below L3 22,313.79 immediately activates the bear breakdown sequence — L3 is where short-sellers typically add positions expecting a retest of L4 22,205.64 and PDL 22,217.30, and PUT writers at the 22,000 OI support strike would begin hedging their delta by selling futures, compounding the downside pressure. Recovery requires a 30-minute close back above BC 22,413.95 (a reclaim of 100+ points), which is unlikely in a significant gap-down on a trending day; failure to reclaim creates a measured move toward L4 22,205.64 → S1 22,222.64 → L5 22,079.32 → OI-S 22,000.
Large Gap (>0.5%) — Gap Direction Dominant
A large gap down exceeding 0.50% opens NIFTY below approximately 22,310, potentially reaching toward PDL 22,217.30 and S1 22,222.64 on the open itself — a panic-inducing start that places price near the bottom of the previous session's range within the first minute. With India VIX unavailable, this scenario carries amplified risk as gap-fill probability cannot be calibrated against realized volatility; however, the monthly Camarilla L4 at 21,755.03 and OI support at 22,000 provide the roadmap: price approaching 22,000 within the session would represent a full monetization of the weekly straddle (260.55 pts from 22,400) and would likely trigger aggressive PUT writer covering and short-covering bounces. The straddle-based abort level for shorts initiated on this gap down is L5 22,079.32 — if price closes a 15-min candle below L5, cover partial shorts and trail stops, as L6 22,025.03 and OI-S 22,000 are the final targets where institutional put writers must defend or exit.
|
▲ Upside Path → OI-R The recovery path from a gap-down open is: **BC 22,413.95 (first resistance) → P 22,416.62 → TC 22,419.29 (bull trigger) → H3 22,530.11 → max pain 22,550 → PDH 22,610.60 / R1 22,615.94 → OI-R 23,000**, with each level requiring a 15-minute candle confirmation above it to justify adding to recovery longs — volume expansion on the reclaim of TC 22,419.29 is the clearest signal that institutional buyers are active and the gap was a shakeout rather than a genuine breakdown. Without volume confirmation on reclaiming TC, treat any bounce as a dead-cat move and maintain the bearish bias. |
▼ Downside Path → OI-S The primary bear path from a lower open is: **L3 22,313.79 (first bear target) → PDL 22,217.30 / S1 22,222.64 (cluster support) → L4 22,205.64 (breakdown trigger) → L5 22,079.32 → L6 22,025.03 → OI-S 22,000**, with retail stop-losses densely packed just below PDL 22,217.30 (previous session's low), meaning a confirmed break below 22,217 will trigger an algorithmic cascade toward L4 22,205.64 and L5 22,079.32 with minimal friction. The OI support wall at 22,000 is the ultimate bear target where PUT writers holding the largest PE open interest must either defend (buy futures) or allow assignment — a test of 22,000 would be the session's climax move. |
| 🔴 OI-R: In a gap-down scenario, the OI resistance at **23,000** is entirely irrelevant as an intraday target — it sits 1,000+ points above a gap-down open and functions purely as a structural ceiling on any multi-day recovery. CE writers at 23,000 are deeply profitable on this gap-down and their short gamma positions mean they are naturally delta-short (selling rallies), further anchoring the upside at far closer levels like R1 22,615.94 and H4 22,638.26. | 🟢 OI-S: The OI support at **22,000** is the primary bear target and PUT monetization zone — with the largest PUT open interest at the 22,000 strike, every 100-point move lower from 22,421 toward 22,000 adds approximately 2.4x delta exposure to PUT holders who bought protection, creating natural selling pressure as their hedge becomes more valuable. If price reaches 22,000 during the session, expect a sharp but potentially short-lived bounce as PUT writers scramble to delta-hedge by buying futures, making the 22,000 level a 'high-volatility reversal zone' rather than a clean breakdown level. |
⚡ Key Trigger: The key trigger in a lower-open scenario is the **failure to reclaim BC 22,413.95 on the first 15-minute candle close** (Narrow CPR confirmation rule), which confirms the descending CPR's bearish overhead resistance structure is intact and activates the bear trending day thesis targeting L3 22,313.79 and then S1 22,222.64. The bull reclaim trigger is a 15-minute candle close above TC 22,419.29 — this would indicate that buyers absorbed the gap-down, breached the entire descending CPR band, and are converting the session to a recovery pattern with targets at H3 22,530.11 and the max pain zone near 22,550.
◆ Near Flat Open — Open ≈ Prev Close (±0.05%)
◆ Neutral
Open lands: A ±0.05% flat open places NIFTY between approximately 22,411 and 22,433 — this range completely engulfs the entire Descending Narrow CPR band (BC 22,413.95 to TC 22,419.29, width just 5.34 points). The open is essentially inside or immediately adjacent to the entire CPR band, creating a precision decision zone where the direction of the first 15-minute candle is the trade — there is no gap bias to lean on, making this the purest CPR setup of the three scenarios.
CPR role: Decision zone and compression trigger — with a Descending Narrow CPR (width 0.02%), a flat open inside the band creates a maximum-compression environment where the market has absorbed yesterday's 0.88% decline and is consolidating right at the equilibrium pivot. The Trending market structure (not sideways) means this compression inside a narrow descending band is a coiled spring — the first directional close outside the CPR (above TC 22,419.29 or below BC 22,413.95) will unleash a trending move with high probability.
Near Flat (±0.05%)
A flat open inside or immediately adjacent to the Descending Narrow CPR band (BC 22,413.95–TC 22,419.29) is the highest-information setup of the session, because with only 5.34 points of width between BC and TC, the first 15-minute candle close is definitively above or below the band with near-zero ambiguity — this is the purest expression of the Narrow CPR rule in action. The descending nature of the CPR means the ENTIRE band is already shifted bearward relative to yesterday's close, so even a flat open marginally below prev close (22,410–22,421) is structurally inside bearish territory, while only a close above TC 22,419.29 breaks that bearish posture and signals hidden buying interest. With CPR width at just 0.02% — the narrowest possible classification — statistical probability of a trending day (either clearly up or clearly down) is very high, often exceeding 70% in backtested narrow-CPR Trending market structure combinations, driven by the market's need to seek price discovery away from the compressed equilibrium zone. The bull trigger is a **15-minute candle close above TC 22,419.29** targeting H3 22,530.11 immediately, while the bear trigger is a **15-minute candle close below BC 22,413.95** targeting L3 22,313.79 → S1 22,222.64 — both triggers should be accompanied by volume above the session's average to distinguish a genuine directional move from a low-liquidity drift.
|
▲ Upside Path → OI-R The confirmed bull path from a flat open is: **TC 22,419.29 (trigger) → H3 22,530.11 (first partial, take 40%) → max pain 22,550 → PDH 22,610.60 / R1 22,615.94 (cluster; second partial, take 30%) → H4 22,638.26 (breakout level; require 15-min close above) → H5 22,764.58 → H6 22,818.87 → R2 22,809.92 → OI-R 23,000**, with each Camarilla level acting as a natural partial profit zone and the OI resistance at 23,000 functioning as the session's absolute ceiling where CE writers will not allow sustained trade. Volume expansion on the initial break above TC 22,419.29 is the single most important confirmation — thin-volume breaks above TC should be treated with skepticism and tight stops. |
▼ Downside Path → OI-S The confirmed bear path from a flat open is: **BC 22,413.95 (trigger) → L3 22,313.79 (first partial, cover 40%) → PDL 22,217.30 / S1 22,222.64 (cluster; second partial, cover 30%) → L4 22,205.64 (breakdown trigger; stop-loss cascade zone) → L5 22,079.32 → L6 22,025.03 → OI-S 22,000**, with the densest retail stop-losses concentrated just below PDL 22,217.30 meaning an algorithmic acceleration is highly probable once price closes a 15-min candle below L3 22,313.79. The OI support at 22,000 terminates the downside path for the weekly cycle — arriving there intraday would be a 421-point move from close, exceeding the full weekly straddle of 260.55 points, making it a tail-risk rather than a base-case bear target. |
| 🔴 OI-R: In a flat-open scenario, the OI resistance at **23,000** serves as the week-long structural ceiling maintained by CE writers who have sold the 23,000 call in bulk — these writers are short gamma and will delta-hedge by selling NIFTY futures on any meaningful rally above 22,600, creating a natural deceleration in upside momentum well before price approaches 23,000. The 23,000 OI wall also provides options buyers with poor risk/reward on call purchases near current levels, as the 156.95 premium for the 22,400 CE already prices in most of the expected move (260.55 pts straddle), further suppressing bullish momentum from flat-open conditions. | 🟢 OI-S: In a flat-open scenario, the OI support at **22,000** acts as the PE writer's defense base — large put sellers at 22,000 strike are deeply out-of-the-money from the flat-open level of ~22,421, meaning they will not need to actively hedge unless price drops below approximately 22,200 (where delta becomes more meaningful for the 22,000 PE). For the flat-open day, 22,000 is a psychological floor and ultimate bear abort level, providing confidence to short-sellers that any move toward 22,000 will attract aggressive institutional PUT writer covering, creating a potential intraday reversal zone if price were to reach that extreme. |
⚡ Key Trigger: The exact dual trigger is: **Bull — first 15-min close above TC 22,419.29** (initiates long toward H3 22,530.11, stop below BC 22,413.95); **Bear — first 15-min close below BC 22,413.95** (initiates short toward L3 22,313.79, stop above TC 22,419.29). TC 22,419.29 and BC 22,413.95 are the structural fulcrum because they represent the upper and lower bounds of the market's last equilibrium estimate — a close outside either boundary signals that either buyers (above TC) or sellers (below BC) have seized morning control and market participants on the losing side will aggressively re-hedge, accelerating the move in the breakout direction.
BANKNIFTY
Descending — Medium (Width 0.16%)
▼ Bearish
Market Structure Balanced or transitional | Straddle ATM 54,500 monthly straddle = 1,056.65 (Call) + 777.30 (Put) = **1,833.95 points**, implying an expected monthly move of approximately ±1,834 points from 54,500, placing the upper bound near 56,334 and lower bound near 52,666 for the October expiry cycle. The call premium (1,056.65) significantly exceeds the put premium (777.30), indicating a mild upside skew in the monthly book — options writers are pricing more risk to the upside despite the current bearish price action, possibly reflecting the large distance between current price (54,450) and monthly max pain (56,000) which suggests the market must rally 1,550 points to satisfy option sellers by expiry. | Max Pain BANKNIFTY monthly max pain is at **56,000** (expiry 27-Oct-2026), which sits approximately 1,549 points above Friday's close of 54,450.75 — a very significant gap between current price and the level where option sellers are most comfortable. This implies that monthly option sellers collectively need BANKNIFTY to recover toward 56,000 over the next ~3.5 weeks, creating a persistent underlying bid from option sellers who will delta-hedge by buying futures as the index drifts further from max pain. However, the Descending CPR and current bearish price structure mean this recovery is not imminent on 02 Oct — the max pain provides a multi-day directional anchor for swing traders rather than an intraday target. |
Tomorrow's Complete Level Map
OI-R: 58,000 R3: 56,030.79 H6: 55,482.88 H5: 55,343.61 R2: 55,561.12 H4 ▶: 55,014.42 R1: 55,005.94 PDH: 55,091.45 H3 ↩: 54,732.58
TC: 54,579.02 P: 54,536.27 BC: 54,493.52
L3 ↩: 54,168.92 PDL: 54,066.60 S1: 53,981.09 L4 ▶: 53,887.08 S2: 53,511.42 L5: 53,557.89 L6: 53,418.62 S3: 52,956.24 OI-S: 52,000
↩ = Camarilla reversal point | ▶ = Camarilla breakout/breakdown trigger | OI-R/OI-S = Options wall (CE/PE max OI)
▲ Higher Open (Gap Up) — Open > Prev Close
▲ Bullish
Open lands: For a Descending CPR, the CPR band (BC 54,493.52 to TC 54,579.02) sits below the previous close of 54,450.75 — however, note that BANKNIFTY closed at 54,450.75 which is actually BELOW BC 54,493.52, meaning the close was already below the entire descending CPR band. A gap up open from 54,450.75 that exceeds BC 54,493.52 enters the CPR band itself, while a gap up above TC 54,579.02 places price fully above the descending CPR — the more bullish of the two sub-cases.
CPR role: Battleground and conversion zone — since yesterday's close was below BC 54,493.52, a gap up that reclaims the CPR band converts it from resistance to a potential launch pad. The 85.50-point wide Medium CPR band (54,493.52–54,579.02) is wide enough to act as a trading range within itself in the early session, making a 30-minute close above TC 54,579.02 the key bull confirmation rather than just a 15-minute close.
Minor Gap (0.05–0.25%) — Structure Dominant
A minor gap up of 0.05–0.25% opens BANKNIFTY between approximately 54,478 and 54,587, which straddles the CPR band itself — the lower bound of this range (54,478) remains below BC 54,493.52 while the upper bound (54,587) is just above TC 54,579.02, meaning the opening tick could land anywhere within or just outside the Medium CPR band. With a Descending Medium CPR and a Balanced/Transitional market structure, the medium width (0.16%) makes this a contested zone where bulls need a 30-minute close above TC 54,579.02 to confirm control — the 30-minute rule for Medium CPR is critical here and distinguishes genuine buyers from opening noise. The first target on a confirmed 30-min close above TC 54,579.02 is H3 54,732.58 (take 35% partial here), with R1 55,005.94 and H4 55,014.42 forming the next cluster target; a failure to close above TC 54,579.02 within 30 minutes restores the bearish structure and targets L3 54,168.92.
Significant Gap (0.25–0.5%) — Balanced
A significant gap up of 0.25–0.50% opens BANKNIFTY between approximately 54,587 and 54,724, placing price above TC 54,579.02 and approaching Camarilla H3 at 54,732.58 — the first mean-reversion resistance zone for BANKNIFTY. Opening above TC 54,579.02 in a Descending Medium CPR is a bullish surprise that puts the CPR band immediately below as support, but the proximity to H3 54,732.58 within the first 30 minutes creates gap-fill risk as H3 is the natural first reversal reference where mean-reversion traders will initiate shorts. The strategy in this sub-scenario is to watch the first 30-minute candle: if it closes above H3 54,732.58 with expanding volume, longs are confirmed toward PDH 55,091.45 and R1 55,005.94; if the 30-min candle closes below TC 54,579.02 after opening above it, the gap up was a trap and bears target L3 54,168.92 and PDL 54,066.60.
Large Gap (>0.5%) — Gap Direction Dominant
A large gap up exceeding 0.50% opens BANKNIFTY above approximately 54,724, potentially reaching H3 54,732.58 or beyond toward the critical H4 breakout level at 55,014.42 — in this case, the gap is the dominant signal overriding the descending CPR structure. Opening near or above H4 55,014.42 (which clusters tightly with R1 55,005.94 and PDH 55,091.45) creates a very congested resistance zone within the first 10 minutes: H4 breakout above 55,014.42 requires a 30-minute confirmed close above it, and a failure to sustain above H4 on the 30-min close would be a strong fade signal targeting TC 54,579.02 and BC 54,493.52. The monthly straddle of 1,833.95 points provides context — a large gap up of, say, 300 points (55,000 open) still leaves enormous room on the upside toward H5 55,343.61 and H6 55,482.88, but these levels are 343–483 points away from the gap-up open and represent aggressive intraday extension; the OI resistance at 58,000 is irrelevant intraday.
|
▲ Upside Path → OI-R The confirmed upside path from a gap-up open is: **TC 54,579.02 (30-min confirmation) → H3 54,732.58 (first partial, 35%) → PDH 55,091.45 / R1 55,005.94 / H4 55,014.42 (cluster; require 30-min close above H4) → H5 55,343.61 → H6 55,482.88 / R2 55,561.12 (second partial) → R3 56,030.79 → max pain 56,000 → OI-R 58,000**, noting that OI-R at 58,000 is a multi-week structural ceiling (3,550 points away) and not an intraday target — intraday bulls should exit at H5 55,343.61 or H6 55,482.88 depending on momentum, with volume confirmation required at each Camarilla level to distinguish a genuine trend day from a mean-reversion move. The clustering of H4 55,014.42, R1 55,005.94, and PDH 55,091.45 within 85 points of each other creates a powerful resistance zone that will test any sustained gap-up rally. |
▼ Downside Path → OI-S The failure path from a gap-up open is: **TC 54,579.02 fails on 30-min close → P 54,536.27 → BC 54,493.52 → L3 54,168.92 → PDL 54,066.60 (below L3; cluster) → S1 53,981.09 → L4 53,887.08 → OI-S 52,000**, with the loss of BC 54,493.52 on a 30-minute close being the definitive bearish confirmation that the gap was absorbed by sellers and the descending CPR structure is back in control. Retail stop-losses on gap-up longs will cluster near BC 54,493.52 and below, so a close below BC on the 30-min candle will trigger a cascade of stops that accelerates toward L3 54,168.92 within 1–2 additional candles. |
| 🔴 OI-R: The OI resistance at **58,000** is the highest CE open interest strike for BANKNIFTY's monthly series, sitting 3,549 points above Friday's close — this level is a structural multi-week ceiling that is entirely irrelevant as an intraday target even in the most aggressive gap-up scenario. CE writers at 58,000 are deeply profitable at current levels and their delta-hedging activity (selling futures on rallies above 55,000–56,000) will create headwinds long before price approaches the 58,000 strike, making 58,000 an anchor for monthly swing context rather than daily trading. | 🟢 OI-S: The OI support at **52,000** represents the highest PUT open interest strike for BANKNIFTY's monthly series and is 2,450 points below Friday's close, functioning as the ultimate monthly floor where put writers will aggressively defend through futures buying. In a gap-up scenario, 52,000 is irrelevant intraday, but its existence as a massive put-writing base means that any single-session decline toward 52,000 would be met with extraordinary institutional buying — providing BANKNIFTY longs with a structural safety net for the broader monthly trade even when daily signals are bearish. |
⚡ Key Trigger: The key trigger for BANKNIFTY's higher-open scenario is a **30-minute candle close above TC 54,579.02** (Medium CPR confirmation rule), which would confirm that buyers have absorbed the descending CPR overhead and reclaimed the upper boundary of the CPR band — a structurally bullish event in a Balanced/Transitional market that could signal a trend-day up developing. If the 30-minute candle closes back below BC 54,493.52 after a gap-up open above it, the gap is confirmed as a false move and the bear thesis resumes toward L3 54,168.92, with the entire gap-up serving as a distribution zone for institutional sellers.
▼ Lower Open (Gap Down) — Open < Prev Close
▼ Bearish
Open lands: BANKNIFTY closed at 54,450.75, which is already below BC 54,493.52 (the lower boundary of the Descending CPR). A gap-down open moves price further below the entire CPR band, reinforcing the Descending CPR's bearish signal and placing L3 54,168.92 as the first Camarilla support that may be tested within the morning session — the gap down increases the probability that L3 will be reached and potentially broken if selling momentum is sustained.
CPR role: Overhead resistance and bearish acceleration zone — with price already below the entire descending CPR band before any gap down, the band (BC 54,493.52 to TC 54,579.02) sits as a double-layered overhead resistance that must be fully reclaimed (30-min close above TC 54,579.02) to neutralize the bearish setup. Even a gap-fill recovery toward BC 54,493.52 would constitute a 43-point recovery from the previous close and would stall at the lower boundary of the CPR resistance band.
Minor Gap (0.05–0.25%) — Structure Dominant
A minor gap down of 0.05–0.25% opens BANKNIFTY between approximately 54,314 and 54,423, placing price between L3 54,168.92 and BC 54,493.52 — well within the previous session's range and below the entire CPR band. With the Descending Medium CPR already establishing bearish overhead pressure and the Balanced/Transitional structure suggesting direction-seeking behavior, a minor gap down into this zone immediately tests the resilience of buyers near L3 54,168.92 (the Camarilla mean-reversion support). The 30-minute rule for Medium CPR means waiting for the first 30-min candle close to determine direction: a close above BC 54,493.52 activates gap-fill recovery toward P 54,536.27 and TC 54,579.02, while a 30-min close below L3 54,168.92 confirms bear breakdown targeting PDL 54,066.60 and S1 53,981.09.
Significant Gap (0.25–0.5%) — Balanced
A significant gap down of 0.25–0.50% opens BANKNIFTY between approximately 54,178 and 54,314, landing near or just below Camarilla L3 54,168.92 — a critical threshold because opening at L3 means the first trade of the day is already at the mean-reversion support level, dramatically compressing the reward-to-risk for new shorts while creating an attractive risk/reward for cautious longs. However, the Descending CPR overhead and the fact that yesterday's close was already below the CPR band means the 'balanced/transitional' market structure may be resolving to the downside: a 30-min close below L3 54,168.92 confirms breakdown and creates a measured bear move toward PDL 54,066.60 → L4 53,887.08 → S1 53,981.09 (note: S1 53,981.09 and L4 53,887.08 cluster within 94 points, forming a strong support band). PUT writing at 52,000 means institutional participants are not genuinely alarmed by a move to 54,000 levels — this absence of panic could limit the intraday downside to the L3–L4 zone unless macro catalysts intervene.
Large Gap (>0.5%) — Gap Direction Dominant
A large gap down exceeding 0.50% opens BANKNIFTY below approximately 54,178, potentially testing PDL 54,066.60 or even the S1/L4 cluster (53,887.08–53,981.09) on the opening tick — a significant bearish event that would signal institutional overnight selling and activate panic-mode intraday dynamics. In this scenario, the monthly straddle context (1,833.95 points from 54,500) becomes relevant: a large gap down of 300–500 points begins to approach the short PUT strike range for active traders who sold 54,000–53,500 puts, forcing delta-hedging that accelerates the move lower before a sharp reversal. Recovery levels to watch from a large gap-down open are: first, a 30-min close back above L3 54,168.92 (potential dead-cat bounce target); second, a sustained 30-min close above BC 54,493.52 to neutralize the bear; worst-case extension sees L5 53,557.89 and L6 53,418.62 before the OI support at 52,000 provides the ultimate floor.
|
▲ Upside Path → OI-R The recovery path from a lower open is: **BC 54,493.52 (first resistance, watch for rejection) → P 54,536.27 → TC 54,579.02 (30-min close above = bull trigger) → H3 54,732.58 (first partial on recovery longs) → PDH 55,091.45 / R1 55,005.94 (second partial) → OI-R 58,000 (multi-week ceiling)**. Volume confirmation at the TC reclaim level (above-average on the 30-min close above TC 54,579.02) is essential — without volume, a close above TC in a descending CPR on a gap-down day is likely a short-squeeze rather than genuine recovery and will reverse rapidly. |
▼ Downside Path → OI-S The bear path from a lower open is: **L3 54,168.92 (first target, partial cover) → PDL 54,066.60 (previous low; emotional support level) → S1 53,981.09 / L4 53,887.08 (cluster; 94-point support band; major partial cover zone) → L5 53,557.89 → L6 53,418.62 / S2 53,511.42 (cluster) → S3 52,956.24 → OI-S 52,000**, with retail stop-losses concentrated below PDL 54,066.60 driving the acceleration toward the S1/L4 cluster and the monthly straddle lower bound (54,500 - 1,833.95 = 52,666) providing a natural deceleration zone before the 52,000 OI floor. |
| 🔴 OI-R: The OI resistance at **58,000** in a lower-open scenario is the distant structural ceiling maintained by monthly call writers at the 58,000 strike — in a gap-down session, this level is entirely irrelevant as an intraday consideration but its existence as a short call base means institutional participants are aggressively selling rallies above 56,000 (the R3/max-pain zone), which structurally suppresses any multi-day recovery and justifies a 'sell-the-rally' approach at higher Camarilla levels (H4 55,014.42 and H5 55,343.61) on any bounce from the gap-down. | 🟢 OI-S: The OI support at **52,000** is the most important structural level for the bearish scenario — it represents the strike with the highest PUT open interest in the monthly series, meaning the floor below which put writers will begin to take serious losses and be forced to either cover (buy futures) or roll. A move toward 52,000 in the current session would be an extreme tail event (2,450 points from close), but the gravitational pull of this OI wall means that sharp declines toward 53,000–53,500 (S3 52,956.24 and L6 53,418.62) should see PUT writer delta-buying that creates counter-trend bounces — making these levels natural intraday reversal zones for aggressive counter-trend scalpers. |
⚡ Key Trigger: The primary trigger in BANKNIFTY's lower-open scenario is: **failure to reclaim BC 54,493.52 on a 30-minute candle close** confirms that the Descending CPR has established firm overhead resistance and the session will be a bear trending day, targeting L3 54,168.92 → L4 53,887.08 → S1 53,981.09 in sequence. The bull reclaim trigger is a **30-minute candle close above TC 54,579.02** which would require a 130+ point intraday recovery from the gap-down open — an unlikely but not impossible recovery in BANKNIFTY given its higher daily ATR; this bull trigger would target H3 54,732.58 and H4 55,014.42 as the session recovery targets.
◆ Near Flat Open — Open ≈ Prev Close (±0.05%)
◆ Neutral
Open lands: A ±0.05% flat open places BANKNIFTY between approximately 54,423 and 54,478 — this range sits BELOW BC 54,493.52, meaning even a flat open leaves price outside (below) the entire Descending Medium CPR band (54,493.52–54,579.02). This is the 'Descending Trend Reversal' sub-scenario where yesterday's close (54,450.75) was already below BC (54,493.52), and a flat open continues to trade below the entire CPR band — making the band purely overhead resistance from the very first tick.
CPR role: Overhead resistance band and directional decision wall — with a flat open below BC 54,493.52, the entire CPR band sits above price as a resistance block. The Medium CPR width of 0.16% (85.50 points) means there's meaningful distance between BC and TC, and price must first reclaim BC, then P, then TC to neutralize the bearish structure — a three-step recovery process that takes time and volume, making the flat-open flat-CPR configuration particularly bearish for BANKNIFTY on 02 Oct.
Near Flat (±0.05%)
A flat open near 54,450 in BANKNIFTY, with the entire Descending Medium CPR band (BC 54,493.52 to TC 54,579.02) sitting above, creates an immediate 'below-CPR' structure that is inherently bearish unless buyers can mount a decisive recovery — the Medium CPR confirmation rule requires a 30-minute close above TC 54,579.02 (129 points above a flat open) before bulls can claim structural control, setting a high bar for recovery. The BC at 54,493.52 is the first intraday resistance target just 43 points above a flat open: a test of BC followed by rejection on a 30-minute candle would be a textbook 'CPR resistance confirmed' signal, initiating the bear path toward L3 54,168.92; conversely, a 30-minute close above BC 54,493.52 (but not yet above TC 54,579.02) creates a 'wait inside the band' scenario where direction will be determined by whether price closes the subsequent 30-min candle above TC 54,579.02. With the Balanced/Transitional market structure, BANKNIFTY is at a genuine decision point — the CPR's descending nature (new TC 54,579.02 < previous BC) was supposed to signal continuation of the prior downtrend, and a flat open below the entire band reinforces this; however, the Balanced/Transitional label suggests some equilibrium-seeking behavior, meaning fade-from-extremes strategies (short near H3 54,732.58 or long near L3 54,168.92) may outperform pure trend-following on this day. Both triggers must be defined clearly for F&O traders: **Bull trigger — 30-min close above TC 54,579.02** initiates long toward H3 54,732.58 with stop below BC 54,493.52; **Bear trigger — 30-min close below the flat-open level (54,450) after a failed test of BC 54,493.52** initiates short toward L3 54,168.92 with stop above BC 54,493.52.
|
▲ Upside Path → OI-R The confirmed bull recovery path from a flat open is: **BC 54,493.52 (first reclaim target) → P 54,536.27 → TC 54,579.02 (30-min close above = bull trigger) → H3 54,732.58 (first partial, 35%) → PDH 55,091.45 / R1 55,005.94 / H4 55,014.42 (cluster; require 30-min close above H4 for continuation) → H5 55,343.61 → H6 55,482.88 → R3 56,030.79 / max pain 56,000 → OI-R 58,000**, with volume confirmation essential at TC and again at the H4/R1/PDH cluster — any recovery that lacks volume above the 30-min average at TC 54,579.02 should be treated as a short-squeeze rather than genuine trend reversal. Retests of TC 54,579.02 from above (after an initial close above it) should be bought with tight stops for continuation trades. |
▼ Downside Path → OI-S The confirmed bear path from a flat open is: **Failed BC test → flat-open level (~54,450) → L3 54,168.92 (first partial, cover 35%) → PDL 54,066.60 (previous session low; retail stop zone) → S1 53,981.09 / L4 53,887.08 (cluster support band; second partial, cover 30%) → L5 53,557.89 → L6 53,418.62 / S2 53,511.42 (cluster) → S3 52,956.24 → OI-S 52,000**, with the most explosive acceleration expected between PDL 54,066.60 and S1 53,981.09 as retail buyers who bought PDL in the previous session will be stopped out, adding fuel to the bear fire. The monthly straddle's lower bound (54,500 - 1,833.95 = 52,666) provides context for the maximum realistic bearish extension over the monthly cycle, with S3 52,956.24 being the nearest level to this zone and a natural intraday reversal area for aggressive scalpers. |
| 🔴 OI-R: In a flat-open scenario, the OI resistance at **58,000** maintains its role as the monthly structural ceiling written by institutional call sellers — from a flat open near 54,450, this level is 3,550 points away and creates a persistent gravitational pull that suppresses call premium buying throughout the session. The consequence for flat-open traders is that buying calls (CE) is expensive in premium relative to the expected daily move (straddle monthly 1,833.95 / 21 trading days ≈ 87 points/day), making the CPR-based directional view (short below BC 54,493.52, long above TC 54,579.02) the better risk/reward trade than outright premium buying. | 🟢 OI-S: In a flat-open scenario, the OI support at **52,000** represents where monthly PUT writers have established their base — these writers are profitable at the current price level (54,450 vs 52,000 strike) and will not actively hedge unless price drops below approximately 53,000–53,500, meaning they provide no active support for the 54,000–54,500 range. For flat-open traders, 52,000 is a distant anchor that confirms the ultimate monthly floor, allowing bears to trade confidently toward L3 54,168.92, L4 53,887.08, and S2 53,511.42 without fear of a massive institutional rescue until price approaches the 53,000 area where monthly put writing begins to pressure delta-hedging activity. |
⚡ Key Trigger: The exact dual trigger is: **Bull — 30-min candle close above TC 54,579.02** (requires 129-point recovery from flat open; stop below BC 54,493.52; target H3 54,732.58); **Bear — 30-min candle close below the flat-open level (~54,450) after a failed retest of BC 54,493.52** (stop above BC 54,493.52; target L3 54,168.92 → PDL 54,066.60). The fulcrum here is BC 54,493.52: it represents the lower boundary of the market's current equilibrium estimate, and a failed test of BC (price rallies toward it but 30-min close remains below) is the clearest signal that institutional sellers are defending the CPR band from above and the session will trend lower toward L3 and beyond.
SENSEX
Descending — Narrow (Width 0.02%)
▼ Bearish
Market Structure Trending (up or down trend) | Straddle ATM 71,900 weekly straddle = 9.65 (Call) + 0.05 (Put) = **9.70 points**, an extraordinarily tight straddle that indicates the weekly options (expiry 01-Oct-2026) were essentially expired/expiring at time of data capture — the 0.05 put premium and 9.65 call premium suggest this is a near-zero-DTE straddle snapshot, possibly from an expiry day, making it irrelevant for 02-Oct intraday analysis. The monthly straddle at ATM 71,900 (1,429.15 Call + 845.15 Put = **2,274.30 points**) is the relevant premium reference, implying an expected monthly move of approximately ±2,274 points from 71,900, placing the upper bound near 74,174 and lower bound near 69,626 for the October expiry. | Max Pain SENSEX weekly max pain at **71,900** (expiry 01-Oct-2026, which is yesterday) is already expired and irrelevant for 02-Oct trading. The monthly max pain at **74,000** (expiry 29-Oct-2026) sits approximately 2,090 points above Friday's close of 71,909.70, indicating a very large gap between current price and option sellers' comfort zone — similar to BANKNIFTY, this creates a structural bid from monthly put writers who need the index to recover toward 74,000 over the coming weeks, providing a multi-day recovery anchor even as short-term signals remain bearish. |
Tomorrow's Complete Level Map
OI-R: 72,000 R3: 73,837.46 H6: 73,200.79 H5: 73,024.85 R2: 73,205.18 H4 ▶: 72,613.71 R1: 72,557.44 PDH: 72,572.90 H3 ↩: 72,261.71
TC: 71,932.89 P: 71,925.16 BC: 71,917.43
L3 ↩: 71,557.69 PDL: 71,292.88 S1: 71,277.42 L4 ▶: 71,205.69 S2: 70,645.14 L5: 70,794.55 L6: 70,618.61 S3: 69,997.40 OI-S: 71,900
↩ = Camarilla reversal point | ▶ = Camarilla breakout/breakdown trigger | OI-R/OI-S = Options wall (CE/PE max OI)
▲ Higher Open (Gap Up) — Open > Prev Close
↕ Conflicted
Open lands: SENSEX has a Descending Narrow CPR (BC 71,917.43 to TC 71,932.89), with the close of 71,909.70 sitting just BELOW BC 71,917.43 — only 7.73 points below the lower boundary of the CPR band. A gap up open that exceeds BC 71,917.43 places price inside the CPR band, while a gap up above TC 71,932.89 places price fully above the descending CPR — either sub-case is structurally significant given how close the close was to the CPR band. Critically, SENSEX's OI resistance at 72,000 is only 90 points above Friday's close, and OI support at 71,900 is only 9.70 points below — this ultra-tight OI sandwich (72,000 CE resistance vs 71,900 PE support, only 100 points apart) makes SENSEX's higher-open scenario uniquely constrained.
CPR role: Launch pad with immediate OI ceiling — in a gap-up open above TC 71,932.89, the CPR band (71,917.43–71,932.89) acts as a near-term support/launch pad, but the OI resistance at 72,000 (only 67 points above TC) creates an immediate ceiling that will constrict any upside extension. This 100-point OI sandwich between 71,900 (PE support) and 72,000 (CE resistance) combined with the 15.46-point narrow CPR band makes SENSEX the most range-bound of the three indices for 02-Oct regardless of gap direction.
Minor Gap (0.05–0.25%) — Structure Dominant
A minor gap up of 0.05–0.25% opens SENSEX between approximately 71,946 and 72,090, placing price above TC 71,932.89 but approaching or reaching the critical OI resistance wall at 72,000 — a scenario where the gap-up opening immediately runs into the most important level of the session for SENSEX. The OI resistance at 72,000 (highest CE open interest strike) is only 54–90 points above the minor-gap opening range, meaning price could touch 72,000 within the first candle and face aggressive call-writer delta-hedging that caps the move instantly. The 15-minute confirmation rule for Narrow CPR applies: a 15-min close above TC 71,932.89 (already achieved by the gap-up open) is confirmed, but the more important test is whether price can sustain above OI-R 72,000 — a 15-min close above 72,000 would be a significant bullish signal targeting H3 72,261.71 and PDH 72,572.90, while a 15-min close below OI-R 72,000 after initially touching it signals a fade/reversal trade back toward TC 71,932.89 and then OI-S 71,900.
Significant Gap (0.25–0.5%) — Balanced
A significant gap up of 0.25–0.50% opens SENSEX between approximately 72,090 and 72,269, placing price above OI resistance at 72,000 and approaching Camarilla H3 at 72,261.71 — a scenario that immediately breaches the most important overhead level and creates a powerful momentum signal if sustained. Opening above OI-R 72,000 means CE writers at the 72,000 strike are now in-the-money and must aggressively delta-hedge by selling SENSEX futures, creating selling pressure that could quickly pull price back below 72,000 even as the gap-up momentum persists — this creates a 'whipsaw zone' between 72,000 and H3 72,261.71 in the first 15–30 minutes. The 15-minute Narrow CPR rule means watching for the first candle close: a 15-min close above H3 72,261.71 confirms genuine momentum toward PDH 72,572.90 and R1 72,557.44 (which cluster together), while a 15-min close back below OI-R 72,000 signals immediate reversal toward TC 71,932.89 and OI-S 71,900.
Large Gap (>0.5%) — Gap Direction Dominant
A large gap up exceeding 0.50% opens SENSEX above approximately 72,269, potentially reaching toward H3 72,261.71 (already within range) or higher toward H4 72,613.71 and PDH 72,572.90 — a scenario where the gap dominates structure and SENSEX opens in a zone well above both the OI resistance at 72,000 and the CPR band. In this large-gap scenario, the monthly straddle context is key: the monthly straddle of 2,274.30 points from 71,900 places the upper expected bound at approximately 74,174, meaning a 500-point gap up to 72,410 still has technical room to reach R1 72,557.44 and PDH 72,572.90 on momentum — however, this consumes a significant portion of the weekly range implied by the now-expired weekly straddle, and premium will decay rapidly. The abort level for large-gap longs is a 15-min close back below OI-R 72,000: if the gap-up opens above 72,269 but the first 15-min candle closes back below 72,000, the gap is a confirmed false breakout and bears target OI-S 71,900 → L3 71,557.69 in a sharp reversal.
|
▲ Upside Path → OI-R The confirmed upside path from a higher open on SENSEX: **TC 71,932.89 (CPR launch pad) → OI-R 72,000 (first confirmation above) → H3 72,261.71 (first partial, Narrow CPR rule: take at first Traditional target) → PDH 72,572.90 / R1 72,557.44 (cluster; second partial) → H4 72,613.71 → H5 73,024.85 → H6 73,200.79 / R2 73,205.18 (cluster) → monthly max pain 74,000 → OI-R exits thesis**. Volume is critical at each level — SENSEX volume confirmation above the 30-day average on the break of H3 72,261.71 is needed to justify continuation toward the PDH cluster, as thin-volume breaks of H3 in a Narrow Descending CPR often reverse sharply. |
▼ Downside Path → OI-S The failure path from a higher open: **OI-R 72,000 rejection → TC 71,932.89 (CPR band back as resistance) → OI-S 71,900 (PE support wall; extremely close) → BC 71,917.43 → L3 71,557.69 (first bear target, partial cover here) → PDL 71,292.88 / S1 71,277.42 (cluster) → L4 71,205.69 → S2 70,645.14 / L5 70,794.55 (cluster) → L6 70,618.61 → S3 69,997.40**. The proximity of OI-S 71,900 to the opening zone means a rejection at 72,000 could instantly breach OI-S 71,900 (only 100 points below OI-R), creating a sharp drop with little intermediate support until L3 71,557.69. |
| 🔴 OI-R: The OI resistance at **72,000** is the most uniquely positioned OI wall across all three indices today — it sits only 90 points above Friday's close of 71,909.70 and only 67 points above TC 71,932.89, meaning in a higher-open scenario, price opens directly into or immediately challenges this CE writing wall. Call writers at 72,000 are aggressively short gamma at this level, and their delta-hedging (selling futures as price approaches 72,000 from below) creates maximum selling pressure in the 71,950–72,050 zone — making a sustained close above 72,000 on the first 15-minute candle a very high-conviction bull signal that implies institutional absorption of the entire CE wall. | 🟢 OI-S: The OI support at **71,900** is the highest PE open interest strike — and at only 9.70 points below Friday's close and only 17.43 points below BC 71,917.43, it is the most immediately relevant OI level across all three indices today. In a higher-open scenario, 71,900 functions as the abort level for gap-up longs: if price gaps up but subsequently falls back through TC 71,932.89 and BC 71,917.43 and then closes a 15-min candle below OI-S 71,900, the weekly PUT writers at 71,900 will begin unwinding (selling futures to cover delta), creating a downward cascade toward L3 71,557.69 that would be the session's most bearish outcome. |
⚡ Key Trigger: The primary trigger for SENSEX's higher-open scenario is **holding above OI resistance 72,000 on the first 15-minute candle close** — this is the most critical level in the session given the ultra-tight OI sandwich, and a 15-min close above 72,000 signals that CE writers' delta-hedging pressure has been absorbed and genuine buyers are in control, targeting H3 72,261.71 as the next level. A 15-min close below OI-R 72,000 after a gap-up open above it is the bearish flip signal, with the trade reversing to short toward TC 71,932.89, OI-S 71,900, and then L3 71,557.69 — note that OI-S 71,900 and OI-R 72,000 being only 100 points apart makes this the narrowest OI sandwich in today's analysis and requires particularly disciplined trigger execution.
▼ Lower Open (Gap Down) — Open < Prev Close
▼ Bearish
Open lands: SENSEX closed at 71,909.70, which is already 7.73 points below BC 71,917.43 — the lower boundary of the Descending Narrow CPR. A gap-down open moves price further below the entire CPR band AND potentially below OI-S 71,900 (only 9.70 points below Friday's close), meaning even a minor gap down of 0.05% (~36 points) immediately tests or breaches the OI support wall at 71,900. This is the most structurally critical opening configuration for SENSEX: the gap down doesn't just break the CPR band (already done by Friday's close) — it tests the primary PE open interest support, potentially triggering a put-writer cascade.
CPR role: Overhead resistance ceiling and bearish acceleration zone — the entire CPR band (BC 71,917.43 to TC 71,932.89) sits above any gap-down open and represents the primary resistance to be overcome on any recovery. With the Descending Narrow CPR already below Friday's close, a gap down entrenches the bearish structure: the CPR band transitions from a borderline resistance to a definitive overhead ceiling that requires a full 15-minute close above TC 71,932.89 to neutralize the bear thesis.
Minor Gap (0.05–0.25%) — Structure Dominant
A minor gap down of 0.05–0.25% opens SENSEX between approximately 71,731 and 71,874, landing dangerously close to or directly at OI-S 71,900 — the PE open interest support wall — which is only 9.70 points below Friday's close. This is a particularly dangerous opening configuration for SENSEX: a minor gap down of even 0.05% (~36 points) from 71,909 opens at ~71,873, which is below OI-S 71,900 and triggers immediate delta-hedging from put writers who now need to sell futures to hedge their short put positions as the 71,900 strike becomes in-the-money. The 15-minute Narrow CPR rule means watching whether the first 15-min candle recovers above OI-S 71,900 (bullish gap-fill from put-writer covering), or whether a 15-min close below OI-S 71,900 confirms further breakdown toward L3 71,557.69 and PDL 71,292.88 — the OI support breaching is the most important intraday event for SENSEX on a gap-down day.
Significant Gap (0.25–0.5%) — Balanced
A significant gap down of 0.25–0.50% opens SENSEX between approximately 71,550 and 71,731, placing price directly at or below Camarilla L3 71,557.69 — the first mean-reversion support and the level below which Camarilla theory signals a genuine breakdown rather than a mere fluctuation. Opening at L3 71,557.69 on a significant gap down with a Descending Narrow CPR creates a clear, high-probability bear structure: the descending CPR sits nearly 375 points above (TC 71,932.89), OI-S 71,900 has been definitively breached (opening ~350 points below it), and the 15-min Narrow CPR confirmation rule points directly to L3 (already tested by the open) → PDL 71,292.88 / S1 71,277.42 as the session's primary bear targets. Put writers at 71,900 are now deep in the money and will aggressively cover by selling more futures (not buying — their delta requires further hedging), compounding the bearish flow unless a sharp reversal above L3 71,557.69 occurs on strong volume within the first 15-minute candle.
Large Gap (>0.5%) — Gap Direction Dominant
A large gap down exceeding 0.50% opens SENSEX below approximately 71,550, breaching L3 71,557.69 on the opening tick and potentially testing PDL 71,292.88 and S1 71,277.42 — a dramatic bearish event that would signal broad equity market distress given SENSEX's status as a macro sentiment barometer. In this scenario, the monthly straddle context (2,274.30 points from 71,900) provides the downside roadmap: the lower expected monthly bound is approximately 69,626, and levels like L4 71,205.69, L5 70,794.55, L6 70,618.61, and S2 70,645.14 are all within the monthly straddle's expected range. The straddle also implies that at-the-money PUT buying at 71,900 was at 845.15 premium — a large gap down of 500–600 points would push these puts deep ITM and create maximum straddle monetization, making this scenario the most rewarding for long-put holders purchased in yesterday's session.
|
▲ Upside Path → OI-R The recovery path from a lower open: **OI-S 71,900 (first reclaim target) → BC 71,917.43 → P 71,925.16 → TC 71,932.89 (15-min close above = bull trigger) → H3 72,261.71 (first partial) → OI-R 72,000 (note: OI-R is below H3; a close above OI-R 72,000 is confirmation within recovery) → PDH 72,572.90 / R1 72,557.44 (second partial) → H4 72,613.71 → monthly max pain 74,000**. Note the critical sequencing: OI-R at 72,000 sits below H3 at 72,261.71, meaning a recovery rally from a gap-down would pass through 72,000 (OI resistance) before reaching H3 — each level must be respected as a separate 15-min confirmation point to avoid being caught in a dead-cat bounce. |
▼ Downside Path → OI-S The primary bear path from a lower open: **OI-S 71,900 breached → L3 71,557.69 (first target, partial cover 40%) → PDL 71,292.88 / S1 71,277.42 (cluster; second partial 30%) → L4 71,205.69 (breakdown trigger below which cascade accelerates) → L5 70,794.55 / S2 70,645.14 (cluster; final partial for intraday) → L6 70,618.61 → S3 69,997.40 → monthly straddle floor ~69,626**. The retail stop-loss cascade below PDL 71,292.88 (previous session low) is particularly important for SENSEX — with derivatives traders heavily involved in the 71,900–72,000 CE/PE sandwich, a break below PDL will trigger a self-reinforcing move toward L4 71,205.69 that requires institutional intervention to halt. |
| 🔴 OI-R: In a lower-open scenario, the OI resistance at **72,000** sits 90+ points above the previous close and 131 points above TC 71,932.89, making it irrelevant as an immediate recovery target from a gap-down open. However, its structural role as the CE writing wall means that any attempted recovery rally from the gap-down will decelerate significantly as price approaches 72,000, since CE writers delta-sell into any rally that approaches their short strike — this creates a natural upper boundary for bounce trades, and traders should book partial profits on recovery longs as price approaches OI-R 72,000 rather than holding for a full reclaim. | 🟢 OI-S: In a lower-open scenario, the OI support at **71,900** is the single most important level for the entire SENSEX session — it is simultaneously the PE open interest support wall AND the reference point that determines whether put writers begin delta-hedging (if breached) or actively provide support (if defended). A sustained break below 71,900 with a 15-min close below it converts every put writer from a range-player to an active seller of futures (delta-hedge for short puts going deeper ITM), creating a self-reinforcing bear cascade that explains why the 71,900 OI support breach is treated as the definitive bear trigger for SENSEX on 02 Oct. |
⚡ Key Trigger: The key trigger for SENSEX's lower-open is: **OI-S 71,900 — if the first 15-minute candle closes below 71,900**, put-writer delta-hedging accelerates and the bear path toward L3 71,557.69 and PDL 71,292.88 is confirmed with the Narrow CPR's 15-min rule adding urgency. The bull reclaim trigger is a **15-minute close above OI-S 71,900 followed by a close above BC 71,917.43** — this two-step recovery (first reclaim OI support, then reclaim CPR lower boundary) is the minimum required to neutralize the gap-down bear setup, with TC 71,932.89 as the ultimate bull confirmation requiring a separate 15-min candle close above it.
◆ Near Flat Open — Open ≈ Prev Close (±0.05%)
◆ Neutral
Open lands: A ±0.05% flat open places SENSEX between approximately 71,874 and 71,946 — a range of 72 points that spans across OI-S 71,900, BC 71,917.43, P 71,925.16, and TC 71,932.89. The entire Descending Narrow CPR band (71,917.43–71,932.89, width 15.46 points) and OI-S 71,900 are all contained within the ±0.05% opening range, creating the most compressed opening scenario possible: SENSEX opens in a 72-point zone that contains both OI support (71,900) and OI resistance (72,000 is 90 points above), the entire CPR band, and both pivot P and both CPR boundaries.
CPR role: Maximum compression zone — the combination of Descending Narrow CPR (15.46 points wide), OI-S at 71,900 (inside the opening range), and OI-R at 72,000 (90 points above) creates the most confined trading environment for SENSEX in this analysis. The CPR band itself acts as a micro decision zone within a broader OI corridor (71,900–72,000), and the first 15-minute candle will define which boundary is breached first — making this scenario uniquely important for options scalpers who can monetize the OI corridor's tight range with iron condors or calendar spreads on 02 Oct.
Near Flat (±0.05%)
A flat open near 71,910–71,946 in SENSEX places price simultaneously within the ±0.05% opening range, at/near OI-S 71,900, inside BC 71,917.43, and below TC 71,932.89 — a multi-layered confluence that creates the tightest decision zone of the three indices and makes the first 15-minute candle direction exceptionally high-value. The Descending Narrow CPR (width 0.02%, just 15.46 points) in a Trending market structure is a textbook trending-day setup: with only 15.46 points between BC 71,917.43 and TC 71,932.89, the first 15-min candle will almost certainly close outside the CPR band, and the Trending market structure means the exit direction will likely define the entire session's trajectory. The OI corridor (PE support 71,900 to CE resistance 72,000, only 100 points wide) adds another critical dimension: SENSEX is sandwiched between competing OI walls in a way that NIFTY and BANKNIFTY are not, meaning the flat-open session becomes primarily a question of which OI wall breaks first — a 15-min close above OI-R 72,000 unleashes a momentum move toward H3 72,261.71, while a 15-min close below OI-S 71,900 triggers the put-writer cascade toward L3 71,557.69. Both triggers must be pre-defined with absolute precision: **Bull trigger — first 15-min close above TC 71,932.89 AND OI-R 72,000** (requires only 90-point move, very achievable in SENSEX); **Bear trigger — first 15-min close below OI-S 71,900 and BC 71,917.43** (only 10 points below a flat open near 71,910, making the bear trigger the path-of-least-resistance in this Descending CPR configuration).
|
▲ Upside Path → OI-R The confirmed bull path from a flat open: **TC 71,932.89 (CPR upper boundary, micro confirmation) → OI-R 72,000 (first major confirmation; 15-min close above this is the bull trigger) → H3 72,261.71 (first partial, Narrow CPR rule: take partial at first Traditional target which is R1 72,557.44 — but H3 72,261.71 is closer, take initial partial here) → PDH 72,572.90 / R1 72,557.44 (cluster; primary profit level) → H4 72,613.71 (breakout trigger) → H5 73,024.85 → H6 73,200.79 / R2 73,205.18 (cluster) → monthly max pain 74,000 → OI-R** (the monthly OI resistance at 72,000 weekly is already broken — the structural ceiling for the recovery move is monthly context at 74,000). Volume confirmation above the average on the OI-R 72,000 breach is essential to distinguish a genuine breakout from a temporary squeeze. |
▼ Downside Path → OI-S The confirmed bear path from a flat open: **OI-S 71,900 breached (first 15-min close below triggers bear) → BC 71,917.43 already breached → L3 71,557.69 (first partial, cover 40% of shorts) → PDL 71,292.88 / S1 71,277.42 (cluster; second major partial, cover 30%) → L4 71,205.69 (breakdown below here triggers accelerating move) → L5 70,794.55 / S2 70,645.14 (cluster; final intraday partial) → L6 70,618.61 → S3 69,997.40 → monthly straddle floor ~69,626**. The 10-point gap between a flat open (~71,910) and OI-S 71,900 means the bear trigger is extremely sensitive — SENSEX can breach 71,900 within the first minute of trading on even modest selling, so bear traders must be positioned before open or react in real-time to the OI-S breach rather than waiting for a clean 15-min candle close. |
| 🔴 OI-R: In a flat-open scenario, the OI resistance at **72,000** is extraordinarily relevant — only 90 points above a flat open of ~71,910, it is within the first 15-minute candle's natural range for SENSEX and functions as the bull trigger level rather than a distant ceiling. CE writers at 72,000 who are short gamma will delta-sell into any approach from below, but if buyers absorb this selling and close the first 15-min candle above 72,000, it signals that the entire CE writing wall has been overwhelmed and momentum traders will pile in toward H3 72,261.71 — making the 72,000 OI breach a binary high-conviction momentum signal unique to SENSEX among today's three indices. | 🟢 OI-S: In a flat-open scenario, the OI support at **71,900** is just as extraordinarily relevant — only 10 points below a flat open near 71,910, it could be breached within the first 30 seconds of trading on a slightly weak open. PUT writers at 71,900 who are short gamma will become aggressive delta-sellers (selling futures) as their short put goes ITM on any breach below 71,900, creating an instant acceleration of the downside move and explaining why the OI-S breach is treated as the primary bear trigger rather than BC 71,917.43 for the flat-open scenario. The reflexive PUT writer covering if price drops toward L3 71,557.69 provides the only meaningful intraday floor for bounce trades, making L3 the critical partial-profit level for short positions initiated on the OI-S 71,900 breach. |
⚡ Key Trigger: The exact dual trigger for SENSEX's flat open: **Bull — first 15-min candle close above OI-R 72,000** (stop below BC 71,917.43; note OI-R 72,000 is only 90 points above a flat open, making this highly achievable intraday; target H3 72,261.71 → PDH 72,572.90); **Bear — first 15-min candle close below OI-S 71,900** (stop above TC 71,932.89; only 10 points below a ~71,910 flat open, making this the path of least resistance in a Descending Narrow CPR; target L3 71,557.69 → PDL 71,292.88). The structural fulcrum is the OI corridor itself (71,900–72,000): SENSEX trading within this 100-point band in the first 15 minutes is consolidation; the first directional break outside this band is the trade, with the Descending CPR adding a bearish lean (OI-S breach is slightly more probable than OI-R breach from a flat open below the CPR band).
📊 VIX Insight: India VIX data is unavailable for this session, which creates meaningful uncertainty in premium calibration for 02 Oct — without VIX, traders cannot confirm whether the 0.88% NIFTY decline was accompanied by rising implied volatility (institutional hedging / panic) or falling IV (complacent selling). As a proxy framework: with SENSEX's weekly straddle at just 9.70 points (essentially expired) and NIFTY's weekly straddle at 260.55 points implying a modest ±1.16% expected move, the options market does not appear to be pricing in an extreme event for 02 Oct — suggesting IV is contained and the expected intraday range for NIFTY is approximately 22,140–22,660 from ATM 22,400. Traders should use wider stops than typical on 02 Oct to account for the VIX blind spot and avoid over-leveraging in the absence of a reliable volatility anchor.
Overall View:
All three indices — NIFTY (22,421.95), BANKNIFTY (54,450.75), and SENSEX (71,909.70) — enter 02 Oct with Descending CPR structures, with NIFTY and SENSEX sporting the most extreme Narrow CPRs (0.02% width) that statistically predict high-probability trending days, while BANKNIFTY's Medium CPR (0.16%) sets up a more contested, retest-heavy session. The most critical observation for 02 Oct is SENSEX's OI sandwich — with PE support at 71,900 and CE resistance at 72,000 only 100 points apart around a close of 71,909.70, SENSEX's first 15-minute direction will be binary and explosive regardless of gap direction. NIFTY's descending CPR overhead (TC 22,419.29 / BC 22,413.95) combined with the 22,000 OI support floor and the weekly straddle of 260.55 points defines the session's risk corridor — bears maintain structural control unless NIFTY reclaims TC 22,419.29 with volume in the first 15 minutes, while BANKNIFTY's 1,549-point gap to monthly max pain (56,000) provides the most compelling multi-day recovery thesis for swing traders once the intraday trending direction is confirmed.
All three indices — NIFTY (22,421.95), BANKNIFTY (54,450.75), and SENSEX (71,909.70) — enter 02 Oct with Descending CPR structures, with NIFTY and SENSEX sporting the most extreme Narrow CPRs (0.02% width) that statistically predict high-probability trending days, while BANKNIFTY's Medium CPR (0.16%) sets up a more contested, retest-heavy session. The most critical observation for 02 Oct is SENSEX's OI sandwich — with PE support at 71,900 and CE resistance at 72,000 only 100 points apart around a close of 71,909.70, SENSEX's first 15-minute direction will be binary and explosive regardless of gap direction. NIFTY's descending CPR overhead (TC 22,419.29 / BC 22,413.95) combined with the 22,000 OI support floor and the weekly straddle of 260.55 points defines the session's risk corridor — bears maintain structural control unless NIFTY reclaims TC 22,419.29 with volume in the first 15 minutes, while BANKNIFTY's 1,549-point gap to monthly max pain (56,000) provides the most compelling multi-day recovery thesis for swing traders once the intraday trending direction is confirmed.
Disclaimer: KRV Prime provides educational and informational content relating to financial markets. Articles, research, examples, charts, strategies and tools are provided for educational purposes and should not be interpreted as personalised investment advice or a guarantee of financial performance. Markets involve risk, including possible loss of capital. Past performance does not guarantee future results. KRV Prime is not a SEBI Registered Investment Adviser or Research Analyst.