
Index Analysis
Intraday Analysis for 08 Sep 2026
KRV Prime14 September 202652 min
Educational/Derived AnalysisSource: KRV Prime Market Insights (End-of-Day)As of 14 Sep 2026, 05:12 PM IST
Intraday Analysis for 08 Sep 2026
Markets closed on a soft note on 07 Sep 2026, with NIFTY shedding 0.50% to 23,779.15, BANKNIFTY declining 0.49% to 57,088.30, and SENSEX falling 0.50% to 76,132.81, reflecting broad-based selling pressure across large-caps. India VIX data was unavailable for today's session, making it critical to rely on CPR structure, OI walls, and straddle pricing to gauge the market's expected volatility envelope — the NIFTY weekly straddle at 127.75 points implies a tight ±0.27% intraday range, suggesting an expiry-week compression dynamic. All three indices have printed Descending CPRs for 08 Sep 2026, meaning the CPR band sits below yesterday's price — a structurally bearish alignment that puts the burden of proof firmly on the bulls for tomorrow's session.
Key Market Signals — Intraday Setup
All three indices — NIFTY, BANKNIFTY, and SENSEX — are trading below their respective weekly CPR bands (NIFTY Weekly P=23,942.55; BANKNIFTY Weekly P=57,405.93; SENSEX Weekly P=76,627.67), confirming a multi-session bearish tilt heading into 08 Sep 2026. With Descending Narrow/Medium CPRs across the board, tomorrow is structurally positioned for a trending day — direction determined by the first 15–30 minute candle relative to each index's CPR band.
Deep Technical Analysis & Levels
NIFTY
Descending — Narrow (Width 0.10%)
▼ Bearish
Market Structure Trending (up or down trend) | Straddle ATM 23800 weekly straddle = Call 56.6 + Put 71.15 = **127.75 pts**; this implies an expected intraday move of approximately ±127.75 pts from ATM, giving a range of roughly 23,672 on the downside and 23,928 on the upside — traders should size positions knowing that moves beyond this range carry elevated gamma risk. | Max Pain Weekly Max Pain = **23,800**; price closed at 23,779.15 — just 20.85 pts below max pain, meaning option sellers' sweet spot is a gravitational pull back toward 23,800, which coincides almost exactly with the CPR Pivot at 23,802.35 and creates a powerful magnetic zone for expiry-week pinning action. |
Tomorrow's Complete Level Map
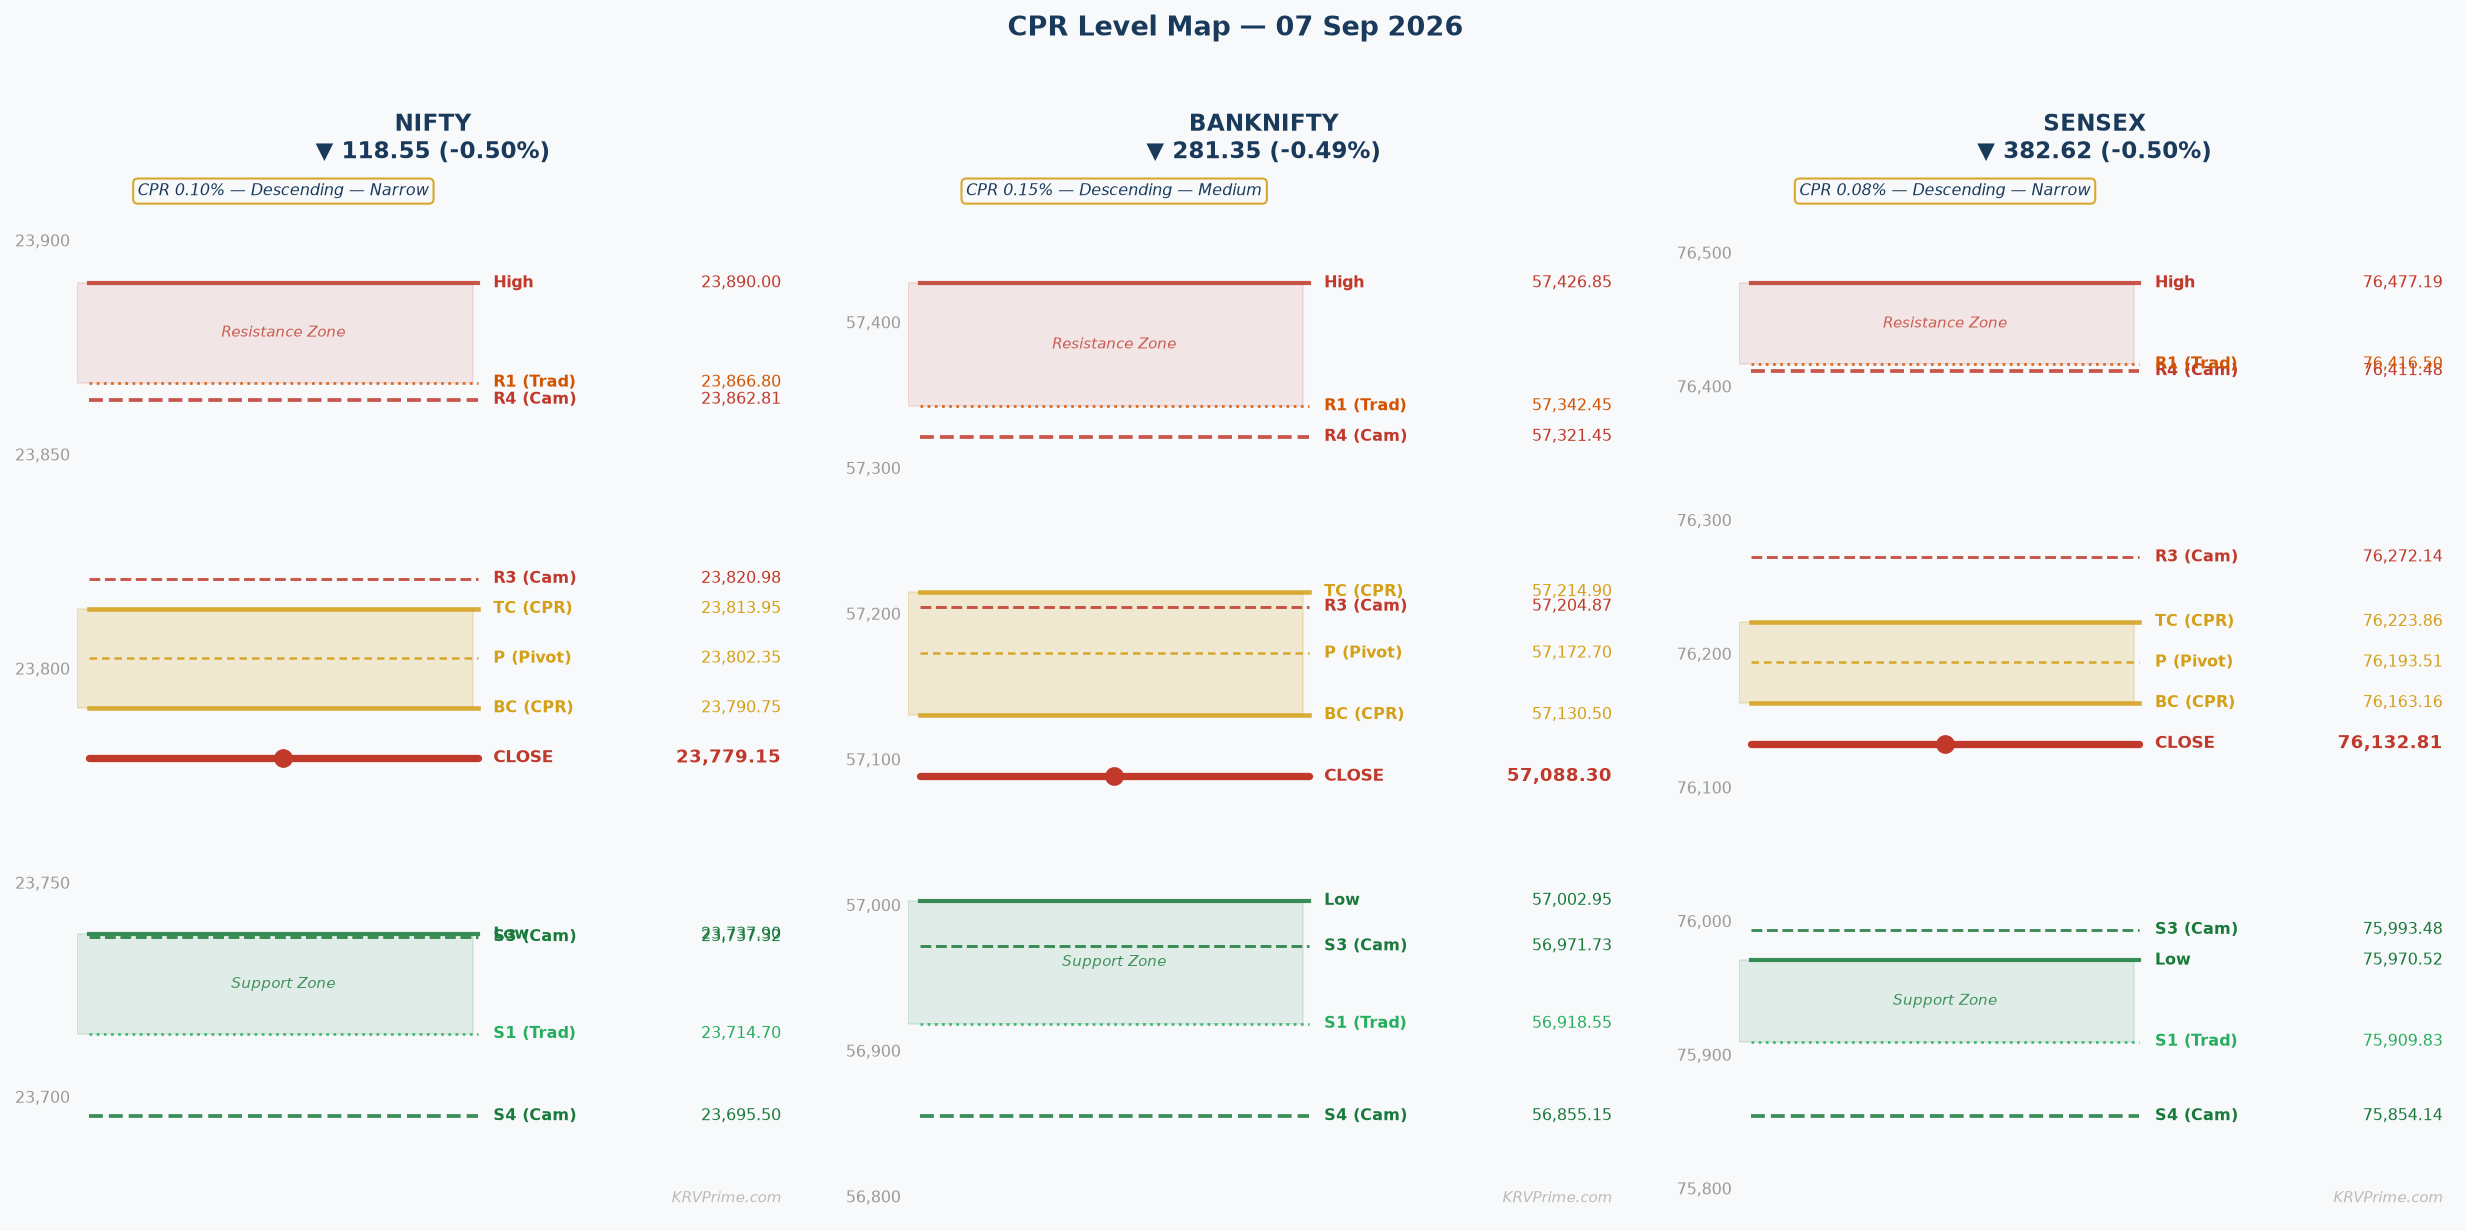
OI-R: 24,000 R3: 24,018.90 H6: 23,931.51 H5: 23,911.67 R2: 23,954.45 H4 ▶: 23,862.81 R1: 23,866.80 PDH: 23,890 H3 ↩: 23,820.98
TC: 23,813.95 P: 23,802.35 BC: 23,790.75
L3 ↩: 23,737.32 PDL: 23,737.90 S1: 23,714.70 L4 ▶: 23,695.50 S2: 23,650.25 L5: 23,646.65 L6: 23,626.79 S3: 23,562.60 OI-S: 23,500
↩ = Camarilla reversal point | ▶ = Camarilla breakout/breakdown trigger | OI-R/OI-S = Options wall (CE/PE max OI)
▲ Higher Open (Gap Up) — Open > Prev Close
▲ Bullish
Open lands: For a Descending CPR, a gap-up open places price above TC (23,813.95) — the entire CPR band lies below the opening price, meaning the CPR zone transforms from a potential ceiling into a trailing support base if bulls can sustain the gap.
CPR role: Launch pad / trailing support — the CPR band (BC 23,790.75 to TC 23,813.95) becomes a support base from below once price opens above TC; any intraday pullback to TC tests the bulls' conviction and represents a buy-the-dip opportunity if held.
Minor Gap (0.05–0.25%) — Structure Dominant
A minor gap-up of 0.05–0.25% opens NIFTY in the range of approximately 23,791 to 23,838, placing price just above TC at 23,813.95 or marginally above it — the Descending CPR structure adds a bearish lean even to a gap-up, so the gap receives only partial bullish credit. The first task for bulls is to sustain above H3 at 23,820.98 within the opening 15 minutes, as this Camarilla level acts as the mean-reversion stall zone; a failure to hold H3 risks a quick pullback into the CPR band, where BC at 23,790.75 becomes the critical floor. If the 15-min candle closes above H3 (23,820.98) on above-average volume, the first target is R1 at 23,866.80, followed by H4 at 23,862.81, with the OI-R wall at 24,000 as the session ceiling — partial profits should be booked at R1 given this is an expiry week with straddle pricing at only 127.75 pts.
Significant Gap (0.25–0.5%) — Balanced
A significant gap-up of 0.25–0.50% opens NIFTY near 23,838 to 23,898, placing price squarely between H3 (23,820.98) and PDH (23,890) — this is a zone of immediate horizontal resistance from yesterday's high. The gap-fill risk is moderate because the CPR Descending structure implies that the prior session's selling momentum has not fully resolved, and price opening near PDH (23,890) will face delta-hedging supply as call writers defend the H4–R1 cluster between 23,862.81 and 23,866.80. If price cannot sustain above PDH (23,890) within the first 30 minutes, expect a gap-fill attempt toward TC (23,813.95) and then BC (23,790.75); only a decisive 30-min candle close above R1 (23,866.80) unlocks the move toward H5 (23,911.67) and the OI-R wall at 24,000.
Large Gap (>0.5%) — Gap Direction Dominant
A large gap-up exceeding 0.50% opens NIFTY above 23,898, putting price at or above PDH (23,890) and approaching H5 (23,911.67) — at this point the gap dominates the CPR structure and the market is pricing in fresh positive news or strong global tailwinds. The probability of a full gap-fill diminishes in large gaps, but given the expiry-week straddle of only 127.75 pts and the OI-R wall at 24,000 just overhead, the risk-reward for aggressive long-chasing is poor and a fade from 24,000 CE OI wall is the institutional playbook. The specific abort level is a 30-min close below PDH (23,890); if that holds, target H5 (23,911.67) and H6 (23,931.51) as intraday highs, but do not expect a clean breakout above OI-R (24,000) without a corresponding surge in India VIX and heavy put buying to support the rally.
|
▲ Upside Path → OI-R From a confirmed hold above H3 (23,820.98), the upside path runs: **H3 (23,820.98) → H4 (23,862.81) → R1 (23,866.80) → H5 (23,911.67) → OI-R (24,000)**; each of these is a natural stall zone where partial profit-taking is warranted, especially at R1 (23,866.80) which is the first Traditional target and the Narrow CPR confirmation exit per the width rule. Volume must expand at each breakout level — thin volume at H4/R1 cluster suggests distribution rather than genuine momentum, and traders should trail stops to H3 (23,820.98) once R1 (23,866.80) is tagged. |
▼ Downside Path → OI-S If the gap-up fails to sustain above TC (23,813.95) within the first 15 minutes, price pulls back into the CPR band; the failure path runs **TC (23,813.95) → P (23,802.35) → BC (23,790.75) → L3 (23,737.32) → OI-S (23,500)**. Loss of TC on a gap-up day converts the entire session's directional structure from bullish to bearish — the Descending CPR's inherent bias re-asserts itself, and the first meaningful support becomes L3 at 23,737.32, which is nearly coincident with PDL at 23,737.90, creating a double-tested floor that if broken activates S1 (23,714.70) and L4 (23,695.50) as the next bear targets. |
| 🔴 OI-R: **OI-R at 24,000** is the primary CE writing wall for the weekly expiry — this strike has the highest call open interest, meaning systematic call sellers have established a ceiling that requires extraordinary buying pressure to breach, and any approach toward 24,000 will trigger incremental delta-hedging selling by market makers. In a gap-up scenario, 24,000 is the absolute session ceiling and a fade-trade magnet: if NIFTY rallies toward this level intraday, the optimal strategy is to either book longs or initiate range-bound positions (sell 24,000 CE, buy 24,100 CE spreads) rather than chasing breakout longs above the OI wall. | 🟢 OI-S: **OI-S at 23,500** is the primary PE base for the weekly expiry and is largely irrelevant in a genuine gap-up scenario as it sits approximately 279 pts below the close — however, it defines the absolute downside abort level for any long position opened on the gap-up. If intraday selling is so severe that NIFTY approaches 23,500, it signals a catastrophic failure of the gap and mass panic unwinding, making 23,500 the structural floor below which straddle monetisation strategies become viable for options traders. |
⚡ Key Trigger: The primary trigger for the gap-up scenario is a **first 15-min candle close above H3 (23,820.98)** on above-average volume — this confirms that the gap is not a fade and that bulls have absorbed the Camarilla mean-reversion zone. Failure to close above H3 within the first 15 minutes and a slide back below TC (23,813.95) signals a bull trap; the market would then revert to the CPR band's gravitational pull toward Pivot (23,802.35) and potentially toward BC (23,790.75), flipping the session's bias to neutral-to-bearish.
▼ Lower Open (Gap Down) — Open < Prev Close
▼ Bearish
Open lands: For a Descending CPR, a gap-down open places price inside the CPR band or below BC (23,790.75) — given the Descending structure, the CPR band sits below yesterday's close, so even a minor gap-down pierces BC and moves price into bearish territory relative to tomorrow's pivots.
CPR role: Overhead resistance — the entire CPR band (BC 23,790.75 to TC 23,813.95) acts as a ceiling on any recovery attempt; price opening below BC has to fight upward through a resistance zone before it can be considered constructive.
Minor Gap (0.05–0.25%) — Structure Dominant
A minor gap-down of 0.05–0.25% opens NIFTY in the range of approximately 23,720 to 23,767, placing price between L3 (23,737.32) and BC (23,790.75) — the Descending CPR structure reinforces this gap, as the entire CPR band now sits as overhead resistance and there is no structural support from today's pivot architecture between the open and L3. The gap-fill probability for minor gaps is moderate-to-high in the first 30–60 minutes, but any recovery rally must clear BC (23,790.75) and then TC (23,813.95) before the day's bias flips — per the Narrow CPR confirmation rule, a 15-min candle close back above BC (23,790.75) is required to confirm gap-fill intent. If BC cannot be reclaimed within 15 minutes, the bear case targets L3 (23,737.32), then PDL (23,737.90) as a double-test, and finally S1 (23,714.70) — note that L3 at 23,737.32 and PDL at 23,737.90 create a very narrow support cluster that if broken accelerates selling toward L4 (23,695.50).
Significant Gap (0.25–0.5%) — Balanced
A significant gap-down of 0.25–0.50% opens NIFTY in the range of approximately 23,661 to 23,720, placing price below L3 (23,737.32) and inside the S1 (23,714.70)–L4 (23,695.50) support zone — this is a more aggressive bear signal, as the CPR Descending structure and the gap together confirm directional pressure. The 30-min close confirmation rule applies: if NIFTY cannot reclaim L3 (23,737.32) within 30 minutes, the bear thesis is validated and targets extend to S1 (23,714.70), L4 (23,695.50), and then S2 (23,650.25), where put writers are likely to defend; OI-S at 23,500 becomes the session's bear extreme. Recovery above L3 (23,737.32) within 30 minutes initiates a potential reversal toward BC (23,790.75), which is now the critical bull reclaim level — failure to breach BC converts any recovery into a dead-cat bounce and puts sellers in control for the remainder of the session.
Large Gap (>0.5%) — Gap Direction Dominant
A large gap-down exceeding 0.50% opens NIFTY below approximately 23,661, breaching L4 (23,695.50) and L5 (23,646.65) — this is a structural breakdown that activates panic dynamics, with retail stop-losses below PDL (23,737.90) and L3 (23,737.32) already triggered. Given the weekly straddle at only 127.75 pts, a large gap-down alone exhausts the expected range, making straddle monetisation attractive — put buyers should consider booking into the opening spike rather than holding for further downside. Recovery levels are L3 (23,737.32) for immediate stabilisation and BC (23,790.75) for any meaningful recovery; the bull abort level in this scenario is a 30-min close below L5 (23,646.65), which opens the path toward L6 (23,626.79) and ultimately OI-S at 23,500 as the structural weekly PE base.
|
▲ Upside Path → OI-R The recovery path from a gap-down runs: **BC (23,790.75) → P (23,802.35) → TC (23,813.95) → H3 (23,820.98) → OI-R (24,000)**; each level must show a 15-min candle close above it to confirm genuine recovery momentum rather than a short-covering spike that fades at the first resistance. Volume expansion through TC (23,813.95) and a subsequent hold above H3 (23,820.98) would be the signal that institutional buying has entered — without volume, the recovery is treated as a fade opportunity and traders should look to re-enter shorts at TC (23,813.95). |
▼ Downside Path → OI-S The bear path from continued gap-down weakness runs: **L3 (23,737.32) → L4 (23,695.50) → S2 (23,650.25) → L5 (23,646.65) → OI-S (23,500)**; the L3–PDL cluster at 23,737.32/23,737.90 is the first acceleration zone — a clean break here triggers retail stop-losses and the move toward L4 (23,695.50) can happen rapidly. OI-S at 23,500 is the ultimate weekly put base and a major structural support; if reached intraday, expect aggressive put writing (short selling of puts) that creates strong short-covering and a bounce — the risk-reward for fresh shorts deteriorates significantly below 23,600. |
| 🔴 OI-R: **OI-R at 24,000** in a gap-down scenario is deeply irrelevant as a session target but remains critical as a psychological ceiling — it represents the maximum upside that call sellers are willing to allow by expiry, and its distance from the gap-down open (potentially 300–400 pts above) reinforces the structural bearishness. For traders watching gamma mechanics, the 24,000 CE wall means that any institutional hedger long NIFTY above 24,000 is not active at today's levels — there is no protective buying flow from that level to support NIFTY in a gap-down. | 🟢 OI-S: **OI-S at 23,500** is the primary put monetisation zone and the definitive structural floor for the weekly expiry — in a gap-down scenario, reaching 23,500 intraday would represent the maximum pain area for put buyers, triggering aggressive put writing that historically creates strong intraday reversals. Traders should treat 23,500 not as a short target but as a zone to book put profits and consider long scalps with tight stops, as the PE open interest at this strike creates a natural demand cushion that has historically absorbed selling pressure in expiry weeks. |
⚡ Key Trigger: **Failure to reclaim BC (23,790.75) within 30 minutes of the open** is the definitive bear confirmation for the gap-down scenario — this means the CPR band has fully transformed into overhead resistance and the Descending CPR structure is playing out as designed. Conversely, a **15-min candle close back above BC (23,790.75)** on above-average volume is the bull trigger that initiates a gap-fill rally toward P (23,802.35) and TC (23,813.95); only a close above TC (23,813.95) confirms that bulls have fully neutralised the gap and the session's bias has flipped to constructive.
◆ Near Flat Open — Open ≈ Prev Close (±0.05%)
◆ Neutral
Open lands: A ±0.05% flat open on NIFTY from 23,779.15 places the opening price in the range of 23,767 to 23,791, which is at or just below BC (23,790.75) — per the Descending CPR rule, a flat open lands near TC (23,813.95), but since NIFTY's close is already below the entire CPR band (close at 23,779.15 vs BC at 23,790.75), the flat open actually confirms the 'Descending Trend Reversal' sub-pattern where price is above TC but the flat open puts it just below BC.
CPR role: Decision zone / compression band — the CPR band (BC 23,790.75 to TC 23,813.95) is the fulcrum for the entire session; price opening just below BC in a Descending Narrow CPR environment means the first 15 minutes will definitively resolve direction, and the CPR band's 23-pt width is the battleground.
Near Flat (±0.05%)
A flat open near 23,779 places NIFTY just below BC (23,790.75), and this is an extremely high-information setup because the Descending Narrow CPR (width 0.10%) is the dominant structural signal — the first 15-min candle is the trade, and every subsequent move should be sized according to whether price is above or below BC. Per the Narrow CPR confirmation rule, a **15-min candle close above TC (23,813.95)** is the bull trigger; above TC, the CPR band converts from overhead resistance to a support base, and the session has a high probability of trending upward given the Narrow width, which historically produces strong directional days rather than range-bound chop. Conversely, a **15-min candle close below BC (23,790.75)** — particularly since price is already below BC on the open — confirms the Descending CPR's bearish bias and signals a trending bear day targeting L3 (23,737.32), S1 (23,714.70), and L4 (23,695.50) in sequence; the Narrow CPR width of 0.10% means there is very little ambiguity in the CPR structure — a break in either direction tends to be decisive and not easily reversed without significant volume. The max pain gravitational pull at 23,800 coincides with P (23,802.35), meaning that if NIFTY opens flat and fails to immediately resolve direction, option market-makers will create conditions to pin near 23,800 into weekly expiry — traders who are short straddles benefit from this pin, while directional players must wait for the first 15-min candle to resolve before committing to a position.
|
▲ Upside Path → OI-R From a confirmed 15-min close above TC (23,813.95), the upside path progresses: **TC (23,813.95) → H3 (23,820.98) → H4 (23,862.81) → R1 (23,866.80) → OI-R (24,000)**; partial profits should be taken at R1 (23,866.80) per the Narrow CPR width rule, and the trail stop moved to TC (23,813.95) once H3 (23,820.98) is cleared. The OI-R wall at 24,000 is the session ceiling — do not hold naked longs above 23,950 on expiry week without clear evidence of call unwinding at the 24,000 strike. |
▼ Downside Path → OI-S From a confirmed 15-min close below BC (23,790.75), the downside path progresses: **BC (23,790.75) → L3 (23,737.32) → S1 (23,714.70) → L4 (23,695.50) → OI-S (23,500)**; the L3 (23,737.32)–PDL (23,737.90) cluster is the first major bear target and also a potential bounce zone, so partial profits on shorts should be taken there and stops trailed to BC (23,790.75). If L3 breaks cleanly, L4 (23,695.50) and S2 (23,650.25) become the next targets with OI-S at 23,500 as the weekly put base that defines the maximum structural downside for the expiry cycle. |
| 🔴 OI-R: **OI-R at 24,000** in a flat-open scenario represents the CE writing ceiling established by institutional option sellers for the weekly expiry — it creates a definitive cap on upside, meaning that even if the flat open resolves bullishly through TC (23,813.95), the available upside toward OI-R is approximately 186 pts, which is comfortably within the straddle range of 127.75 pts on the conservative side but achievable on an aggressive trending day. The 24,000 CE wall means every rally toward that level will encounter incremental call-writer hedging (selling of NIFTY futures or buying of put spreads), creating natural resistance that traders should treat as a zone for booking longs and initiating range-trade positions. | 🟢 OI-S: **OI-S at 23,500** in a flat-open scenario is the primary PE base that option sellers are defending — it sits approximately 279 pts below the flat open, which is well outside the weekly straddle's 127.75-pt expected range, suggesting that a single-session move to 23,500 is a low-probability tail event. However, its existence confirms that put writers are comfortable with a floor near 23,500, providing structural support that makes 23,500 a genuine demand zone for contrarian buyers — traders who see NIFTY approaching 23,500 should treat it as a strong reversal signal and avoid fresh shorts at that level. |
⚡ Key Trigger: **First 15-min candle close above TC (23,813.95)** = confirmed bull trigger targeting H3 (23,820.98) and R1 (23,866.80); **first 15-min candle close below BC (23,790.75)** = confirmed bear trigger targeting L3 (23,737.32) and S1 (23,714.70). This CPR band is the structural fulcrum of the entire day — the Descending Narrow structure means that whichever side of the CPR price confirms on the first 15-min candle will attract institutional momentum orders, as algorithmic systems are widely programmed to trade Narrow CPR breakouts in trending market structures.
BANKNIFTY
Descending — Medium (Width 0.15%)
▼ Bearish
Market Structure Balanced or transitional | Straddle ATM 57100 monthly straddle = Call 787.0 + Put 534.4 = **1321.4 pts**; this implies an expected move of approximately ±1321.4 pts from ATM 57,100, giving a range of roughly 55,779 on the downside and 58,421 on the upside — the monthly straddle's wide range reflects elevated uncertainty over the entire September expiry cycle, and intraday traders should note that the daily expected move is a fraction of this, making disciplined partial-profit-taking essential. | Max Pain Monthly Max Pain = **57,500**; BANKNIFTY closed at 57,088.30, which is 411.70 pts below the max pain strike — the gravitational pull of 57,500 max pain acts as a medium-term magnet for the remainder of the September expiry cycle, and any intraday move toward 57,500 should be treated as max-pain-driven convergence rather than breakout momentum. |
Tomorrow's Complete Level Map
OI-R: 57,500 R3: 57,766.35 H6: 57,512.83 H5: 57,457.62 R2: 57,596.60 H4 ▶: 57,321.45 R1: 57,342.45 PDH: 57,426.85 H3 ↩: 57,204.87
TC: 57,214.90 P: 57,172.70 BC: 57,130.50
L3 ↩: 56,971.73 PDL: 57,002.95 S1: 56,918.55 L4 ▶: 56,855.15 S2: 56,748.80 L5: 56,718.98 L6: 56,663.77 S3: 56,494.65 OI-S: 57,000
↩ = Camarilla reversal point | ▶ = Camarilla breakout/breakdown trigger | OI-R/OI-S = Options wall (CE/PE max OI)
▲ Higher Open (Gap Up) — Open > Prev Close
▲ Bullish
Open lands: For a Descending CPR, a gap-up open places BANKNIFTY above TC (57,214.90) — the entire CPR band (BC 57,130.50 to TC 57,214.90) is left below the opening price, theoretically acting as a support base from below and shifting the intraday bias toward bulls if the gap can be sustained.
CPR role: Launch pad / trailing support — the CPR band (BC 57,130.50 to TC 57,214.90) acts as a base that supports the gap; however, the Descending structure introduces caution — the gap-up opens against the multi-session bearish trend, so the CPR band's support role is contingent on sustained volume confirmation above TC.
Minor Gap (0.05–0.25%) — Structure Dominant
A minor gap-up of 0.05–0.25% opens BANKNIFTY in the range of approximately 57,117 to 57,231, placing price just inside or just above the CPR band — specifically, a 0.10% gap opens near 57,145, which is inside the CPR band between BC (57,130.50) and TC (57,214.90), and a 0.20% gap opens near 57,202, very close to TC (57,214.90). The Medium CPR width confirmation rule requires a **30-min candle close** above TC (57,214.90) before directional longs are initiated — the CPR band's Descending structure adds a bearish overlay, meaning a minor gap-up that cannot sustain above TC within 30 minutes is likely to fade back toward BC (57,130.50) and then L3 (56,971.73). If the 30-min candle closes above TC (57,214.90) on above-average volume, the first targets are H3 (57,204.87) — which is actually below TC, so effectively the CPR cluster is the first resistance zone — then H4 (57,321.45) and R1 (57,342.45) as the first Traditional profit target, with retests of the CPR band expected along the way per the Medium width rule.
Significant Gap (0.25–0.5%) — Balanced
A significant gap-up of 0.25–0.50% opens BANKNIFTY in the range of approximately 57,231 to 57,374, placing price above TC (57,214.90) and approaching H4 (57,321.45) and R1 (57,342.45) — this is immediate resistance territory, and delta-hedging flow from call writers at the OI-R wall (57,500) will create selling pressure from above. The 30-min close rule is critical here: if BANKNIFTY cannot sustain above H4 (57,321.45) for a full 30-minute candle, the gap is likely a bull trap and the reversal toward TC (57,214.90), P (57,172.70), and eventually L3 (56,971.73) is the higher-probability path. A confirmed 30-min close above PDH (57,426.85) would be exceptionally bullish but requires breaching both H4 (57,321.45) and R1 (57,342.45) first — in this case, H5 (57,457.62) and OI-R (57,500) become the extreme targets, though the monthly max pain at 57,500 creates a magnetic ceiling that caps the rally.
Large Gap (>0.5%) — Gap Direction Dominant
A large gap-up exceeding 0.50% opens BANKNIFTY above approximately 57,374 and potentially near PDH (57,426.85) or H5 (57,457.62), putting price in direct proximity to the critical OI-R wall at 57,500 — this is the most dangerous scenario for fresh long entries as the entire upside is compressed into less than 126 pts between the open and the OI-R ceiling. Call writers at 57,500 will defend aggressively, and the market-maker delta-hedging dynamics near H6 (57,512.83) and OI-R (57,500) will create strong selling pressure; the risk-reward for directional longs in this scenario is extremely poor. The primary strategy is to watch for a gap-fill attempt toward TC (57,214.90) and the CPR band — if the gap fails within 30 minutes (price falls back below H4 at 57,321.45), the gap-fill trade targets P (57,172.70), BC (57,130.50), and then L3 (56,971.73), while the abort level for any long position is a 30-min close below BC (57,130.50).
|
▲ Upside Path → OI-R From a confirmed 30-min close above TC (57,214.90), the upside path progresses: **TC (57,214.90) → H4 (57,321.45) → R1 (57,342.45) → H5 (57,457.62) → OI-R (57,500)**; the first partial profit should be taken at R1 (57,342.45) per the Medium CPR rule, with the second partial at H5 (57,457.62) and the exit at OI-R (57,500). Note that H3 (57,204.87) is actually below TC (57,214.90) in this data, making TC/H3 effectively the same zone — the real breakout confirmation comes with a hold above H4 (57,321.45), which is the Camarilla breakout trigger level. |
▼ Downside Path → OI-S If the gap-up fails to sustain above TC (57,214.90) within 30 minutes, the failure path descends: **TC (57,214.90) → P (57,172.70) → BC (57,130.50) → L3 (56,971.73) → OI-S (57,000)**; note the interesting inversion where OI-S (57,000) is actually above L3 (56,971.73), meaning L3 penetration would breach the weekly PE support wall — a close below 57,000 intraday would trigger significant put unwinding and accelerated selling toward L4 (56,855.15). The Balanced/Transitional market structure means that gap-up failures in BANKNIFTY can be sharp and fast — traders should have stop-losses pre-set at TC (57,214.90) and not wait for manual exit decisions. |
| 🔴 OI-R: **OI-R at 57,500** is the monthly CE writing wall and the monthly max pain strike simultaneously — this double coincidence makes 57,500 an extremely powerful ceiling for the September expiry cycle. In a gap-up scenario where BANKNIFTY approaches 57,500, institutional call writers will sell aggressively to defend this level, creating a dynamic ceiling where every 100-point rally above 57,400 is met with incremental supply; traders should use 57,500 as a hard exit for long positions and a zone to initiate short-dated CE credit spreads. | 🟢 OI-S: **OI-S at 57,000** is the monthly PE support wall and coincides closely with PDL (57,002.95) — in a gap-up scenario this level is largely irrelevant as the open is well above it, but it defines the maximum downside risk for any long position initiated on the gap-up. A gap-up that subsequently falls to 57,000 intraday would signal a catastrophic bull failure and trigger defensive put buying, making OI-S at 57,000 the absolute stop-loss reference for swing longs entered on the gap-up open. |
⚡ Key Trigger: The primary trigger for the gap-up scenario is a **30-min candle close above TC (57,214.90)** on above-average volume, confirming that the Descending CPR's resistance is overcome and bulls have seized intraday control — per the Medium CPR width rule, a single 15-min candle is insufficient and the 30-min confirmation is mandatory before committing to directional longs. Failure to close above TC (57,214.90) within the first 30 minutes and a subsequent drop below P (57,172.70) signals that the gap-up was a pre-market overreaction and the session's directional bias remains bearish per the Descending CPR structure, with the trade reversing to target L3 (56,971.73) and OI-S (57,000).
▼ Lower Open (Gap Down) — Open < Prev Close
▼ Bearish
Open lands: For a Descending CPR, a gap-down open places BANKNIFTY below BC (57,130.50) or even below the entire CPR band — given the close at 57,088.30, a gap-down opens well below BC (57,130.50), placing the entire CPR band as overhead resistance and confirming the Descending CPR's bearish bias.
CPR role: Overhead resistance / battleground — the CPR band (BC 57,130.50 to TC 57,214.90) becomes a strong overhead resistance ceiling; any recovery attempt must first clear BC (57,130.50) and then TC (57,214.90) before the session can be considered constructive, and each of these levels will attract supply from CPR-aware sellers.
Minor Gap (0.05–0.25%) — Structure Dominant
A minor gap-down of 0.05–0.25% opens BANKNIFTY in the range of approximately 56,945 to 57,059, placing price below BC (57,130.50) and dangerously close to OI-S (57,000) — the Descending CPR structure reinforces this gap, creating an immediate downside risk toward the critical PE support wall at 57,000 and then L3 (56,971.73). The 30-min close confirmation rule for Medium CPR applies: a **30-min candle close back above BC (57,130.50)** is required to indicate gap-fill intent and neutralise the Descending CPR's bearish bias — without this reclaim, the session is expected to trend lower. If BC cannot be reclaimed within 30 minutes, the bear targets are OI-S (57,000), L3 (56,971.73), and then L4 (56,855.15) — the coincidence of OI-S and L3 around 57,000 creates a powerful support cluster that may provide a bounce, but a clean breach below 56,971.73 significantly accelerates the downward move toward S1 (56,918.55) and L4 (56,855.15).
Significant Gap (0.25–0.5%) — Balanced
A significant gap-down of 0.25–0.50% opens BANKNIFTY in the range of approximately 56,802 to 56,945, placing price between L3 (56,971.73) and L4 (56,855.15) — this is a critical Camarilla breakdown zone where the CPR band is now 175–370 pts overhead as full overhead resistance. The Balanced/Transitional market structure means that a significant gap-down in BANKNIFTY could represent either a genuine breakdown or a temporary imbalance that corrects — the 30-min rule is decisive: if price recovers back above L3 (56,971.73) within 30 minutes, a gap-fill rally toward BC (57,130.50) becomes the primary trade. If L3 (56,971.73) cannot be reclaimed, the bear path targets L4 (56,855.15), S2 (56,748.80), and L5 (56,718.98) — put writers (short put position holders) who are long from the OI-S level at 57,000 will likely cover their positions aggressively below 56,971.73, adding momentum to the selloff.
Large Gap (>0.5%) — Gap Direction Dominant
A large gap-down exceeding 0.50% opens BANKNIFTY below approximately 56,802, potentially near L4 (56,855.15) or L5 (56,718.98) — this represents a structural breakdown that breaches the Camarilla mean-reversion zone (L3 at 56,971.73) at the open, immediately triggering systematic selling and retail stop-losses. The monthly straddle at 1321.4 pts implies that a 500-pt single-day move is within the expected range for the expiry cycle, so premium sellers will see their puts rise sharply in value — the optimal strategy is to let the panic exhaust itself before entering long scalps near L5 (56,718.98) or L6 (56,663.77) with a hard stop below L6. Recovery from a large gap-down requires two 30-min candle closes above L3 (56,971.73) — without this double confirmation, any bounce is treated as a dead-cat rally and the primary trend remains bearish toward S2 (56,748.80) and potentially S3 (56,494.65).
|
▲ Upside Path → OI-R Recovery from a gap-down follows the path: **BC (57,130.50) → P (57,172.70) → TC (57,214.90) → H4 (57,321.45) → OI-R (57,500)**; volume must expand at each recovery level — a thin-volume bounce that stalls at P (57,172.70) is a distribution signal, while a high-volume close above TC (57,214.90) confirms institutional buyers have stepped in. The Balanced/Transitional market structure suggests that a genuine recovery is possible if global or sectoral triggers support bank stocks — watch for banking-sector FII flow as a confirming signal alongside the price action above TC (57,214.90). |
▼ Downside Path → OI-S The bear path from continued gap-down weakness: **L3 (56,971.73) → OI-S (57,000 above L3, important note) → L4 (56,855.15) → S1 (56,918.55) → S2 (56,748.80) → L5 (56,718.98) → OI-S zone extreme**; the cluster around 56,971.73–57,000 (L3 and OI-S) is the most critical decision zone — if price opens below 57,000 and fails to reclaim it, the selling will likely be aggressive as put holders see their positions become profitable. L4 (56,855.15) is the next major level below and represents the Camarilla breakdown trigger — a confirmed 30-min close below L4 targets L5 (56,718.98) and L6 (56,663.77) as intraday extremes. |
| 🔴 OI-R: **OI-R at 57,500** in a gap-down scenario is the distant ceiling that defines the maximum upside for any recovery — with BANKNIFTY potentially opening 400–600 pts below 57,500 in a significant gap-down, reaching OI-R is effectively a session-long recovery scenario. The CE wall at 57,500 means institutional sellers are not providing protection at current levels; instead, they're profiting from the decline as their call premium erodes — this creates a paradoxical situation where the gap-down is actually beneficial for call writers who shorted at higher levels. | 🟢 OI-S: **OI-S at 57,000** is the most critical level in a gap-down scenario because it represents the monthly PE support wall established by put writers who are long the market from this strike — a breach of 57,000 triggers massive put buying pressure (as put sellers scramble to hedge) and accelerates selling toward L3 (56,971.73) and L4 (56,855.15). However, 57,000 is also a psychological level and a strong demand zone — if BANKNIFTY tests 57,000 and shows strong reversal candles (hammer, bullish engulf) on the 15-min chart, this is the highest-probability long scalp opportunity of the session with a stop below 56,971.73 (L3) and a target of BC (57,130.50). |
⚡ Key Trigger: **Failure to reclaim BC (57,130.50) within 30 minutes** is the definitive bear confirmation for the gap-down scenario in BANKNIFTY, with the CPR acting as a brick wall for any recovery attempt; per the Medium CPR rule, a retest of BC (57,130.50) from below that fails on the 30-min close is a classic sell-the-rally setup targeting L3 (56,971.73) and OI-S (57,000). The bull trigger requires a **30-min candle close above BC (57,130.50)**, which signals gap-fill intent and activates the CPR band as a recovery launch pad — above BC, the next resistance is P (57,172.70), then TC (57,214.90), and a confirmed close above TC (57,214.90) flips the session's entire directional structure from bearish to bullish.
◆ Near Flat Open — Open ≈ Prev Close (±0.05%)
◆ Neutral
Open lands: A ±0.05% flat open from 57,088.30 places BANKNIFTY in the range of 57,060 to 57,117, which is below BC (57,130.50) — per the Descending CPR rule, a flat open should land near TC (57,214.90), but since the close is already well below the CPR band, the flat open confirms that price is in 'two sessions below CPR' territory, reinforcing the bearish structural bias.
CPR role: Decision zone / compression band — the CPR band (BC 57,130.50 to TC 57,214.90) sits approximately 42–127 pts above the flat open, making it the key overhead resistance zone; the session's direction will be determined by whether BANKNIFTY can rally into and through the CPR band or continues to decline from below BC.
Near Flat (±0.05%)
A flat open near 57,088 places BANKNIFTY below BC (57,130.50) for the second consecutive session — in Descending CPR framework, this 'two sessions below CPR' pattern is a strong bearish structural signal, as it indicates that the CPR band is consistently acting as overhead resistance rather than a decision zone. The Medium CPR width (0.15%) means that the confirmation rule requires a **30-min candle close** for directional signals — a flat open that fails to reclaim BC (57,130.50) within the first 30 minutes immediately activates the bear trade targeting L3 (56,971.73), OI-S (57,000), and then L4 (56,855.15). For the bull case, BANKNIFTY must first close above BC (57,130.50) on the 30-min chart, then clear P (57,172.70), and finally sustain above TC (57,214.90) — only above TC does the session bias flip to bullish, and the retest of TC from above (expected per Medium CPR rule) would be the entry point for longs targeting H4 (57,321.45), R1 (57,342.45), and the monthly max pain zone at 57,500. The Balanced/Transitional market structure adds an important nuance: BANKNIFTY in this scenario is at a genuine inflection point, and the first 30-minute candle will be closely watched by institutional participants — if global bank indices or domestic banking sector news provides a catalyst, the direction could be sharp and sustained, while in the absence of a catalyst, range-bound action between 57,000 and 57,300 is the base case.
|
▲ Upside Path → OI-R From a confirmed 30-min close above BC (57,130.50), the upside path progresses: **BC (57,130.50) → P (57,172.70) → TC (57,214.90) → H4 (57,321.45) → R1 (57,342.45) → OI-R (57,500)**; the first partial profit per Medium CPR rule should be taken at R1 (57,342.45), with the second partial at H5 (57,457.62), and the final exit at OI-R (57,500) which coincides with monthly max pain and the CE wall — a combination that makes 57,500 a very hard ceiling to breach intraday. Volume confirmation at each level is critical — expanding volume through TC (57,214.90) signals institutional buying, while contracting volume at H4 (57,321.45) signals distribution. |
▼ Downside Path → OI-S From a 30-min candle that fails to reclaim BC (57,130.50) and instead closes below 57,000 (OI-S), the bear path runs: **OI-S (57,000) → L3 (56,971.73) → L4 (56,855.15) → S1 (56,918.55) → S2 (56,748.80) → L5 (56,718.98)**; the breach of OI-S at 57,000 is the most significant signal, as it represents the failure of the monthly PE writing support wall — once 57,000 is clearly breached on a 30-min close, expect accelerated selling as put writers scramble to hedge and new put buyers enter positions targeting L4 (56,855.15) and S2 (56,748.80). |
| 🔴 OI-R: **OI-R at 57,500** in a flat-open scenario doubles as the monthly max pain strike — this creates a powerful ceiling where institutional participants will actively sell calls and buy puts to protect their max-pain-aligned positions, meaning any rally toward 57,500 will face a systematic wall of supply. Traders entering long positions from BC (57,130.50) in the flat-open scenario should target 57,500 as the maximum exit point and not hold beyond it, as the CE writing pressure will intensify with each 100-point rally toward the max pain strike. | 🟢 OI-S: **OI-S at 57,000** in a flat-open scenario is the immediate downside trigger and structural floor — with BANKNIFTY opening just 88 pts above 57,000, this level is only one moderate sell wave away, making it the most critical intraday level for risk management. Put writers who are long from 57,000 will provide a support cushion at this level — they will buy futures or close short puts to defend their positions — creating a natural demand zone that traders can exploit for long scalps with a very tight stop (5-10 pts below 57,000) and a target of BC (57,130.50). |
⚡ Key Trigger: **30-min candle close above BC (57,130.50)** = bull trigger initiating a CPR recovery toward P (57,172.70) and TC (57,214.90); **30-min candle close below 57,000 (OI-S)** = bear confirmation activating L3 (56,971.73) as the next target and signaling aggressive put buying pressure. The CPR band's role as the structural fulcrum is magnified by the Balanced/Transitional market structure — BANKNIFTY is at a tipping point between resuming the downtrend and staging a recovery toward max pain at 57,500, and the 30-min candle will resolve this ambiguity decisively.
SENSEX
Descending — Narrow (Width 0.08%)
▼ Bearish
Market Structure Trending (up or down trend) | Straddle ATM 76100 weekly straddle = Call 410.0 + Put 283.1 = **693.1 pts**; this implies an expected intraday move of approximately ±693.1 pts from ATM 76,100, giving a range of roughly 75,407 on the downside and 76,793 on the upside — the call premium significantly exceeds put premium (410 vs 283.1), indicating that upside hedging is more expensive, yet the index has been declining, suggesting institutional positioning may be skewed toward recovery bets or the skew reflects index-level hedging demands. | Max Pain Weekly Max Pain = **76,300**; SENSEX closed at 76,132.81, which is 167.19 pts below the max pain strike — the max pain gravity will pull SENSEX toward 76,300 through the remainder of the weekly expiry (10 Sep 2026), and this level coincides approximately with R1 (76,416.50) territory, making the 76,300–76,416 zone a key option-seller-defended area for the week. |
Tomorrow's Complete Level Map
OI-R: 76,500 R3: 76,923.17 H6: 76,640.56 H5: 76,574.23 R2: 76,700.18 H4 ▶: 76,411.48 R1: 76,416.50 PDH: 76,477.19 H3 ↩: 76,272.14
TC: 76,223.86 P: 76,193.51 BC: 76,163.16
L3 ↩: 75,993.48 PDL: 75,970.52 S1: 75,909.83 L4 ▶: 75,854.14 S2: 75,686.84 L5: 75,691.39 L6: 75,625.06 S3: 75,403.16 OI-S: 76,000
↩ = Camarilla reversal point | ▶ = Camarilla breakout/breakdown trigger | OI-R/OI-S = Options wall (CE/PE max OI)
▲ Higher Open (Gap Up) — Open > Prev Close
▲ Bullish
Open lands: For a Descending CPR, a gap-up open places SENSEX above TC (76,223.86) — the entire CPR band (BC 76,163.16 to TC 76,223.86) lies below the opening price, transforming the CPR band into a potential trailing support base if bulls sustain the gap, while the Descending structure's inherent bearish lean introduces caution about gap sustainability.
CPR role: Launch pad / trailing support — the CPR band (BC 76,163.16 to TC 76,223.86) acts as a support base from below once price opens above TC; however, the Descending Narrow structure means the session is already skewed toward trending, and any pullback into the CPR band should be watched carefully for breakdown signals.
Minor Gap (0.05–0.25%) — Structure Dominant
A minor gap-up of 0.05–0.25% opens SENSEX in the range of approximately 76,171 to 76,323, placing price just above TC (76,223.86) or inside the CPR band if the gap is at the lower end of the range — the Descending CPR Narrow structure is the dominant signal, and per the Narrow CPR rule, a **15-min candle close above TC (76,223.86)** is the mandatory first trigger. The CPR Descending structure adds a bearish overlay even to a gap-up, meaning bulls must prove their case quickly — a 15-min candle that opens above TC (76,223.86) but closes below it is a classic bull trap signal in the Narrow CPR environment. If the 15-min candle closes above H3 (76,272.14) on above-average volume, the session bias firmly favors bulls and the targets are R1 (76,416.50), H4 (76,411.48), and OI-R (76,500) as the session ceiling, where partial profits should be taken per the Narrow CPR width rule.
Significant Gap (0.25–0.5%) — Balanced
A significant gap-up of 0.25–0.50% opens SENSEX in the range of approximately 76,323 to 76,513, placing price above H3 (76,272.14) and potentially near H4 (76,411.48), R1 (76,416.50), or PDH (76,477.19) — this is a zone of dense resistance where multiple Camarilla levels, Traditional pivots, and yesterday's high converge. Delta-hedging from call writers defending the OI-R wall at 76,500 will create immediate selling pressure for any gap-up that opens above 76,400 — the risk-reward for fresh longs at this level is poor without a clear 30-min hold above PDH (76,477.19). The confirmation strategy is to wait for a 15-min candle close above R1 (76,416.50) before initiating longs, with a target of OI-R (76,500); failure to hold R1 (76,416.50) on the first 15-min candle triggers a gap-fill trade targeting TC (76,223.86) and P (76,193.51).
Large Gap (>0.5%) — Gap Direction Dominant
A large gap-up exceeding 0.50% opens SENSEX above approximately 76,513, putting price above PDH (76,477.19) and at or near OI-R (76,500) — this is the most aggressive gap-up scenario and immediately tests the weekly CE writing wall. The straddle pricing at 693.1 pts with a call component of 410 pts suggests the market was anticipating upward risk, but opening directly at OI-R (76,500) eliminates the risk-reward for directional longs and makes a fade strategy (sell near 76,500, target 76,272–76,223) the institutional play. Recovery levels after any gap-up failure include H3 (76,272.14) and TC (76,223.86) as the first supports — a 15-min close below H3 (76,272.14) in a large gap-up that opened near 76,500 is the abort signal for longs, and the subsequent target becomes P (76,193.51) and BC (76,163.16).
|
▲ Upside Path → OI-R From a confirmed 15-min close above H3 (76,272.14), the upside path progresses: **H3 (76,272.14) → H4 (76,411.48) → R1 (76,416.50) → H5 (76,574.23) → OI-R (76,500)**; note that OI-R (76,500) sits between H4/R1 and H5, making 76,500 the primary session ceiling where partial profits must be taken. Per the Narrow CPR rule, the trail stop should be moved to H3 (76,272.14) once H4/R1 (76,411–76,416) is tagged — the Trending market structure confirms that a genuine breakout through the OI wall at 76,500 would be a very significant event requiring exceptional volume and macro support. |
▼ Downside Path → OI-S If the gap-up fails to sustain above TC (76,223.86) within the first 15 minutes, the failure path descends: **TC (76,223.86) → P (76,193.51) → BC (76,163.16) → L3 (75,993.48) → OI-S (76,000)**; note the intriguing proximity of L3 (75,993.48) and OI-S (76,000) — they form a tight 6.52-pt cluster that is the most important support zone of the day. A gap-up failure that reaches this 75,993–76,000 zone creates a potential bounce opportunity for scalpers, but a confirmed 15-min close below L3 (75,993.48) activates L4 (75,854.14) and S1 (75,909.83) as the next bear targets. |
| 🔴 OI-R: **OI-R at 76,500** is the weekly CE writing wall and the primary resistance ceiling — in a gap-up scenario where SENSEX opens near or above 76,400, the 76,500 level will experience aggressive call writing (supply) from institutional option sellers who have established positions at this strike. The weekly max pain at 76,300 adds a complementary dynamic: option sellers want SENSEX to expire near 76,300, not 76,500, meaning any intraday spike toward 76,500 is likely to be sold down by the same participants who profit from the 76,300 pin — making 76,500 the definitive fade-trade level for the week. | 🟢 OI-S: **OI-S at 76,000** in a gap-up scenario is the distant floor that defines downside risk for any long position — it sits approximately 133 pts below the close, and in a gap-up session, reaching 76,000 would represent a complete intraday reversal that wipes out the gap and more. The PE base at 76,000 from option writers means this level has structural demand — put writers long from 76,000 will defend it aggressively, creating a strong bounce zone that makes 76,000 an excellent stop-loss reference for any short position initiated near OI-R (76,500) on the gap-up. |
⚡ Key Trigger: The primary trigger for the gap-up scenario is a **first 15-min candle close above H3 (76,272.14)** on above-average volume — this level is strategically important because it is the Camarilla mean-reversion stall zone, and a close above it on strong volume signals that the gap-up is genuine and institutional buying has entered. Failure to sustain above TC (76,223.86) on the first 15-min candle — particularly if price opens above TC and then falls back below it — is the definitive bull trap signal per the Narrow CPR confirmation rule, and traders should immediately flip to the downside path targeting L3 (75,993.48) and OI-S (76,000).
▼ Lower Open (Gap Down) — Open < Prev Close
▼ Bearish
Open lands: For a Descending CPR, a gap-down open places SENSEX inside the CPR band or below BC (76,163.16) — given the close at 76,132.81, even a minor gap-down breaches BC (76,163.16) from the very open, and a significant gap-down approaches the OI-S wall at 76,000 and L3 (75,993.48).
CPR role: Overhead resistance — the CPR band (BC 76,163.16 to TC 76,223.86) acts as overhead resistance for any recovery attempt; the gap-down confirms the Descending CPR's bearish structure and the entire 60-pt CPR band width becomes a ceiling that bears will defend.
Minor Gap (0.05–0.25%) — Structure Dominant
A minor gap-down of 0.05–0.25% opens SENSEX in the range of approximately 75,942 to 76,094, placing price at or below BC (76,163.16) and dangerously close to OI-S (76,000) and L3 (75,993.48) — the Descending CPR Narrow structure reinforces this gap and the Trending market structure suggests this could be the beginning of a sustained downtrend if bears maintain control. The gap-fill probability is lower in a Descending Narrow CPR environment compared to a neutral CPR, but minor gaps do have a 30–60 minute recovery window — per the Narrow CPR rule, a **15-min candle close back above BC (76,163.16)** is the minimum requirement to signal gap-fill intent. If BC cannot be reclaimed within 15 minutes, the bear targets are L3 (75,993.48) and OI-S (76,000) — the near-identical values of L3 and OI-S create a 6.52-pt zone (75,993–76,000) that is the session's most critical support, and a 15-min close below L3 (75,993.48) activates S1 (75,909.83) and L4 (75,854.14) as the next downside levels.
Significant Gap (0.25–0.5%) — Balanced
A significant gap-down of 0.25–0.50% opens SENSEX in the range of approximately 75,752 to 75,942, placing price below OI-S (76,000) and L3 (75,993.48) — breaching both these critical levels at the open is a significant bearish signal that eliminates the defensive support from PE open interest at 76,000. In this scenario, the Trending market structure confirms that the downtrend has accelerated, and the 30-min confirmation rule would apply if we were using Medium width, but the Narrow width (0.08%) means the faster **15-min candle** is the decision candle — a 15-min close below L3 (75,993.48) confirms the continuation, while a 15-min close back above L3 (75,993.48) and then OI-S (76,000) initiates a strong recovery rally toward BC (76,163.16). The target in a confirmed bear scenario is L4 (75,854.14), S1 (75,909.83), and then S2 (75,686.84) — the straddle pricing with a weekly put premium of 283.1 pts suggests that a move to approximately 75,817 (76,100 minus 283.1) is already priced in, making S2 (75,686.84) the extreme target.
Large Gap (>0.5%) — Gap Direction Dominant
A large gap-down exceeding 0.50% opens SENSEX below approximately 75,752, breaching L3 (75,993.48), L4 (75,854.14), and potentially approaching L5 (75,691.39) — this represents a structural panic that goes beyond the weekly straddle range and suggests extraordinary negative news. At these levels, the Trending market structure's bearish implication is fully activated — the absence of a structural floor until S2 (75,686.84) and L5 (75,691.39) means that in a large gap-down, the 75,686–75,691 zone is the first meaningful recovery area, and scalpers should wait for this level before initiating any long positions. The primary strategy is protective: put holders should partially book profits at L4 (75,854.14) and L5 (75,691.39), as these Camarilla extreme levels often produce sharp short-covering bounces — a 15-min reversal candle at L5 (75,691.39) with high volume is the safest long scalp entry with a stop below L6 (75,625.06).
|
▲ Upside Path → OI-R Recovery from a gap-down follows the path: **BC (76,163.16) → P (76,193.51) → TC (76,223.86) → H3 (76,272.14) → OI-R (76,500)**; each level must show a 15-min candle close above it before the next target is activated — trail stops should be moved to BC (76,163.16) once P (76,193.51) is cleared, and to TC (76,223.86) once H3 (76,272.14) is tagged. The Trending market structure in SENSEX means that genuine recoveries tend to be strong and fast once the CPR band is reclaimed — volume above TC (76,223.86) is the key confirmation signal for institutional participation in the recovery. |
▼ Downside Path → OI-S The bear path from continued gap-down weakness: **L3 (75,993.48) → OI-S (76,000) [above L3 - note inversion] → S1 (75,909.83) → L4 (75,854.14) → S2 (75,686.84) → L5 (75,691.39)**; the L3–OI-S cluster at 75,993–76,000 is where initial buying interest emerges — a 15-min close below 75,993.48 triggers systematic selling with retail stops below the previous session's critical support. L4 (75,854.14) is the Camarilla breakdown trigger and is the next major acceleration point — a clean 15-min close below L4 opens the path toward L5 (75,691.39) and S2 (75,686.84), a nearly coincident support cluster approximately 440 pts below the previous close. |
| 🔴 OI-R: **OI-R at 76,500** in a gap-down scenario is the distant ceiling that shows where call writers are defending for the weekly expiry — with SENSEX potentially opening 500–700 pts below 76,500 in a significant gap-down, OI-R is operationally irrelevant for intraday direction but psychologically important as it shows that the market had established bullish expectations above current levels. The CE wall at 76,500 means there is no incremental buying support from gamma hedging at lower levels — market makers are delta-neutral at 76,500 and will not provide artificial demand as SENSEX falls below 76,200. | 🟢 OI-S: **OI-S at 76,000** is the single most important level in a gap-down SENSEX scenario — it is the weekly PE support wall, and a gap-down that opens near or below 76,000 immediately tests whether put writers will defend their positions or capitulate by buying back short puts. If 76,000 holds (15-min candle closes back above 76,000 and L3 at 75,993.48), the bounce can be sharp and fast — 200–300 pts of recovery toward BC (76,163.16) is achievable in 30–45 minutes. A clean breach of 76,000 (15-min close below L3 at 75,993.48) triggers put-writer capitulation and accelerates selling toward L4 (75,854.14). |
⚡ Key Trigger: **Failure to reclaim BC (76,163.16) within 15 minutes** is the definitive bear confirmation for the gap-down scenario in SENSEX — the Narrow CPR (0.08%) means the 15-min candle is the decision candle, not the 30-min, and the Trending market structure means that failed recovery attempts at BC will be followed by institutional bear activity. The bull reclaim trigger is a **15-min candle close above BC (76,163.16)** on above-average volume, which initiates a gap-fill rally toward P (76,193.51), TC (76,223.86), and H3 (76,272.14) — only a close above TC (76,223.86) converts the session's structural bias from bearish to bullish, and this represents a recovery of approximately 91 pts from BC (76,163.16) that must be sustained on volume.
◆ Near Flat Open — Open ≈ Prev Close (±0.05%)
◆ Neutral
Open lands: A ±0.05% flat open from 76,132.81 places SENSEX in the range of 76,095 to 76,171, which is below BC (76,163.16) at the higher end and well below BC at the lower end — per Descending CPR rules, the flat open confirms 'two sessions below CPR' territory, as the close was already below BC and the flat open maintains that position.
CPR role: Decision zone / compression band — even though price opens below the CPR band, the CPR (BC 76,163.16 to TC 76,223.86) is only 30–70 pts above the opening price, making it the immediate overhead decision zone; the session will be defined by whether SENSEX can rally into and through the CPR band or immediately sells off from below BC.
Near Flat (±0.05%)
A flat open near 76,133 places SENSEX just below BC (76,163.16) in a Descending Narrow CPR environment — the CPR width of 0.08% is the tightest of all three indices, which per the Narrow CPR framework creates the highest probability of a trending day in either direction, and the first 15-min candle is the definitive trade signal. The **bull trigger is a 15-min candle close above TC (76,223.86)** — a close above TC neutralises the Descending CPR's bearish structure and signals that hidden buying strength has overwhelmed the two-session below-CPR weakness; above TC, the session targets H3 (76,272.14), H4 (76,411.48), and ultimately OI-R (76,500) as the weekly CE ceiling. The **bear trigger is a 15-min candle close below OI-S (76,000) / L3 (75,993.48)** — this 6.52-pt zone is an extremely precise bear signal, and a close below it on the first 15-min candle would confirm that the Descending CPR's bearish bias has fully taken hold and the Trending market structure is trending bearish, targeting L4 (75,854.14) and S1 (75,909.83). The weekly max pain at 76,300 adds a third scenario: if neither the bull nor bear trigger fires in the first 15 minutes, option market-makers will create conditions to pin SENSEX near 76,300 for expiry on 10 Sep 2026 — in this sideways scenario, the best trade is a range between OI-S (76,000) and OI-R (76,500), with short-dated straddle selling near 76,100–76,200 as the institutional pinning play.
|
▲ Upside Path → OI-R From a confirmed 15-min close above TC (76,223.86), the upside path progresses: **TC (76,223.86) → H3 (76,272.14) → H4 (76,411.48) → R1 (76,416.50) → H5 (76,574.23) → OI-R (76,500)**; note OI-R (76,500) sits between H4/R1 and H5, making it the primary profit-taking zone — per the Narrow CPR width rule, partial profits at R1 (76,416.50) and trail to TC (76,223.86) is the disciplined approach, avoiding the temptation to hold through OI-R which is heavily defended by CE writers. The Trending market structure supports a sustained move once TC is cleared — high volume through H3 (76,272.14) confirms institutional buying and distinguishes a genuine trend day from a short-covering spike. |
▼ Downside Path → OI-S From a confirmed 15-min close below L3 (75,993.48) / OI-S (76,000), the downside path progresses: **L3 (75,993.48) → PDL (75,970.52) → S1 (75,909.83) → L4 (75,854.14) → S2 (75,686.84) → L5 (75,691.39)**; the L3–PDL cluster at 75,993–75,970 is the first acceleration zone where retail stop-losses cascade, quickly bringing price toward S1 (75,909.83). The near-coincident S2/L5 cluster at 75,686–75,691 is the bear's maximum weekly downside target — per the Narrow CPR rule, partial profits on shorts should be taken at S1 (75,909.83) and the stop trailed to L3 (75,993.48) to protect against a sharp reversal at this key Camarilla support cluster. |
| 🔴 OI-R: **OI-R at 76,500** in a flat-open scenario is the weekly CE writing wall that defines the maximum intraday upside ceiling — in SENSEX's expiry structure (weekly expiry on 10 Sep 2026), the 76,500 CE wall is actively managed by institutional option sellers who will add short calls at 76,500 on every rally, creating a dynamic resistance that gets stronger as SENSEX approaches it. The weekly max pain at 76,300 being below OI-R (76,500) creates an interesting dynamic: option sellers' ideal exit is a 76,300 expiry, so they'll use the 76,500 wall as a fade trigger and let max pain gravity pull the index back to 76,300 — traders entering longs in a flat-open scenario should set exits between 76,300 (max pain) and 76,500 (OI-R), not beyond. | 🟢 OI-S: **OI-S at 76,000** in a flat-open scenario is extremely critical because SENSEX is opening only 133 pts above this level — it is within one bad 15-min candle of testing the weekly PE support wall. Put writers who are short puts at 76,000 will defend this level aggressively, creating a natural demand cushion that makes 76,000 an excellent long-scalp reference with a stop at L3 (75,993.48); however, if 76,000 fails (15-min close below L3 at 75,993.48), the put writers' collective risk increases dramatically, triggering position squaring and accelerated selling that makes 75,854–75,909 the next cluster target. |
⚡ Key Trigger: **First 15-min candle close above TC (76,223.86)** = bull trigger targeting H3 (76,272.14), H4 (76,411.48), and OI-R (76,500); **first 15-min candle close below L3 (75,993.48) / OI-S (76,000)** = bear confirmation targeting L4 (75,854.14) and S1 (75,909.83). The Narrow CPR (0.08%) makes this the most binary of all three index setups — SENSEX has the highest probability of a strong trending move in either direction, and the Trending market structure confirms that once direction is established on the first 15-min candle, it tends to persist for the majority of the session.
📊 VIX Insight: India VIX data was unavailable for 07 Sep 2026, which creates a significant information gap for volatility assessment heading into 08 Sep 2026. In the absence of VIX data, traders must rely on straddle pricing as a volatility proxy — NIFTY's weekly straddle at 127.75 pts (±0.27% from ATM 23,800) implies extremely compressed expected volatility for an expiry-week session, while SENSEX's weekly straddle at 693.1 pts (±0.91%) and BANKNIFTY's monthly straddle at 1321.4 pts suggest broader uncertainty over the respective expiry cycles. Until VIX data is confirmed, the conservative approach is to treat all positions as expiry-week plays with compressed premium, avoid large naked option positions, and prioritise defined-risk spreads over naked directional bets.
Overall View:
All three indices have printed Descending CPRs for 08 Sep 2026, with NIFTY and SENSEX showing Narrow widths (0.10% and 0.08% respectively) and BANKNIFTY showing a Medium width (0.15%) — this alignment strongly biases toward a trending session in each index, with direction determined by the opening relative to the CPR band. The market closed below all three daily CPR bands (NIFTY at 23,779 vs BC 23,790; SENSEX at 76,133 vs BC 76,163; BANKNIFTY at 57,088 vs BC 57,130), confirming persistent bearish pressure and placing the burden on bulls to reclaim their respective CPR bands within the first 15–30 minutes to shift the session's structural bias. Traders should focus on the key triggers — NIFTY's TC at 23,813.95, BANKNIFTY's TC at 57,214.90, and SENSEX's TC at 76,223.86 — and treat sustained closes above these levels as the day's most important structural confirmation before committing to directional positions on either side.
All three indices have printed Descending CPRs for 08 Sep 2026, with NIFTY and SENSEX showing Narrow widths (0.10% and 0.08% respectively) and BANKNIFTY showing a Medium width (0.15%) — this alignment strongly biases toward a trending session in each index, with direction determined by the opening relative to the CPR band. The market closed below all three daily CPR bands (NIFTY at 23,779 vs BC 23,790; SENSEX at 76,133 vs BC 76,163; BANKNIFTY at 57,088 vs BC 57,130), confirming persistent bearish pressure and placing the burden on bulls to reclaim their respective CPR bands within the first 15–30 minutes to shift the session's structural bias. Traders should focus on the key triggers — NIFTY's TC at 23,813.95, BANKNIFTY's TC at 57,214.90, and SENSEX's TC at 76,223.86 — and treat sustained closes above these levels as the day's most important structural confirmation before committing to directional positions on either side.
Disclaimer: KRV Prime provides educational and informational content relating to financial markets. Articles, research, examples, charts, strategies and tools are provided for educational purposes and should not be interpreted as personalised investment advice or a guarantee of financial performance. Markets involve risk, including possible loss of capital. Past performance does not guarantee future results. KRV Prime is not a SEBI Registered Investment Adviser or Research Analyst.