
Index Analysis
Intraday Analysis for 10 Sep 2026
KRV Prime16 September 202643 min
Educational/Derived AnalysisSource: KRV Prime Market Insights (End-of-Day)As of 16 Sep 2026, 02:46 PM IST
Intraday Analysis for 10 Sep 2026
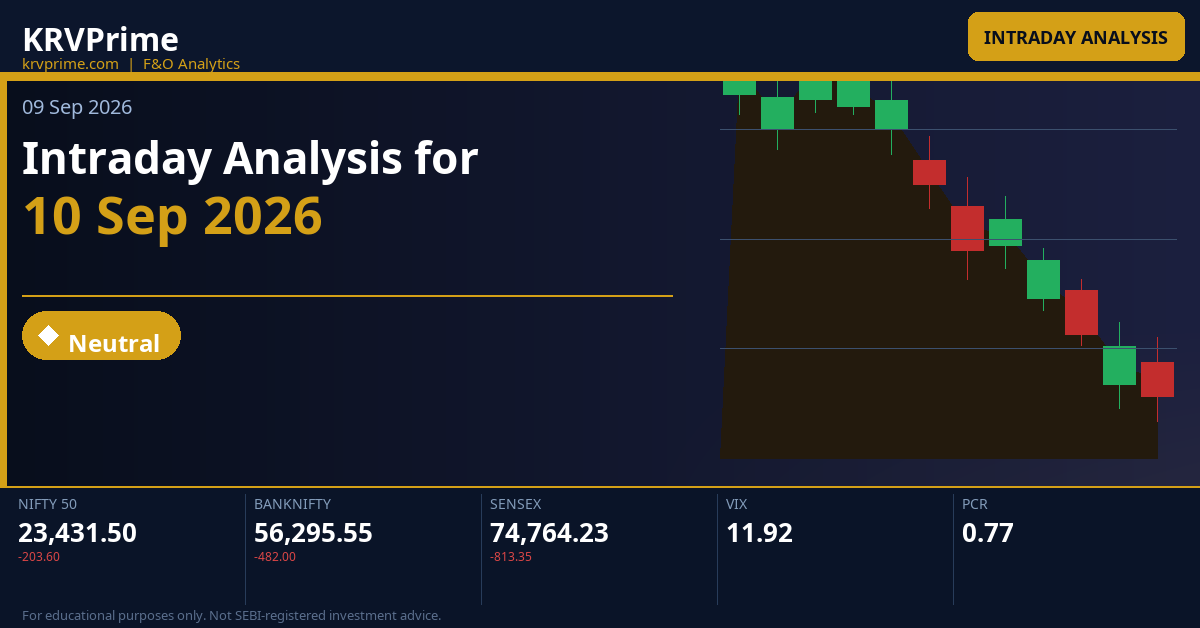
All three benchmark indices closed sharply lower on 09 Sep 2026, with NIFTY shedding **0.86%** to **23,431.50**, BANKNIFTY declining **0.85%** to **56,295.55**, and SENSEX losing **1.08%** to **74,764.23**, confirming broad-based selling pressure heading into the 10 Sep session. India VIX data is unavailable for this session, which limits precise volatility-based premium sizing, though the magnitude of the sell-off and elevated straddle premiums (NIFTY week straddle at **249.6 pts**, SENSEX week at **480.95 pts**) suggest implied volatility remains elevated and the market is pricing in continued uncertainty. Traders should treat each index's CPR band as the primary directional filter for tomorrow's session — all three indices carry **Descending Wide** CPR structures, meaning the entire CPR band sits below yesterday's price action and will act as overhead resistance on any recovery attempt.
Key Market Signals — Intraday Setup
All three indices — NIFTY, BANKNIFTY, and SENSEX — closed well below their respective weekly and monthly CPR bands on 09 Sep 2026, confirming multi-timeframe bearish alignment, and tomorrow's Descending Wide CPR structures across the board suggest that any gap-up open is likely to face stiff resistance, while gap-down opens could accelerate toward OI support levels at **23,000**, **56,000**, and **74,000** respectively.
Deep Technical Analysis & Levels
NIFTY
Descending — Wide (0.20%)
▼ Bearish
Market Structure Sideways or range-bound | Straddle ATM 23450 straddle priced at **249.6 pts** (Call 138.5 + Put 111.1), implying an expected intraday move of approximately **±249.6 pts** from the ATM strike, placing the upper boundary near **23,699** and lower boundary near **23,200** for the weekly expiry. | Max Pain Weekly max pain at **23,600** — a full **168.5 pts** above current close of 23,431.50, suggesting option sellers would benefit from a recovery toward 23,600 by expiry on 15 Sep 2026; however, intraday structure remains bearish unless price reclaims the CPR band. |
Tomorrow's Complete Level Map
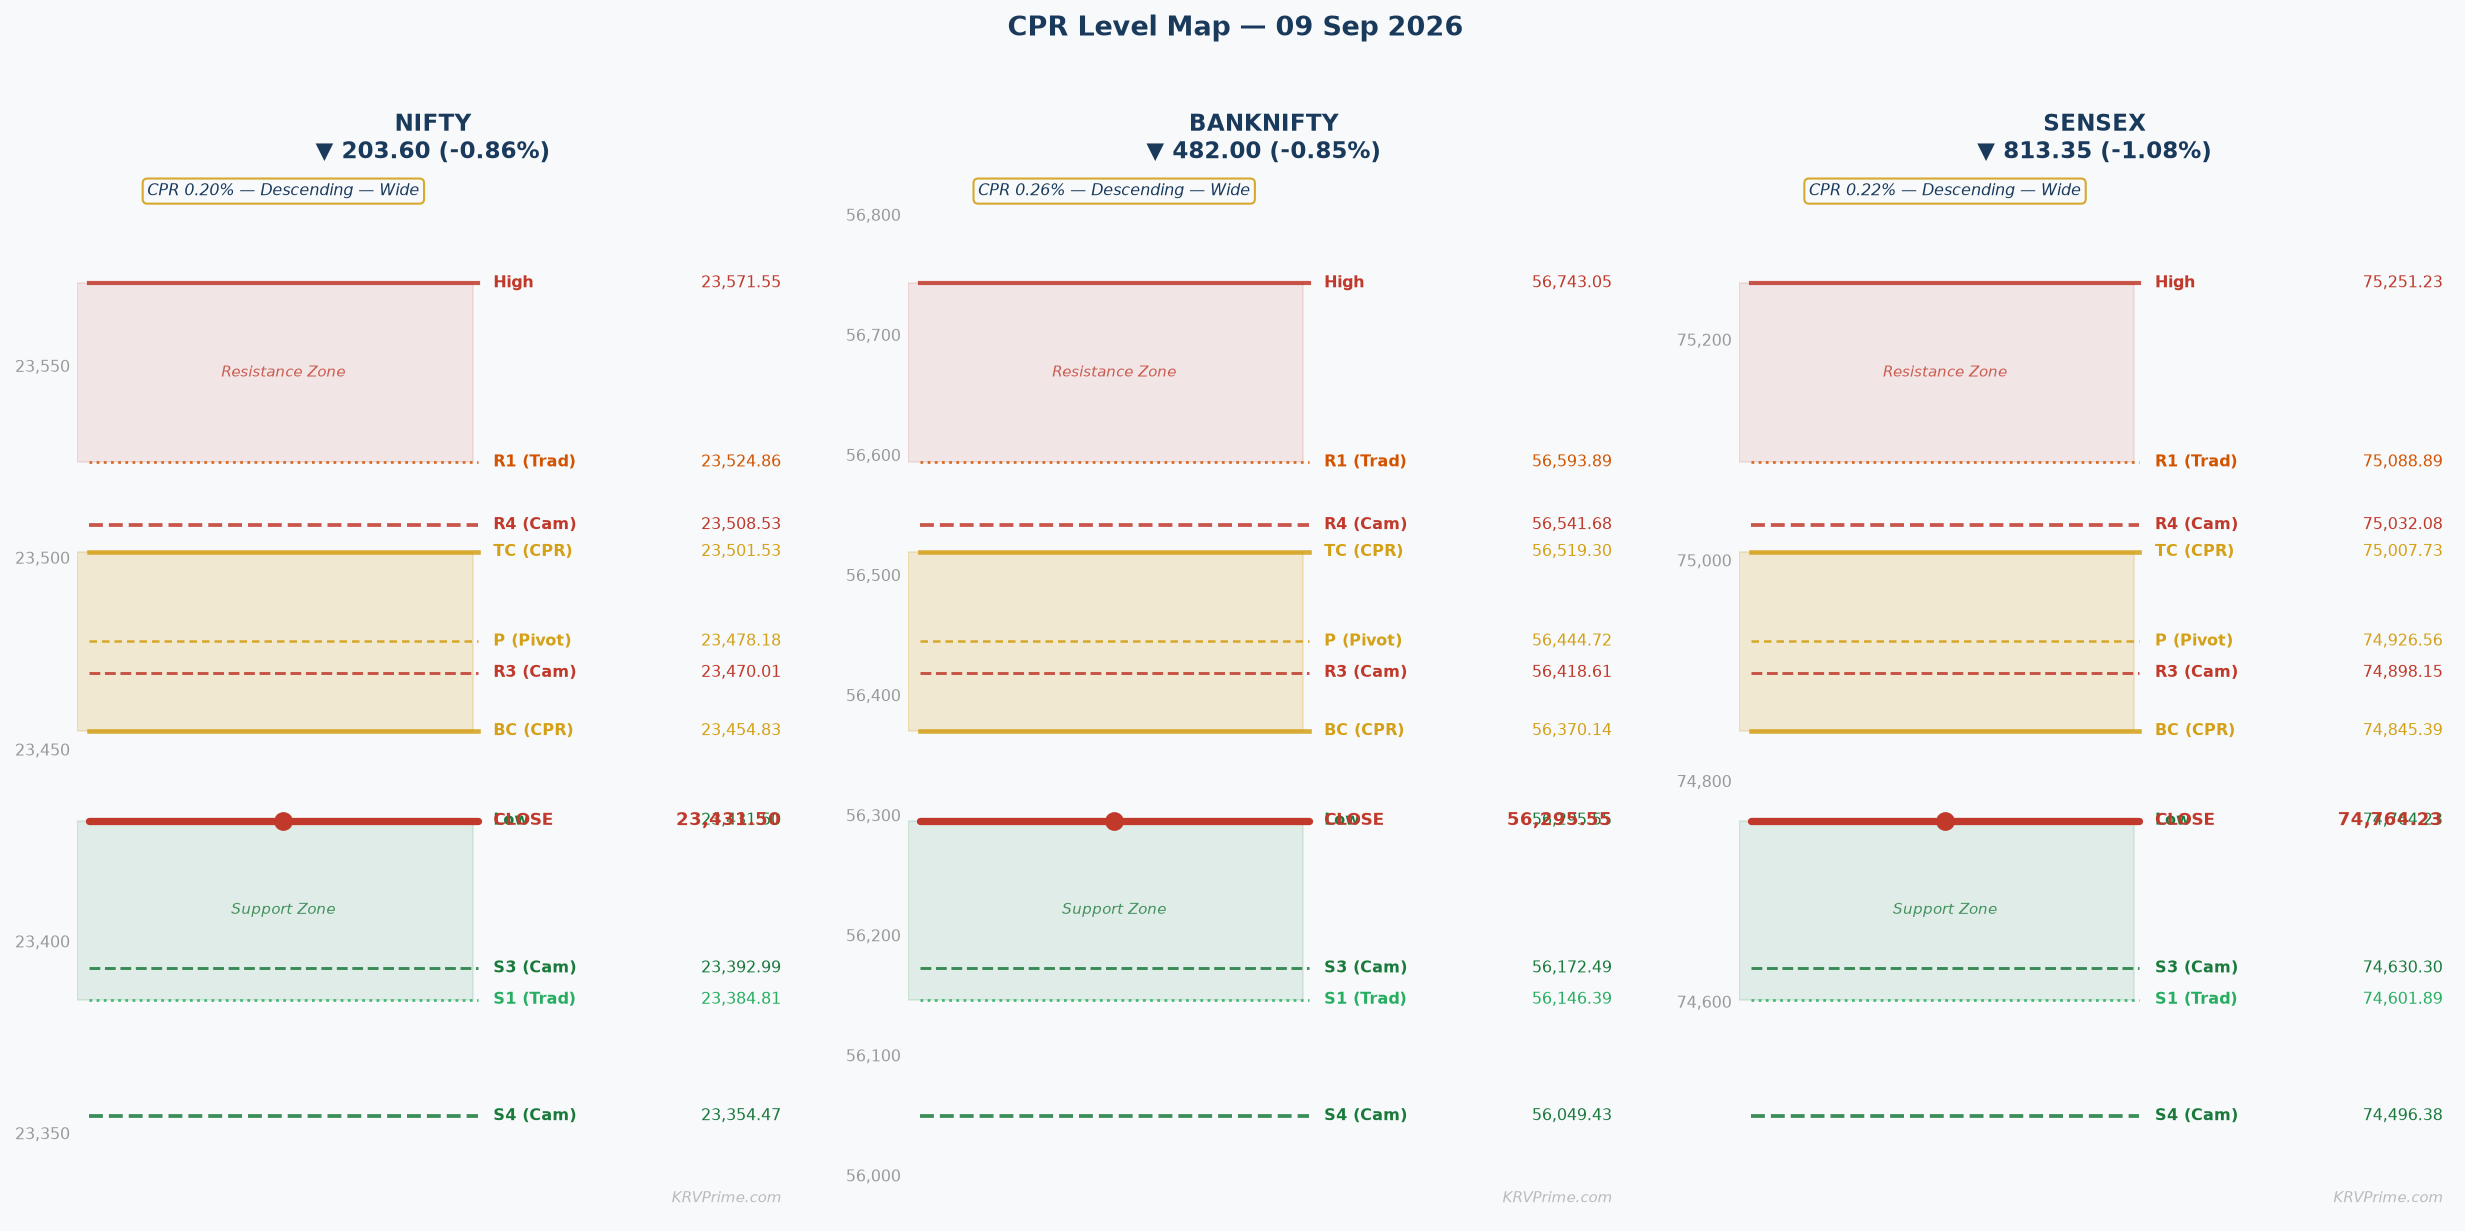
OI-R: 24,000 R3: 23,664.91 H6: 23,571.55 H5: 23,553.52 R2: 23,618.23 H4 ▶: 23,508.53 R1: 23,524.86 PDH: 23,571.55 H3 ↩: 23,470.01
TC: 23,501.53 P: 23,478.18 BC: 23,454.83
L3 ↩: 23,392.99 PDL: 23,431.50 S1: 23,384.81 L4 ▶: 23,354.47 S2: 23,338.13 L5: 23,309.48 L6: 23,291.45 S3: 23,244.76 OI-S: 23,000
↩ = Camarilla reversal point | ▶ = Camarilla breakout/breakdown trigger | OI-R/OI-S = Options wall (CE/PE max OI)
▲ Higher Open (Gap Up) — Open > Prev Close
↕ Conflicted
Open lands: For a Descending Wide CPR, a gap-up open above prev close (23,431.50) places price inside or approaching the CPR band — specifically, a minor gap up opens near BC (23,454.83), a significant gap up opens between BC and TC (23,501.53), and a large gap up opens above TC (23,501.53), which would be the first genuine bullish signal of the session.
CPR role: Overhead resistance — the entire CPR band (BC 23,454.83 to TC 23,501.53) acts as a supply zone since the CPR is Descending and sits above the previous close; price must fight through this band to establish bullish control.
Minor Gap (0.05–0.25%) — Structure Dominant
A minor gap up of **0.05–0.25%** opens NIFTY in the range of approximately **23,443–23,489**, placing price directly inside the CPR band between BC **23,454.83** and P **23,478.18**. The Descending Wide CPR structure creates an immediate conflict — while price appears to recover, the band is acting as resistance from above (TC at **23,501.53**) and any failure to close above TC within two 30-minute candles confirms the band as a supply zone. In this minor gap scenario, the first actionable target on the upside is TC **23,501.53** followed by R1 **23,524.86**, but traders should demand two consecutive 30-minute closes above TC before initiating longs, given the Wide CPR confirmation rule.
Significant Gap (0.25–0.5%) — Balanced
A significant gap up of **0.25–0.5%** opens NIFTY between approximately **23,490–23,548**, placing price near or just above TC **23,501.53** and approaching H4 **23,508.53** and R1 **23,524.86**. The risk of a gap-fill is moderate in this zone — opening above TC with the Descending Wide CPR creates a gap-fill trap where price may briefly appear bullish before sellers at H4 **23,508.53** and R1 **23,524.86** push it back inside the CPR band. If price sustains above R1 **23,524.86** for two 30-minute candles, the target extends toward H5 **23,553.52** and PDH **23,571.55**, but delta-hedging flows from CE writers at **24,000** create an invisible ceiling that limits aggressive upside participation.
Large Gap (>0.5%) — Gap Direction Dominant
A large gap up of **>0.5%** opens NIFTY above approximately **23,548**, potentially above H5 **23,553.52** or near PDH **23,571.55**, which also coincides with H6 **23,571.55** — a rare confluence of Camarilla extreme and PDH. In this scenario, gap-fill probability rises sharply because price is opening into a cluster of Camarilla resistance (H5 **23,553.52**, H6 **23,571.55**) and the PDH **23,571.55** all within a tight band, creating intense supply. The straddle of **249.6 pts** implies the market is already pricing in a move of this magnitude, so a large gap up exhausts much of the expected daily move on the open, making fade-from-H5/H6 the higher-probability trade targeting a return toward P **23,478.18** and BC **23,454.83**.
|
▲ Upside Path → OI-R Confirmed bull path: TC **23,501.53** → H4 **23,508.53** → R1 **23,524.86** → H5 **23,553.52** → R2 **23,618.23** → OI-R **24,000**; each Camarilla level (H3, H4, H5) should produce a brief consolidation before extension, and volume must remain above average at each break to confirm genuine momentum rather than short-covering exhaustion. The OI resistance at **24,000** remains the ultimate ceiling where CE writers will defend aggressively, making it an improbable intraday target unless news-driven momentum overwhelms the structural resistance. |
▼ Downside Path → OI-S Failure path from gap-up: rejection at TC **23,501.53** → P **23,478.18** → BC **23,454.83** → L3 **23,392.99** → S1 **23,384.81** → L4 **23,354.47** → OI-S **23,000**; loss of BC **23,454.83** on a 30-minute close signals that the gap-up was a bull trap and the Descending CPR structure has reasserted bearish control, making L3 **23,392.99** and S1 **23,384.81** the immediate targets. |
| 🔴 OI-R: OI resistance at **24,000** (CE max OI for both week and month) is a distant but powerful ceiling — CE writers have built a wall at this strike, meaning any rally toward **24,000** will face aggressive call selling that caps premium expansion and limits delta-positive momentum. In a gap-up scenario, **24,000** is effectively irrelevant as an intraday target given the **568.5 pt** distance from close, but it confirms that no sustained uptrend is possible without first absorbing this OI wall. | 🟢 OI-S: OI support at **23,000** (PE max OI for both week and month) represents the floor where PE writers have concentrated their positions — on a gap-up day, this level is the abort zone for any bearish thesis, as PE base at **23,000** suggests the market does not expect a breach below this strike before weekly expiry on 15 Sep 2026. |
⚡ Key Trigger: The key upside trigger is **two consecutive 30-minute candle closes above TC 23,501.53** on above-average volume — this confirms that the Descending CPR band has been overcome and bulls have structural control, shifting the target to R1 **23,524.86** and H4 **23,508.53**. Failure to achieve two 30-minute closes above TC **23,501.53** within the first hour confirms the CPR band as a supply trap, and price is likely to retrace toward P **23,478.18**, BC **23,454.83**, and ultimately L3 **23,392.99**.
▼ Lower Open (Gap Down) — Open < Prev Close
▼ Bearish
Open lands: For a Descending Wide CPR, a gap-down open below prev close (23,431.50) places price below the entire CPR band (BC 23,454.83 to TC 23,501.53), confirming the Descending CPR structure is in full bearish mode — the band now acts as overhead resistance, and bears have immediate structural advantage from the open.
CPR role: Overhead resistance — the CPR band (BC 23,454.83 to TC 23,501.53) is now fully above the opening price on a gap-down, making it a supply zone that price must recover through to negate the bearish bias; until reclaimed, all bounces toward BC 23,454.83 are sell opportunities.
Minor Gap (0.05–0.25%) — Structure Dominant
A minor gap down of **0.05–0.25%** opens NIFTY between approximately **23,373–23,419**, placing price below BC **23,454.83** and inside the L3 **23,392.99** to PDL **23,431.50** zone — a zone where bears have immediate control but gap-fill probability remains moderate since the distance to BC **23,454.83** is small. Minor gap-downs in a Descending Wide CPR context often see an initial recovery attempt toward BC **23,454.83** (which now acts as first resistance), and failure to close above BC within two 30-minute candles confirms the bear thesis with L3 **23,392.99** and S1 **23,384.81** as the first downside targets. Traders should watch whether price holds above L3 **23,392.99** — a 30-minute close below L3 opens the path to L4 **23,354.47** and S2 **23,338.13**.
Significant Gap (0.25–0.5%) — Balanced
A significant gap down of **0.25–0.5%** opens NIFTY between approximately **23,315–23,373**, placing price below L3 **23,392.99** and into the L4 **23,354.47** to L5 **23,309.48** zone — this is a structurally bearish opening that breaks multiple Camarilla supports simultaneously. The failure-and-resume thesis is dominant here: recovery attempts toward L3 **23,392.99** are likely to fail, as PUT writers at **23,000** and the Descending Wide CPR overhead (BC **23,454.83**) create a sandwich of resistance; the path of least resistance is L4 **23,354.47** → S2 **23,338.13** → L5 **23,309.48** → OI-S **23,000**. PUT writing activity at **23,000** suggests the options market expects support there, but a significant gap below L3 increases the probability of testing L4 **23,354.47** as the first intraday anchor.
Large Gap (>0.5%) — Gap Direction Dominant
A large gap down of **>0.5%** opens NIFTY below approximately **23,314**, potentially at or below L5 **23,309.48** or L6 **23,291.45** — a panic-open that signals aggressive institutional selling and tests the structural integrity of the OI support at **23,000**. In this scenario, the straddle of **249.6 pts** is immediately monetised from the put side, and the question shifts from direction to whether **23,000** holds as the weekly expiry (15 Sep 2026) PE wall — PUT writers will defend aggressively near **23,000**, making it a potential intraday reversal zone if panic selling exhausts. Recovery levels to watch are L5 **23,309.48** (first stabilisation), L4 **23,354.47** (recovery confirmation), and BC **23,454.83** (full structure reclaim) — a close above L4 on two 30-minute candles signals straddle sellers are monetising and smart money is absorbing.
|
▲ Upside Path → OI-R Recovery path: BC **23,454.83** → P **23,478.18** → TC **23,501.53** → H3 **23,470.01** → H4 **23,508.53** → R1 **23,524.86** → OI-R **24,000**; each level must be reclaimed with a 30-minute close for the recovery to be genuine rather than a dead-cat bounce, and volume above average at each reclaim confirms institutional participation rather than retail short-covering alone. |
▼ Downside Path → OI-S Bear continuation: PDL **23,431.50** → L3 **23,392.99** → S1 **23,384.81** → L4 **23,354.47** → S2 **23,338.13** → L5 **23,309.48** → L6 **23,291.45** → OI-S **23,000**; retail stop-losses clustered below L3 **23,392.99** and PDL **23,431.50** will accelerate the move toward L4 **23,354.47** once L3 is breached on a 30-minute close, creating a self-reinforcing cascade toward the OI support wall. |
| 🔴 OI-R: OI resistance at **24,000** functions as a distant overhead ceiling on a gap-down day — CE writers at this strike are deeply profitable and have no incentive to cover, creating a structural short overhang that prevents any meaningful rally from gaining traction beyond R2 **23,618.23** without a significant catalyst. Gamma pressure from CE writers at **24,000** will suppress delta-positive flows, keeping any recovery attempts shallow and short-lived. | 🟢 OI-S: OI support at **23,000** is the primary bear target and PUT monetisation zone — PE writers who sold puts at **23,000** will defend this level aggressively as weekly expiry (15 Sep 2026) approaches, creating a potential short-covering bounce at or near **23,000** that intraday traders can fade from the short side above or use as a reversal long with tight stops. |
⚡ Key Trigger: The key bear trigger is **failure to reclaim BC 23,454.83 within the first 60 minutes (two 30-minute candles)** — this confirms the Descending Wide CPR band is acting as overhead supply and the intraday trend is down, targeting L3 **23,392.99**, S1 **23,384.81**, and L4 **23,354.47** in sequence. The bull recovery trigger is a **two 30-minute close above BC 23,454.83**, which signals gap-fill is underway and price is reclaiming the CPR band, shifting targets to P **23,478.18** and TC **23,501.53**.
◆ Near Flat Open — Open ≈ Prev Close (±0.05%)
◆ Neutral
Open lands: A ±0.05% flat open places NIFTY between approximately **23,419–23,443**, which is below BC **23,454.83** — for a Descending Wide CPR, this is the classic 'near TC' scenario where price opens just below the entire CPR band, making the band an immediate overhead supply zone and the session a decision-point day.
CPR role: Decision zone — price opens just below BC **23,454.83** with the full CPR band (BC **23,454.83** to TC **23,501.53**) acting as resistance above; the session is a battle between bulls attempting to reclaim the CPR and bears defending the supply zone.
Near Flat (±0.05%)
A flat open in the context of a Descending Wide CPR (0.20%) is a high-information setup where the first 30-minute candle's relationship to BC **23,454.83** determines the day's entire directional structure — this is not a setup for early aggression but for patience and confirmation. The BC at **23,454.83** is the first gate: a 30-minute close above BC shifts bias to neutral-bullish targeting P **23,478.18** and TC **23,501.53**, while failure to reclaim BC within the first hour confirms bears are in control and L3 **23,392.99** becomes the next magnet. The Wide CPR (0.20%) reduces the probability of a clean trend day — unlike a Narrow CPR which creates strong trend-day momentum, a Wide CPR creates internal range friction between BC **23,454.83** and TC **23,501.53**, meaning price may oscillate within the band before breaking decisively. The bull trigger is **two consecutive 30-minute closes above TC 23,501.53** targeting H4 **23,508.53** and R1 **23,524.86**, while the bear trigger is **two consecutive 30-minute closes below BC 23,454.83** targeting L3 **23,392.99** and S1 **23,384.81** — in both cases, the Wide CPR rule demands two 30-minute confirmations before committing capital.
|
▲ Upside Path → OI-R TC **23,501.53** → H4 **23,508.53** → R1 **23,524.86** → H5 **23,553.52** → PDH **23,571.55** / H6 **23,571.55** → R2 **23,618.23** → OI-R **24,000**; each break above a Camarilla level should be accompanied by a volume expansion candle, and the confluence of PDH and H6 at **23,571.55** makes this the critical resistance cluster where the upside move is most likely to pause or reverse. |
▼ Downside Path → OI-S BC **23,454.83** → L3 **23,392.99** → S1 **23,384.81** → L4 **23,354.47** → S2 **23,338.13** → L5 **23,309.48** → L6 **23,291.45** → OI-S **23,000**; the breach of L3 **23,392.99** is particularly significant because it sits just below PDL **23,431.50** and S1 **23,384.81**, and a 30-minute close below L3 will trigger retail stop-losses and accelerate momentum toward L4 **23,354.47** and the weekly max pain zone. |
| 🔴 OI-R: OI resistance at **24,000** is a structural ceiling built by CE writers across both weekly (15 Sep 2026) and monthly (29 Sep 2026) series — in a flat-open scenario where price is **568.5 pts** below this level, OI-R functions as a distant backstop that caps bullish sentiment rather than an intraday target, ensuring any recovery attempts face gamma headwinds that prevent sustained upside beyond R3 **23,664.91** without a macro catalyst. | 🟢 OI-S: OI support at **23,000** is built by PE writers on both weekly and monthly series, creating a demand zone that market makers will defend near expiry — in a flat-open scenario, this level gives bulls a medium-term cushion and reduces the urgency of aggressive downside positions, but intraday traders should note that **431.5 pts** separates current close from this floor, meaning intraday moves to OI-S are possible only in large gap-down or panic-sell conditions. |
⚡ Key Trigger: Bull trigger: **two consecutive 30-minute candle closes above TC 23,501.53** on above-average volume confirms CPR band breakout with targets at H4 **23,508.53**, R1 **23,524.86**, and H5 **23,553.52**. Bear trigger: **two consecutive 30-minute candle closes below BC 23,454.83** confirms the CPR band is acting as a ceiling and the day's path leads toward L3 **23,392.99**, S1 **23,384.81**, L4 **23,354.47**, and ultimately OI-S **23,000** — the structural fulcrum is the CPR band itself because the Descending Wide formation makes it the single most important battleground of the session.
BANKNIFTY
Descending — Wide (0.26%)
▼ Bearish
Market Structure Sideways or range-bound | Straddle ATM 56300 monthly straddle priced at **1359.15 pts** (Call 855.15 + Put 504.0), implying an expected move of approximately **±1359.15 pts** from the ATM strike, placing the upper boundary near **57,659** and lower boundary near **54,941** for the monthly expiry on 29 Sep 2026. | Max Pain Monthly max pain at **57,500** — a full **1,204.45 pts** above current close of 56,295.55, representing a significant pull toward higher strikes for option sellers; however, with 20 days to monthly expiry, intraday structure remains bearish and the max pain pull will only become dominant in the final week of expiry. |
Tomorrow's Complete Level Map
OI-R: 57,500 R3: 57,041.39 H6: 56,743.05 H5: 56,685.43 R2: 56,892.22 H4 ▶: 56,541.68 R1: 56,593.89 PDH: 56,743.05 H3 ↩: 56,418.61
TC: 56,519.30 P: 56,444.72 BC: 56,370.14
L3 ↩: 56,172.49 PDL: 56,295.55 S1: 56,146.39 L4 ▶: 56,049.43 S2: 55,997.22 L5: 55,905.70 L6: 55,848.05 S3: 55,698.89 OI-S: 56,000
↩ = Camarilla reversal point | ▶ = Camarilla breakout/breakdown trigger | OI-R/OI-S = Options wall (CE/PE max OI)
▲ Higher Open (Gap Up) — Open > Prev Close
↕ Conflicted
Open lands: For a Descending Wide CPR, a gap-up above prev close (56,295.55) opens BANKNIFTY inside or approaching the CPR band — a minor gap lands between PDL 56,295.55 and BC 56,370.14, a significant gap opens between BC 56,370.14 and TC 56,519.30, and a large gap opens above TC 56,519.30, which is the only scenario that genuinely challenges the Descending CPR bearish bias.
CPR role: Overhead resistance — the CPR band (BC 56,370.14 to TC 56,519.30) is a 149-point supply zone that sits above the previous close; all gap-up opens must fight through this band to establish bullish control, and the Wide CPR (0.26%) demands two 30-minute confirmations before any directional trade is initiated.
Minor Gap (0.05–0.25%) — Structure Dominant
A minor gap up of **0.05–0.25%** opens BANKNIFTY between approximately **56,324–56,436**, placing price either just above PDL **56,295.55** or inside the lower CPR band between BC **56,370.14** and P **56,444.72**. The Descending Wide CPR creates an immediate supply conflict — H3 at **56,418.61** sits inside the CPR band itself, making it the first intraday resistance that price must clear before targeting P **56,444.72** and BC **56,370.14** from below. Two 30-minute closes above TC **56,519.30** are required by the Wide CPR confirmation rule before longs are justified, and the first actionable target on the upside is H4 **56,541.68** followed by R1 **56,593.89**.
Significant Gap (0.25–0.5%) — Balanced
A significant gap up of **0.25–0.5%** opens BANKNIFTY between approximately **56,436–56,577**, placing price between P **56,444.72** and H4 **56,541.68** — a zone where the CPR band is both being tested and potentially being breached, creating a high-conviction setup only on a two 30-minute close confirmation above TC **56,519.30**. Gap-fill risk is elevated in this zone because opening between P **56,444.72** and H4 **56,541.68** puts price inside a Camarilla breakout trigger zone, and delta-hedging flows from CE writers at OI-R **57,500** will create selling pressure on any sustained move above R1 **56,593.89**. If two 30-minute closes above TC **56,519.30** confirm, the path extends to R1 **56,593.89**, H5 **56,685.43**, and R2 **56,892.22**, but the OI resistance at **57,500** remains the monthly ceiling.
Large Gap (>0.5%) — Gap Direction Dominant
A large gap up of **>0.5%** opens BANKNIFTY above approximately **56,577**, potentially above H4 **56,541.68** or near H5 **56,685.43** — a powerful opening that places price above the entire CPR band and into Camarilla extended territory. In this scenario, gap-fill probability toward P **56,444.72** or BC **56,370.14** is meaningful because price opens above all CPR band levels and the Descending structure's overhead pressure is exhausted, but the Camarilla H5 **56,685.43** and H6 **56,743.05** (which coincides with PDH) create a twin resistance cluster that limits further extension. The straddle of **1359.15 pts** implies a large gap up has consumed a significant portion of the expected monthly move on the open itself, making fade-from-H5/H6 the highest-probability trade targeting a return toward TC **56,519.30** and P **56,444.72**.
|
▲ Upside Path → OI-R Confirmed bull path: TC **56,519.30** → H4 **56,541.68** → R1 **56,593.89** → H5 **56,685.43** → H6 **56,743.05** / PDH **56,743.05** → R2 **56,892.22** → R3 **57,041.39** → OI-R **57,500**; the confluence of H6 and PDH at **56,743.05** is the critical intraday resistance cluster — if this is breached on two 30-minute closes, momentum builds toward the OI-R at **57,500** where CE writers are positioned for monthly expiry. |
▼ Downside Path → OI-S Failure from gap-up: rejection at TC **56,519.30** → P **56,444.72** → BC **56,370.14** → L3 **56,172.49** → S1 **56,146.39** → L4 **56,049.43** → OI-S **56,000**; the critical bear confirmation is a 30-minute close below BC **56,370.14**, which signals the CPR band supply zone has overwhelmed buying and the full Descending structure is resuming bearish momentum. |
| 🔴 OI-R: OI resistance at **57,500** (CE max OI for monthly expiry 29 Sep 2026) is a **1,204.45 pt** ceiling above current close — on a gap-up day, CE writers at **57,500** create a structural headwind that prevents premium expansion and limits delta-positive momentum, ensuring that even a strong gap-up will face gamma-related selling pressure well before reaching the monthly CE wall. This OI-R acts as the absolute ceiling for any intraday bullish scenario. | 🟢 OI-S: OI support at **56,000** (PE max OI for monthly expiry) is only **295.55 pts** below the previous close, making it a near-term and highly relevant support on a gap-up day — PE writers at **56,000** will defend this level aggressively, providing a floor that limits downside on gap-up reversal days, and the proximity to current price means any bear reversal from a gap-up open could test this critical support the same session. |
⚡ Key Trigger: The bull trigger is **two consecutive 30-minute candle closes above TC 56,519.30** on above-average volume, which confirms the Descending Wide CPR has been negated and bulls have structural session control, with immediate targets at H4 **56,541.68** and R1 **56,593.89**. Failure to achieve two 30-minute closes above TC **56,519.30** confirms the gap-up is a supply-zone trap and the Descending CPR has re-exerted control, with price likely to reverse toward BC **56,370.14**, L3 **56,172.49**, and OI-S **56,000**.
▼ Lower Open (Gap Down) — Open < Prev Close
▼ Bearish
Open lands: For a Descending Wide CPR, a gap-down below prev close (56,295.55) opens BANKNIFTY below the entire CPR band (BC 56,370.14 to TC 56,519.30), placing price in full bearish structural territory — the CPR band is now completely overhead as resistance, and bears have immediate session control with the next critical support at L3 56,172.49 and OI-S 56,000.
CPR role: Overhead resistance — the CPR band (BC 56,370.14 to TC 56,519.30) is fully above the gap-down open, acting as a 149-point supply ceiling; all recovery attempts are sells near BC 56,370.14 unless two 30-minute closes confirm reclamation of the band.
Minor Gap (0.05–0.25%) — Structure Dominant
A minor gap down of **0.05–0.25%** opens BANKNIFTY between approximately **56,155–56,267**, placing price between S1 **56,146.39** and PDL **56,295.55** — a zone where bears are in control but the proximity to OI support at **56,000** creates a natural demand cushion that may limit downside initially. Minor gap-downs often see a recovery attempt toward PDL **56,295.55** and BC **56,370.14** within the first 30–60 minutes, and failure of BC **56,370.14** to be reclaimed on two 30-minute closes confirms the day's direction as down, targeting L3 **56,172.49**, S1 **56,146.39**, and L4 **56,049.43**. The proximity of OI-S **56,000** at only **155.39 pts** below S1 **56,146.39** makes this level the critical intraday support — a breach below **56,000** would be a major bearish event.
Significant Gap (0.25–0.5%) — Balanced
A significant gap down of **0.25–0.5%** opens BANKNIFTY between approximately **55,862–56,154**, placing price near or below L3 **56,172.49**, S1 **56,146.39**, and potentially approaching L5 **55,905.70** — a structurally bearish opening that breaks through multiple Camarilla support levels simultaneously and enters the OI support zone near **56,000**. PUT writers at **56,000** will attempt to defend aggressively, creating a potential bounce from the **55,905–56,049** zone (L5 **55,905.70** to L4 **56,049.43**), but any recovery that fails to reclaim L3 **56,172.49** on two 30-minute closes signals the failure-and-resume thesis with targets at L4 **56,049.43**, S2 **55,997.22**, L5 **55,905.70**, and S3 **55,698.89**. The monthly straddle of **1359.15 pts** confirms that the options market is pricing in moves of this magnitude as normal monthly volatility.
Large Gap (>0.5%) — Gap Direction Dominant
A large gap down of **>0.5%** opens BANKNIFTY below approximately **55,862**, potentially below L5 **55,905.70** or L6 **55,848.05** — a panic-open that signals aggressive institutional distribution and tests the structural integrity of the OI support at **56,000**, which may already be breached on the open. In this scenario, the PUT monetisation opportunity is immediate from the short side — L6 **55,848.05** and S3 **55,698.89** are the next critical levels, and the monthly PE wall at **56,000** now acts as resistance overhead rather than support below. Recovery levels to stabilise the session are L5 **55,905.70** (first stabilisation), L4 **56,049.43** (recovery confirmation), and L3 **56,172.49** (structural reclaim) — only two 30-minute closes above L3 **56,172.49** would signal panic absorption.
|
▲ Upside Path → OI-R Recovery path: PDL **56,295.55** → BC **56,370.14** → P **56,444.72** → TC **56,519.30** → H4 **56,541.68** → R1 **56,593.89** → OI-R **57,500**; each level must be reclaimed with a 30-minute close and above-average volume to distinguish genuine recovery from a dead-cat bounce, with TC **56,519.30** being the most critical structural reclaim for the day. |
▼ Downside Path → OI-S Bear path: PDL **56,295.55** → L3 **56,172.49** → S1 **56,146.39** → L4 **56,049.43** → OI-S **56,000** → S2 **55,997.22** → L5 **55,905.70** → L6 **55,848.05** → S3 **55,698.89**; retail stop-losses below PDL **56,295.55** and L3 **56,172.49** will cascade into institutional selling near the OI-S **56,000** zone, creating a self-reinforcing move that only stabilises if PE writers defend at **56,000** aggressively enough to absorb the panic flow. |
| 🔴 OI-R: OI resistance at **57,500** functions as a distant structural ceiling on a gap-down day — CE writers at this monthly strike have significant profitable positions and no incentive to cover, creating a gamma headwind that keeps any recovery rally from gaining structural momentum beyond R2 **56,892.22** without a major macro catalyst. The **1,204.45 pt** distance from close to OI-R ensures this level is a session-irrelevant ceiling on a gap-down day. | 🟢 OI-S: OI support at **56,000** is the most critical level on a gap-down day — PE writers at this monthly strike are defending their positions aggressively, making **56,000** a genuine bounce zone where short-covering and PE writer delta-hedging could combine to create a sharp intraday reversal; traders should watch for high-volume absorption candles near this level before adding to shorts, as a false break below **56,000** followed by recovery is a classic PE writer stop-hunt pattern. |
⚡ Key Trigger: Bear confirmation: **failure to reclaim BC 56,370.14 within two 30-minute candles** from the open confirms the Descending Wide CPR is acting as overhead supply and the intraday trend is firmly down, with targets at L3 **56,172.49**, S1 **56,146.39**, L4 **56,049.43**, and OI-S **56,000**. Bull recovery trigger: **two consecutive 30-minute closes above BC 56,370.14** signals gap-fill is underway and price is attempting to reclaim the CPR band, shifting targets to P **56,444.72** and TC **56,519.30** — this is the only trigger that neutralises the day's bearish bias.
◆ Near Flat Open — Open ≈ Prev Close (±0.05%)
◆ Neutral
Open lands: A ±0.05% flat open places BANKNIFTY between approximately **56,267–56,324**, which is below BC **56,370.14** and below the entire CPR band — for a Descending Wide CPR, this is the 'near TC' flat scenario where price opens just below the CPR's lower boundary, making BC 56,370.14 the immediate overhead resistance and the session a classic Descending CPR decision day.
CPR role: Decision zone — price opens below BC **56,370.14** with the full CPR band (BC **56,370.14** to TC **56,519.30**) as overhead resistance; the 30-minute candle's relationship to BC **56,370.14** determines whether the day becomes a range recovery or a bearish continuation toward L3 **56,172.49** and OI-S **56,000**.
Near Flat (±0.05%)
A flat open below BC **56,370.14** in the context of a Descending Wide CPR (0.26%) is a structural decision-point setup — the wide CPR band creates internal range friction between BC **56,370.14** and TC **56,519.30**, meaning price oscillation within this 149-point band is expected before a directional break emerges, and patience is the highest-value trade attribute here. The BC at **56,370.14** is the first and most important gate: a two 30-minute close above BC shifts the session to neutral-bullish targeting P **56,444.72**, TC **56,519.30**, and H4 **56,541.68**, while failure to reclaim BC within the first hour confirms the Descending structure's bearish control and targets L3 **56,172.49** and S1 **56,146.39** as the first bear targets. The Wide CPR (0.26%) specifically reduces trend-day probability and increases mean-reversion probability within the band — unlike a Narrow CPR where the first 15-minute candle sets the session, the Wide structure demands two 30-minute close confirmations at every level, making overtrading inside the CPR band a capital-destroying activity. Bull trigger: **two consecutive 30-minute closes above TC 56,519.30** targeting H4 **56,541.68**, R1 **56,593.89**, H5 **56,685.43**, and ultimately OI-R **57,500**; bear trigger: **two consecutive 30-minute closes below BC 56,370.14** targeting L3 **56,172.49**, S1 **56,146.39**, L4 **56,049.43**, and OI-S **56,000** — the OI support at **56,000** is critically close at only **370 pts** below the flat open, making downside risk asymmetrically important today.
|
▲ Upside Path → OI-R TC **56,519.30** → H4 **56,541.68** → R1 **56,593.89** → H5 **56,685.43** → H6 **56,743.05** / PDH **56,743.05** → R2 **56,892.22** → R3 **57,041.39** → OI-R **57,500**; the confluence of H6 and PDH at **56,743.05** is the session's most powerful resistance cluster and requires volume confirmation to break, while OI-R **57,500** is the absolute monthly ceiling for any sustained rally. |
▼ Downside Path → OI-S BC **56,370.14** → L3 **56,172.49** → S1 **56,146.39** → L4 **56,049.43** → OI-S **56,000** → S2 **55,997.22** → L5 **55,905.70**; the proximity of OI-S **56,000** to the flat-open price makes downside scenarios particularly urgent — a breach of L3 **56,172.49** on a 30-minute close will trigger retail stop-losses and accelerate momentum toward the critical **56,000** PUT wall. |
| 🔴 OI-R: OI resistance at **57,500** (monthly CE max OI) is a **1,204.45 pt** ceiling above the flat open — in this scenario, it functions as a medium-term structural cap that prevents sustained bullishness beyond R3 **57,041.39**, as CE writers at **57,500** will create gamma-related selling pressure on any approach, ensuring the max pain pull toward **57,500** is a weekly process rather than an intraday event. | 🟢 OI-S: OI support at **56,000** (monthly PE max OI) is only **295.55 pts** below the flat open price, making it the most critically proximate OI level for BANKNIFTY today — PE writers at **56,000** have significant open interest and will defend aggressively, creating a bounce risk zone that intraday shorts must respect; any sustained close below **56,000** on two 30-minute candles would represent a major bearish structural break that invalidates the PE writing thesis. |
⚡ Key Trigger: Bull trigger: **two consecutive 30-minute closes above TC 56,519.30** on above-average volume confirms CPR band breakout with targets at H4 **56,541.68**, R1 **56,593.89**, and H5 **56,685.43**. Bear trigger: **two consecutive 30-minute closes below BC 56,370.14** confirms the CPR band is acting as supply and the Descending structure is in control, with the sequence L3 **56,172.49** → S1 **56,146.39** → L4 **56,049.43** → OI-S **56,000** as the day's bear roadmap — the structural fulcrum is BC **56,370.14** because it is the lowest line of CPR band defense, and its breach signals institutional sellers are in full control of the session.
SENSEX
Descending — Wide (0.22%)
▼ Bearish
Market Structure Sideways or range-bound | Straddle ATM 74800 weekly straddle priced at **480.95 pts** (Call 217.65 + Put 263.3), implying an expected intraday move of approximately **±480.95 pts** from the ATM strike, placing the upper boundary near **75,281** and lower boundary near **74,319** for the weekly expiry on 10 Sep 2026 (today is expiry day). | Max Pain Weekly max pain at **75,000** — a full **235.77 pts** above current close of 74,764.23, creating a strong gravitational pull toward **75,000** as expiry day approaches; on weekly expiry day (10 Sep 2026), max pain mechanics are at maximum potency and price has a high probability of gravitating toward **75,000** by close, making this the most important reference level for SENSEX today. |
Tomorrow's Complete Level Map
OI-R: 76,000 R3: 75,575.89 H6: 75,251.23 H5: 75,188.51 R2: 75,413.56 H4 ▶: 75,032.08 R1: 75,088.89 PDH: 75,251.23 H3 ↩: 74,898.15
TC: 75,007.73 P: 74,926.56 BC: 74,845.39
L3 ↩: 74,630.30 PDL: 74,764.23 S1: 74,601.89 L4 ▶: 74,496.38 S2: 74,439.56 L5: 74,339.96 L6: 74,277.23 S3: 74,114.89 OI-S: 74,000
↩ = Camarilla reversal point | ▶ = Camarilla breakout/breakdown trigger | OI-R/OI-S = Options wall (CE/PE max OI)
▲ Higher Open (Gap Up) — Open > Prev Close
↕ Conflicted
Open lands: For a Descending Wide CPR, a gap-up above prev close (74,764.23) opens SENSEX inside or approaching the CPR band — a minor gap lands between PDL 74,764.23 and BC 74,845.39, a significant gap opens between BC 74,845.39 and TC 75,007.73, and a large gap opens above TC 75,007.73, with the max pain pull toward 75,000 on weekly expiry day making the TC zone especially significant.
CPR role: Overhead resistance with expiry-day max pain gravitational pull — the CPR band (BC 74,845.39 to TC 75,007.73) sits above prev close and acts as supply, but the weekly max pain at 75,000 (inside this band near TC 75,007.73) creates a counterforce that pulls price toward the top of the band by expiry close.
Minor Gap (0.05–0.25%) — Structure Dominant
A minor gap up of **0.05–0.25%** opens SENSEX between approximately **74,801–74,951**, placing price between PDL **74,764.23** and P **74,926.56** — partially inside the CPR band and approaching BC **74,845.39** from below. This is a critical expiry-day setup: the minor gap up places price near BC **74,845.39** where H3 **74,898.15** also provides a Camarilla mean-reversion reference, and the weekly max pain at **75,000** creates a gravitational pull that favors a drift toward TC **75,007.73** if price can sustain above BC **74,845.39** on two 30-minute closes. The Wide CPR (0.22%) confirmation rule demands two 30-minute closes above TC **75,007.73** before initiating longs, with targets at H4 **75,032.08** and R1 **75,088.89** — expiry day option pinning near **75,000** makes TC **75,007.73** the day's pivotal level.
Significant Gap (0.25–0.5%) — Balanced
A significant gap up of **0.25–0.5%** opens SENSEX between approximately **74,951–75,137**, placing price near or above TC **75,007.73** and between H4 **75,032.08** and H5 **75,188.51** — a powerful opening that aligns with the weekly max pain pull toward **75,000** and suggests delta-hedging flows are supporting the move. The risk of gap-fill is moderate because opening above TC **75,007.73** on expiry day with max pain at **75,000** creates a natural pinning dynamic where option sellers actively work to keep price near **75,000** by adjusting their hedges throughout the day. If price sustains above TC **75,007.73** for two 30-minute candles, the targets are H4 **75,032.08**, R1 **75,088.89**, H5 **75,188.51**, and PDH **75,251.23** — but CE writers at OI-R **76,000** cap any extension significantly above this zone.
Large Gap (>0.5%) — Gap Direction Dominant
A large gap up of **>0.5%** opens SENSEX above approximately **75,137**, near H5 **75,188.51** or PDH/H6 **75,251.23** — on weekly expiry day, this is a rare but powerful setup where price opens above the weekly max pain zone of **75,000** and near the Camarilla H5/H6 cluster. Gap-fill probability toward TC **75,007.73** and max pain **75,000** is high on expiry day because option sellers with shorts at higher strikes have maximum incentive to pin price below R1 **75,088.89**; fade-from-H5 **75,188.51** or H6 **75,251.23** targeting TC **75,007.73** and P **74,926.56** is the highest-probability expiry-day trade. The straddle of **480.95 pts** has already been consumed by the large gap, making straddle sellers scramble to delta-hedge, which reinforces the mean-reversion toward **75,000**.
|
▲ Upside Path → OI-R TC **75,007.73** → H4 **75,032.08** → R1 **75,088.89** → H5 **75,188.51** → PDH/H6 **75,251.23** → R2 **75,413.56** → R3 **75,575.89** → OI-R **76,000**; on expiry day, the PDH **75,251.23** and H6 **75,251.23** confluence is the maximum probable extension for a gap-up scenario, as CE writers at OI-R **76,000** create an impenetrable ceiling without a macro catalyst of extraordinary magnitude. |
▼ Downside Path → OI-S Failure from gap-up: rejection at TC **75,007.73** → P **74,926.56** → BC **74,845.39** → L3 **74,630.30** → S1 **74,601.89** → L4 **74,496.38** → S2 **74,439.56** → OI-S **74,000**; on expiry day, rejection from the max pain zone near TC **75,007.73** is a powerful reversal signal as option sellers flip from supporting price to actively selling, and the bear path toward L3 **74,630.30** can develop rapidly within a 30-minute candle. |
| 🔴 OI-R: OI resistance at **76,000** (CE max OI for weekly expiry on 10 Sep 2026) is **1,235.77 pts** above the previous close — on expiry day, this CE wall is defended by maximum gamma, meaning any approach toward **76,000** would require an extraordinary intraday move of **1.65%** from PDL, making it a structural ceiling that effectively caps all bullish scenarios for the session and ensures CE writers face minimal loss at expiry. | 🟢 OI-S: OI support at **74,000** (PE max OI for weekly expiry) is **764.23 pts** below the previous close — on expiry day, PE writers at **74,000** have maximum incentive to keep price above their strike, creating a strong floor that limits downside and makes **74,000** a critical abort level for bears; if price reaches **74,000** on expiry day, it would represent maximum pain for PE writers and trigger aggressive covering rallies. |
⚡ Key Trigger: Bull trigger: **two consecutive 30-minute closes above TC 75,007.73** confirms CPR breakout and aligns with max pain pull, with immediate targets at H4 **75,032.08**, R1 **75,088.89**, and H5 **75,188.51** on expiry day. Failure to achieve two 30-minute closes above TC **75,007.73** confirms the supply zone is intact and price reverses toward P **74,926.56**, BC **74,845.39**, and L3 **74,630.30** — on expiry day, this failure pattern is especially common as option sellers defend their positions near the max pain strike of **75,000**.
▼ Lower Open (Gap Down) — Open < Prev Close
▼ Bearish
Open lands: For a Descending Wide CPR, a gap-down below prev close (74,764.23) opens SENSEX below the entire CPR band (BC 74,845.39 to TC 75,007.73), placing price in full bearish structural territory on weekly expiry day — the CPR band is overhead resistance, and the proximity of OI-S 74,000 (only 764 pts below) makes gap-down scenarios particularly dangerous for bulls on expiry day.
CPR role: Overhead resistance on expiry day — the CPR band (BC 74,845.39 to TC 75,007.73) acts as supply above the gap-down open, while the weekly max pain at 75,000 creates an upward gravitational pull that may trigger intraday recovery toward the CPR band; the conflict between gap-down bearish momentum and max pain pull creates the day's primary tension.
Minor Gap (0.05–0.25%) — Structure Dominant
A minor gap down of **0.05–0.25%** opens SENSEX between approximately **74,577–74,726**, placing price between S1 **74,601.89** and PDL **74,764.23** — a zone where bears are immediately in control but the expiry-day max pain pull toward **75,000** creates a counterforce that may generate a recovery attempt within the first hour. The Descending Wide CPR's BC at **74,845.39** is the first recovery gate — two 30-minute closes above BC confirm the max pain gravitational pull is winning, while failure at BC keeps the bear path intact targeting L3 **74,630.30** and S1 **74,601.89**. On expiry day, the minor gap down below PDL **74,764.23** is particularly significant because it tests the lower end of the expected weekly straddle range (**74,319**), and option sellers may aggressively defend to prevent further expiry-day losses.
Significant Gap (0.25–0.5%) — Balanced
A significant gap down of **0.25–0.5%** opens SENSEX between approximately **74,388–74,577**, placing price between L5 **74,339.96** and S1 **74,601.89** — a structurally critical zone that breaches L3 **74,630.30** and approaches the weekly straddle lower boundary at approximately **74,319**, creating immediate expiry-day panic. PUT writers at OI-S **74,000** face mounting pressure as price approaches their strike, potentially triggering defensive delta-hedging (buying futures) that creates a short-covering bounce from S2 **74,439.56** or L4 **74,496.38** — this is the most likely expiry-day max pain defense scenario. Failure to recover above L3 **74,630.30** on two 30-minute closes confirms the failure-and-resume thesis with targets at L4 **74,496.38**, S2 **74,439.56**, L5 **74,339.96**, and OI-S **74,000**.
Large Gap (>0.5%) — Gap Direction Dominant
A large gap down of **>0.5%** opens SENSEX below approximately **74,388**, potentially at or below L5 **74,339.96** or L6 **74,277.23** — an expiry-day catastrophic gap that places price within striking distance of the weekly OI support at **74,000** (PE max OI). On expiry day with the PE wall at **74,000**, this scenario creates maximum chaos for both PE sellers (scrambling to buy back puts as the strike is approached) and the broader market (panic triggers from stop-loss cascades below L6 **74,277.23**). The monthly straddle of **1429.0 pts** provides context — a large gap down on weekly expiry day represents extreme volatility that could trigger circuit-breaker conditions if L6 **74,277.23** is broken decisively, and recovery levels to watch are L5 **74,339.96** (first stabilisation), L4 **74,496.38** (recovery signal), and L3 **74,630.30** (structural reclaim).
|
▲ Upside Path → OI-R Max pain recovery path: BC **74,845.39** → H3 **74,898.15** → P **74,926.56** → TC **75,007.73** / Max Pain **75,000** → H4 **75,032.08** → R1 **75,088.89** → OI-R **76,000**; the most likely recovery target on expiry day is the max pain zone near TC **75,007.73** and **75,000**, where option sellers have maximum incentive to pin price — each 30-minute close above a CPR band level is a stronger signal on expiry day than on a regular session. |
▼ Downside Path → OI-S Bear path: PDL **74,764.23** → L3 **74,630.30** → S1 **74,601.89** → L4 **74,496.38** → S2 **74,439.56** → L5 **74,339.96** → L6 **74,277.23** → OI-S **74,000** → S3 **74,114.89**; retail stop-losses below PDL **74,764.23** and L3 **74,630.30** will cascade rapidly on expiry day as delta-hedging from PE writers buying futures may briefly slow the descent near **74,000** but cannot prevent a decisive break if institutional selling overwhelms put-writer defense. |
| 🔴 OI-R: OI resistance at **76,000** (CE max OI for weekly expiry today) is a **1,235.77 pt** ceiling that is essentially a structural cap for the entire session — CE writers at **76,000** are maximally profitable at current price levels and will use any gap-down recovery attempt as an opportunity to add more call shorts, ensuring that OI-R **76,000** functions as a distant but unmovable ceiling that prevents any sustained rally on the expiry day. | 🟢 OI-S: OI support at **74,000** (PE max OI for weekly expiry today) is the most critical level on expiry day — PE writers at **74,000** have maximum incentive to defend this strike as expiry approaches, and any intraday test of **74,000** will trigger aggressive put-buying back (delta hedging) and futures buying that creates a sharp reversal; intraday shorts must reduce positions aggressively as price approaches **74,000** since the reversal from this level can be **200–400 pts** in minutes on expiry day. |
⚡ Key Trigger: Bear confirmation: **failure to reclaim BC 74,845.39 within two 30-minute candles** from the open confirms the Descending Wide CPR is acting as supply and bears have expiry-day control, with targets at L3 **74,630.30**, S1 **74,601.89**, L4 **74,496.38**, S2 **74,439.56**, and OI-S **74,000**. Bull recovery trigger: **two consecutive 30-minute closes above BC 74,845.39** signals max pain gravitational pull is dominant and price is recovering toward P **74,926.56**, TC **75,007.73**, and the max pain strike of **75,000** — this is the only trigger that transforms a gap-down day into an expiry-day max pain recovery.
◆ Near Flat Open — Open ≈ Prev Close (±0.05%)
◆ Neutral
Open lands: A ±0.05% flat open places SENSEX between approximately **74,727–74,801**, which is below BC **74,845.39** and below the entire CPR band — for a Descending Wide CPR on weekly expiry day, this is the maximum-tension flat-open scenario where price sits below the supply CPR band but with the max pain gravitational pull toward 75,000 creating an upward bias throughout the session.
CPR role: Decision zone with expiry-day max pain tension — price opens just below BC **74,845.39** with the CPR band (BC **74,845.39** to TC **75,007.73**) as overhead supply, but the weekly max pain at **75,000** (near TC **75,007.73**) creates a gravitational pull that makes the CPR band simultaneously a resistance zone and a target for expiry-day pinning behavior.
Near Flat (±0.05%)
A flat open below BC **74,845.39** on weekly expiry day is arguably the most information-rich setup of all three scenario types — the tension between the Descending Wide CPR's bearish structure and the max pain pull toward **75,000** creates a high-volatility, direction-uncertain session where the first 30-minute candle is the most important candle of the day. The BC at **74,845.39** is the first structural gate and expiry-day behavior will be dominated by option sellers and delta-hedgers who have incentive to push price toward **75,000** (max pain) — a flat open that quietly drifts above BC **74,845.39** on the first 30-minute close is a strong signal that max pain mechanics are in play. The Wide CPR (0.22%) creates internal friction between BC **74,845.39** and TC **75,007.73** — this 162-point band is the expiry day's primary battleground, and price oscillation within this zone is the most likely scenario, with option sellers on both sides working to pin price near **75,000**. Bull trigger: **two consecutive 30-minute closes above TC 75,007.73** targeting H4 **75,032.08**, R1 **75,088.89**, and H5 **75,188.51** with max pain gravitational pull as a tailwind; bear trigger: **two consecutive 30-minute closes below BC 74,845.39** targeting L3 **74,630.30**, S1 **74,601.89**, L4 **74,496.38**, and OI-S **74,000** — on expiry day, the bear trigger carries higher risk than usual because PE writers at **74,000** will defend aggressively, potentially creating violent reversals from any approach to the OI-S zone.
|
▲ Upside Path → OI-R BC **74,845.39** → H3 **74,898.15** → P **74,926.56** → TC **75,007.73** / Max Pain **75,000** → H4 **75,032.08** → R1 **75,088.89** → H5 **75,188.51** → PDH/H6 **75,251.23** → OI-R **76,000**; the TC **75,007.73** and max pain **75,000** zone is the primary upside target for a flat-open expiry day, with H4 **75,032.08** and R1 **75,088.89** being the secondary targets that only activate if option pinning at **75,000** fails to hold. |
▼ Downside Path → OI-S BC **74,845.39** → L3 **74,630.30** → S1 **74,601.89** → L4 **74,496.38** → S2 **74,439.56** → L5 **74,339.96** → L6 **74,277.23** → OI-S **74,000**; the breach of L3 **74,630.30** on a 30-minute close is the session's most dangerous bearish signal on expiry day — it signals max pain mechanics have failed and institutional selling is overwhelming PE writer defense, potentially creating a rapid cascade toward the **74,000** OI support wall. |
| 🔴 OI-R: OI resistance at **76,000** (CE max OI for weekly expiry today, 10 Sep 2026) is a **1,235.77 pt** ceiling that ensures CE writers are in maximum profit at current price — in a flat-open expiry day scenario, the CE wall at **76,000** acts as a structural cap that makes any rally beyond R3 **75,575.89** essentially impossible without a macro shock, and CE writers will actively sell any approach to R2 **75,413.56** or beyond to protect their expiry-day profits. | 🟢 OI-S: OI support at **74,000** (PE max OI for weekly expiry today) is the session's most important defensive level — PE writers at **74,000** have maximum gamma exposure on expiry day and will aggressively buy futures and close puts near this strike to limit their delta exposure, creating a powerful reversal zone; in a flat-open scenario, the **74,000** level is a medium-probability intraday target only if BC **74,845.39** fails, and traders should treat any approach to **74,000** as a potential reversal point rather than a breakout level on weekly expiry day. |
⚡ Key Trigger: Bull trigger: **two consecutive 30-minute closes above TC 75,007.73** on above-average volume confirms max pain gravitational pull and CPR breakout, with targets at H4 **75,032.08**, R1 **75,088.89**, H5 **75,188.51**, and the PDH/H6 confluence at **75,251.23**. Bear trigger: **two consecutive 30-minute closes below BC 74,845.39** confirms the Descending CPR supply zone is dominant over the max pain pull, shifting the session into a bearish expiry day targeting L3 **74,630.30**, S1 **74,601.89**, and ultimately OI-S **74,000** — BC **74,845.39** is the structural fulcrum because it represents both the CPR's lower boundary and the pivot below which max pain pinning becomes structurally impossible for the session.
📊 VIX Insight: India VIX data is unavailable for the 09 Sep 2026 session, which creates uncertainty in premium sizing and expected move calibration — traders should rely on straddle pricing as the primary implied volatility proxy, with NIFTY weekly straddle at **249.6 pts** (1.06% of ATM) and SENSEX weekly straddle at **480.95 pts** (0.64% of ATM) suggesting the market is pricing in above-normal daily volatility; the absence of VIX data means risk management should be conservatively sized, with stop-losses placed at the nearest Camarilla or Traditional pivot level rather than VIX-derived ATR multiples.
Overall View:
All three indices — NIFTY (**23,431.50**), BANKNIFTY (**56,295.55**), and SENSEX (**74,764.23**) — closed sharply lower on 09 Sep 2026 and carry identical Descending Wide CPR structures for 10 Sep 2026, creating a uniformly bearish opening bias where the CPR bands act as overhead supply and bears have structural advantage from the first minute. The critical OI dynamics for 10 Sep 2026 are: NIFTY's OI-S at **23,000** (431.5 pts below close), BANKNIFTY's OI-S at **56,000** (295.55 pts below close — critically close), and SENSEX's weekly OI-S at **74,000** (764.23 pts below close on expiry day), all of which represent the ultimate downside targets if Descending CPR bearish momentum continues unabated. SENSEX deserves special attention as today (10 Sep 2026) is its weekly expiry day with max pain at **75,000** — a **235.77 pt** recovery from the close — creating a powerful gravitational pull that could override the bearish CPR structure and produce an expiry-day recovery, making SENSEX the most strategically complex index for intraday traders today.
All three indices — NIFTY (**23,431.50**), BANKNIFTY (**56,295.55**), and SENSEX (**74,764.23**) — closed sharply lower on 09 Sep 2026 and carry identical Descending Wide CPR structures for 10 Sep 2026, creating a uniformly bearish opening bias where the CPR bands act as overhead supply and bears have structural advantage from the first minute. The critical OI dynamics for 10 Sep 2026 are: NIFTY's OI-S at **23,000** (431.5 pts below close), BANKNIFTY's OI-S at **56,000** (295.55 pts below close — critically close), and SENSEX's weekly OI-S at **74,000** (764.23 pts below close on expiry day), all of which represent the ultimate downside targets if Descending CPR bearish momentum continues unabated. SENSEX deserves special attention as today (10 Sep 2026) is its weekly expiry day with max pain at **75,000** — a **235.77 pt** recovery from the close — creating a powerful gravitational pull that could override the bearish CPR structure and produce an expiry-day recovery, making SENSEX the most strategically complex index for intraday traders today.
Disclaimer: KRV Prime provides educational and informational content relating to financial markets. Articles, research, examples, charts, strategies and tools are provided for educational purposes and should not be interpreted as personalised investment advice or a guarantee of financial performance. Markets involve risk, including possible loss of capital. Past performance does not guarantee future results. KRV Prime is not a SEBI Registered Investment Adviser or Research Analyst.