
Index Analysis
Intraday Analysis for 11 Sep 2026
KRV Prime16 September 202655 min
Educational/Derived AnalysisSource: KRV Prime Market Insights (End-of-Day)As of 16 Sep 2026, 03:12 PM IST
Intraday Analysis for 11 Sep 2026
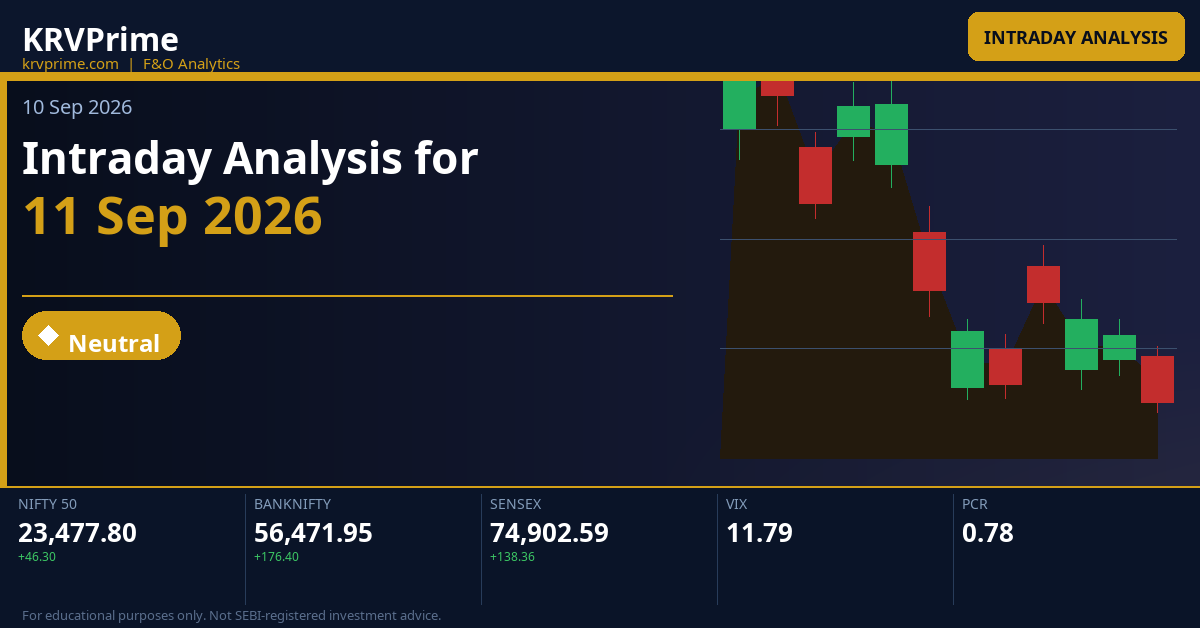
Markets closed marginally higher on 10 Sep 2026 with NIFTY at 23,477.80 (+0.20%), BANKNIFTY at 56,471.95 (+0.31%), and SENSEX at 74,902.59 (+0.19%), reflecting a tentative but slightly positive undertone heading into 11 Sep 2026. India VIX data is unavailable for this session, which limits precise premium-decay and directional-conviction reads, but the narrow straddle on NIFTY weekly (203.5 pts) suggests the options market is pricing a contained move of roughly ±0.87% for the expiry cycle, implying a tight intraday range unless a macro catalyst emerges. Traders should note that all three indices remain well below their respective weekly CPR bands — NIFTY weekly P at 23,942.55, BANKNIFTY weekly P at 57,405.93, SENSEX weekly P at 76,627.67 — which structurally keeps the intermediate bias tilted bearish unless reclamation of those levels occurs.
Key Market Signals — Intraday Setup
All three indices are trading significantly below their weekly CPR pivot levels (NIFTY weekly P 23,942.55, BANKNIFTY weekly P 57,405.93, SENSEX weekly P 76,627.67), confirming a multi-session bearish structure, while NIFTY's OI wall at 24,000 CE and BANKNIFTY's monthly max pain of 57,500 together reinforce overhead resistance that will require substantial buying conviction to breach on 11 Sep 2026.
Deep Technical Analysis & Levels
NIFTY
Overlapping — Medium (Width 0.11%)
◆ Neutral
Market Structure Balanced or transitional | Straddle NIFTY Weekly ATM 23,500 straddle priced at 203.5 pts (Call 78.4 + Put 125.1), implying an expected move of approximately ±203.5 pts from 23,500, defining a range of roughly 23,296 to 23,703 for the weekly expiry on 15 Sep 2026. The higher Put LTP (125.1) vs Call LTP (78.4) signals that market participants are paying more for downside protection, reflecting a mild bearish skew. The monthly straddle at 23,500 is priced at 448.0 pts, indicating far wider uncertainty over the 29 Sep 2026 expiry and supporting a broader range-bound framework for positional traders. | Max Pain NIFTY Weekly Max Pain is at 23,500, which is just 22.2 pts above yesterday's close of 23,477.80, suggesting option sellers are positioned for expiry near current levels. This proximity to max pain implies that CE writers will defend 23,500 aggressively and any sustained move above this level could trigger a short-covering cascade, while a sustained move below 23,400 would pressure PE writers. Monthly Max Pain at 24,000 — far above current price — implies significant CE writing at that level and reinforces it as the primary OI-R ceiling for the September series. |
Tomorrow's Complete Level Map
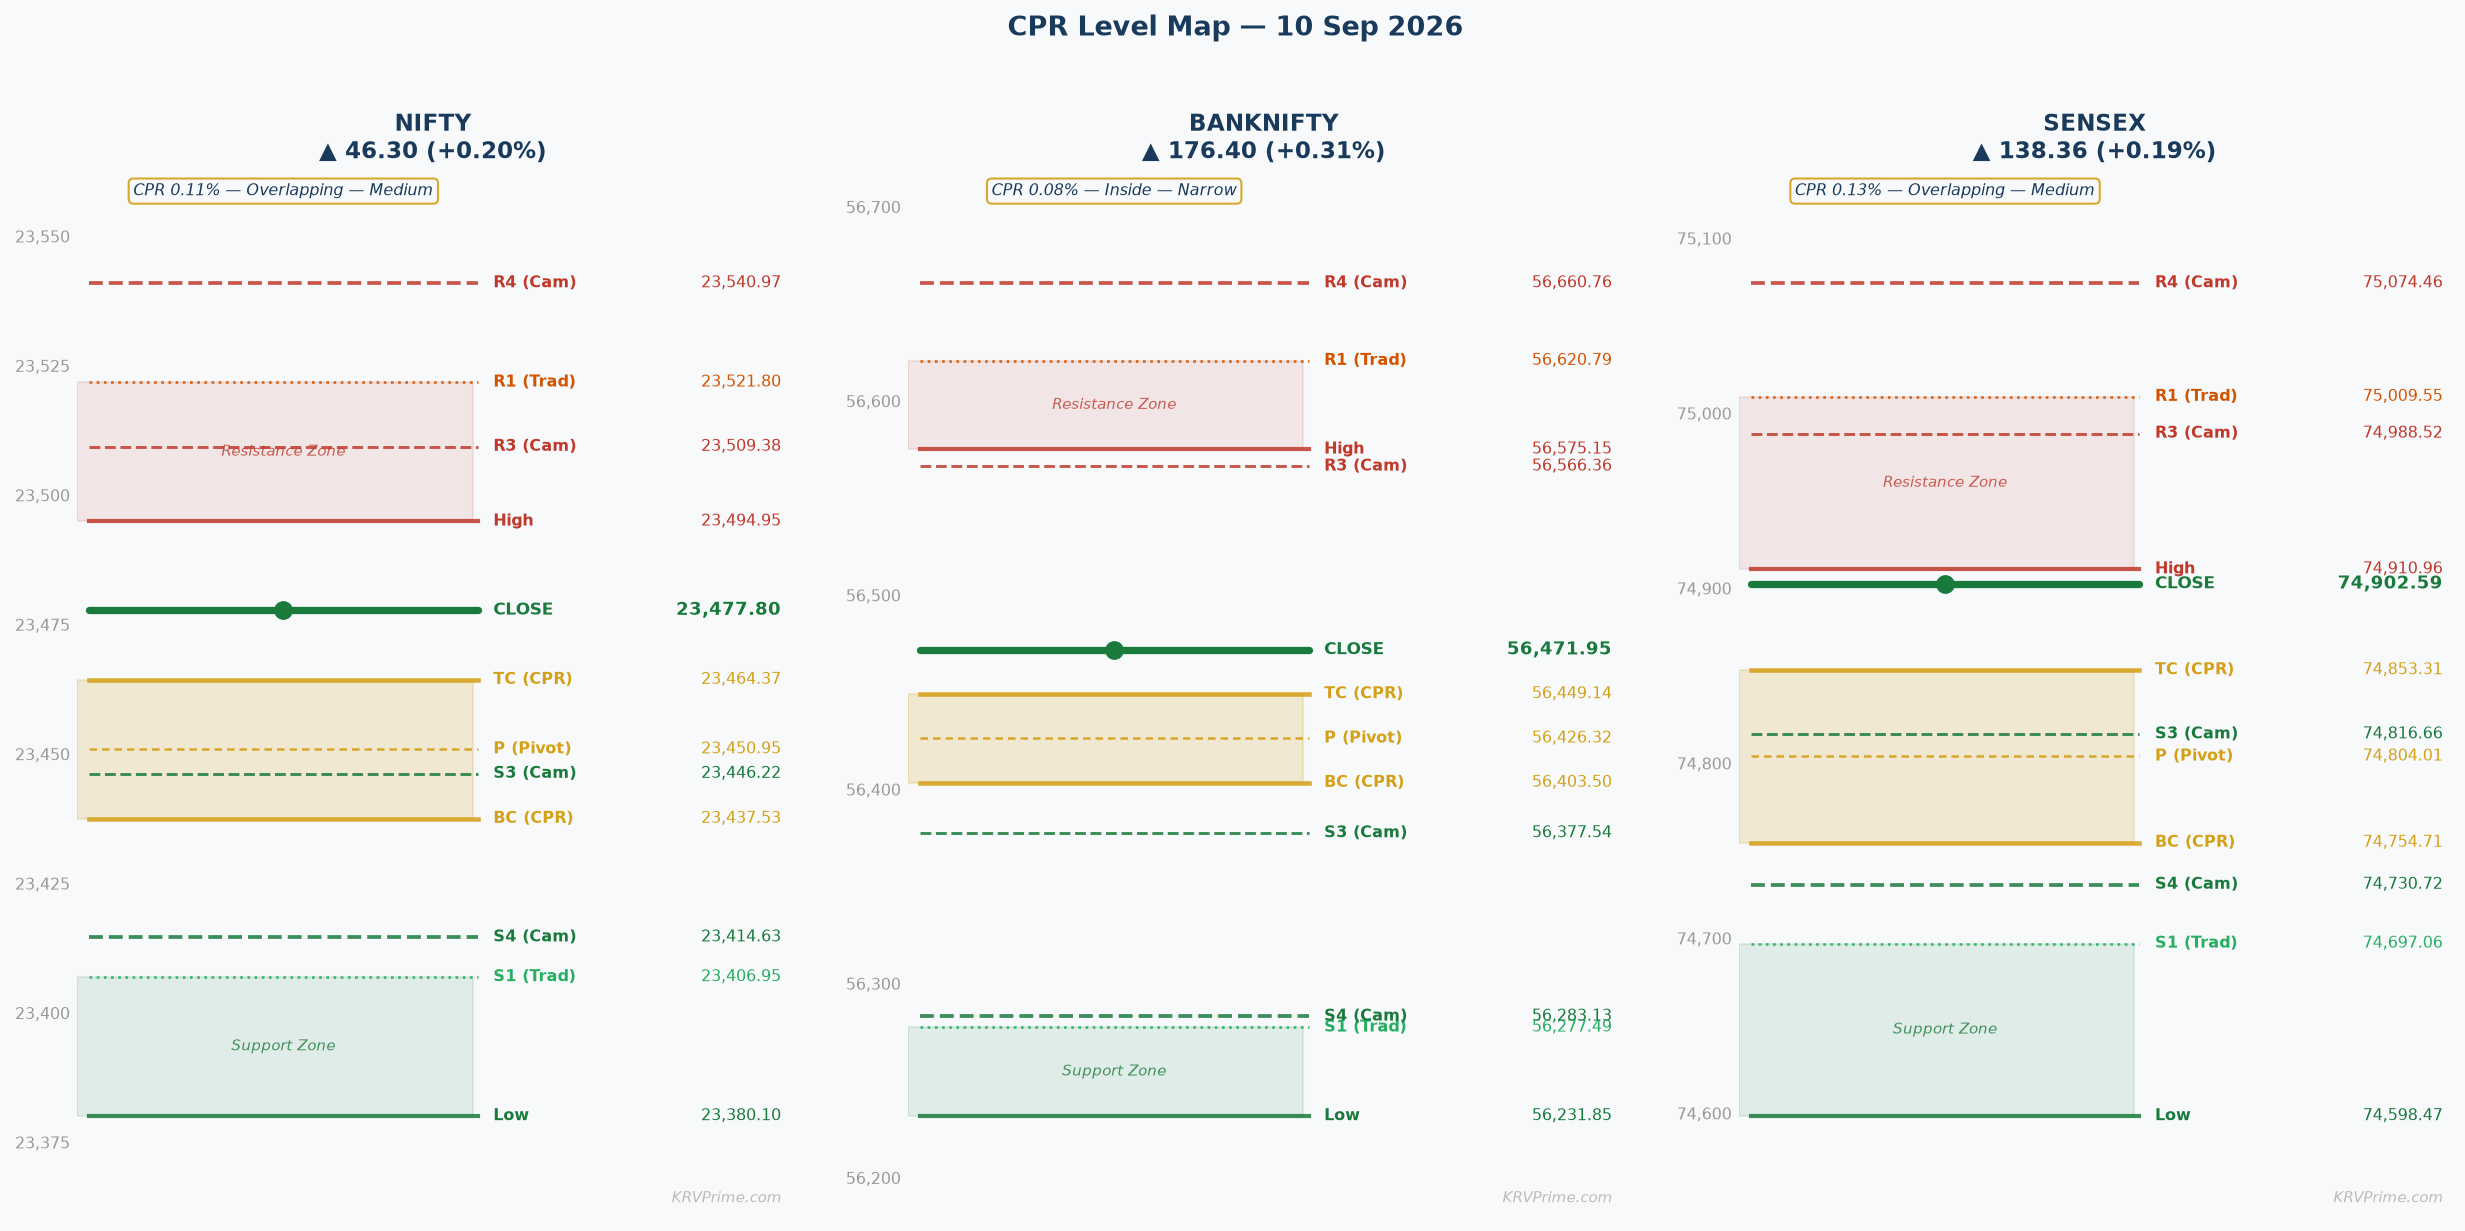
OI-R: 24,000 R3: 23,636.65 H6: 23,593.13 H5: 23,577.87 R2: 23,565.80 H4 ▶: 23,540.97 R1: 23,521.80 PDH: 23,494.95 H3 ↩: 23,509.38
TC: 23,464.37 P: 23,450.95 BC: 23,437.53
L3 ↩: 23,446.22 PDL: 23,380.10 S1: 23,406.95 L4 ▶: 23,414.63 S2: 23,336.10 L5: 23,377.73 L6: 23,362.47 S3: 23,292.10 OI-S: 23,000
↩ = Camarilla reversal point | ▶ = Camarilla breakout/breakdown trigger | OI-R/OI-S = Options wall (CE/PE max OI)
▲ Higher Open (Gap Up) — Open > Prev Close
▲ Bullish
Open lands: With an Overlapping Medium CPR where TC is 23,464.37 and the prev close is 23,477.80, the prev close is already above TC. A gap-up open on 11 Sep 2026 will push price further above TC into the 23,490–23,520 zone for a minor gap, or above PDH of 23,494.95 for a significant gap, placing price squarely inside the Camarilla H3 (23,509.38) zone. Since the CPR is overlapping and price is already above TC at yesterday's close, any positive gap reinforces the bullish side of the CPR band.
CPR role: Launch pad and support zone — the CPR band (BC 23,437.53 to TC 23,464.37) transitions to a support floor for gap-up opens, providing a base from which bulls can defend intraday dips. A gap-up open above TC confirms the CPR as a demand zone below.
Minor Gap (0.05–0.25%) — Structure Dominant
A minor gap up of 0.05–0.25% would open NIFTY in the range of approximately 23,490–23,536, placing price above TC (23,464.37) and near PDH (23,494.95) — a structurally bullish location for an Overlapping Medium CPR where the close is already above TC. The Medium CPR width (0.11%) adds confirmation to the directional lean rather than creating conflict, as the 30-min close rule applies: traders should wait for the first 30-minute candle to close above PDH (23,494.95) and H3 (23,509.38) before initiating fresh longs, since a minor gap without immediate follow-through often leads to a retest of the CPR band. The specific first target on upside confirmation is R1 at 23,521.80, followed by H4 at 23,540.97, with confirmation from 30-min close above H3 (23,509.38); on the downside, failure to hold TC (23,464.37) negates the gap-up thesis and targets L3 (23,446.22) and BC (23,437.53).
Significant Gap (0.25–0.5%) — Balanced
A significant gap up of 0.25–0.5% would open NIFTY in the range of approximately 23,537–23,595, placing price between H4 (23,540.97) and H6 (23,593.13) — into the Camarilla upper breakout zone, above PDH (23,494.95) and R1 (23,521.80). The gap-fill risk is elevated here since price opens into a dense resistance cluster of H4 (23,540.97), R2 (23,565.80), and H5 (23,577.87) all within a narrow 37-point band; delta-hedging by CE writers at the 23,500 max pain strike would add selling pressure, making a clean breakout harder and increasing the probability of a gap-fill back toward PDH (23,494.95) and CPR TC (23,464.37) within the first 30–45 minutes. If the 30-minute candle closes above H4 (23,540.97), the next target is R2 (23,565.80) then H5 (23,577.87), but below these levels, expect mean reversion toward TC (23,464.37).
Large Gap (>0.5%) — Gap Direction Dominant
A large gap up of greater than 0.5% would open NIFTY above 23,595, potentially above H6 (23,593.13) and R3 (23,636.65), entering extreme Camarilla territory where mean-reversion probability is high. At this level, price is opening into the weekly Camarilla H3 zone (23,995.70) is still far away, but the immediate resistance cluster at R3 (23,636.65) and the deeply-entrenched OI wall at 24,000 would cap any extension, and without VIX confirmation, the probability of a gap-fill back toward H3 (23,509.38) and even PDH (23,494.95) is significant. The abort level for gap-up longs is a 30-min close below H3 (23,509.38), and the NIFTY weekly straddle of 203.5 pts limits the realistic upside expectation; the primary target on extension is R3 (23,636.65) only if two consecutive 30-min candles close above H5 (23,577.87).
|
▲ Upside Path → OI-R The upside path from a confirmed gap-up break runs H3 (23,509.38) → R1 (23,521.80) → H4 (23,540.97) → R2 (23,565.80) → H5 (23,577.87), with each level requiring volume confirmation and a sustained candle close above it; the final ceiling is the OI-R at 24,000, which remains structurally distant but is the primary CE writing wall that option sellers will defend aggressively. Above H5 (23,577.87) and R3 (23,636.65), buying momentum would need to be exceptional to challenge the 24,000 OI-R, and any move into that territory would represent a genuine breakout requiring institutional participation and expansion in delivery volumes. |
▼ Downside Path → OI-S If the gap-up fails and price cannot sustain above TC (23,464.37) after the first 30-minute candle, the downside path is TC (23,464.37) → P (23,450.95) → BC (23,437.53) → L3 (23,446.22) → S1 (23,406.95) → L4 (23,414.63) → PDL (23,380.10) → L5 (23,377.73), with the failed gap-up acting as a catalyst for trapped longs unwinding. A sustained loss of BC (23,437.53) on a 30-min candle close opens the path toward S2 (23,336.10) and eventually the OI-S at 23,000, which represents the primary PE writing support wall and the zone where institutional put writers would defend strongly. |
| 🔴 OI-R: The OI-R at 24,000 is the dominant ceiling for this session and represents the strike where maximum CE open interest has accumulated, meaning CE writers (typically institutions) have sold 24,000 calls aggressively and will deploy delta-hedging selling pressure whenever NIFTY approaches that level. In the context of a gap-up session, the 24,000 OI wall is unlikely to be tested intraday given the straddle range of 203.5 pts from 23,500, but it defines the absolute ceiling for any positional bull thesis in the September weekly cycle. | 🟢 OI-S: The OI-S at 23,000 is the primary PE writing floor, representing the strike where put writers have maximum open interest and where institutional PE sellers will aggressively defend against a breach. In a gap-up scenario, the OI-S at 23,000 is deeply out of range (approximately 477 pts below close) and serves primarily as the ultimate abort level for multi-day bearish positions rather than an intraday target; however, its presence anchors the weekly range lower boundary and provides context that market makers expect the index to stay comfortably above this level through expiry. |
⚡ Key Trigger: The key trigger for the gap-up scenario is a first 30-minute candle close above PDH (23,494.95) combined with sustained hold above H3 (23,509.38), which confirms that buying pressure has absorbed the previous day's supply and that the CPR band below (TC 23,464.37) is now acting as firm support. Failure of this trigger — specifically a 30-min candle that reverses and closes below TC (23,464.37) — signals a trap-door event where the gap up is a bull trap, rapidly shifting the day's structure to bearish with L3 (23,446.22) as the first downside target.
▼ Lower Open (Gap Down) — Open < Prev Close
▼ Bearish
Open lands: With prev close at 23,477.80 and TC at 23,464.37, a gap-down open will push price below TC and into or below the CPR band. A minor gap down opens price into the BC-to-TC range (23,437.53–23,464.37), placing it inside the CPR band as a decision zone. A significant gap down opens below BC (23,437.53) and potentially near L3 (23,446.22) or S1 (23,406.95), while a large gap down could breach PDL (23,380.10) and test L5 (23,377.73).
CPR role: Overhead resistance — when price opens below TC (23,464.37) after a gap down, the entire CPR band (BC 23,437.53 to TC 23,464.37) becomes a resistance zone that bears will defend and bulls must reclaim to neutralize the bearish gap structure.
Minor Gap (0.05–0.25%) — Structure Dominant
A minor gap down of 0.05–0.25% would open NIFTY between approximately 23,419–23,466, placing price inside the CPR band (BC 23,437.53 to TC 23,464.37) or just below BC, creating a high-information decision setup for the opening 30 minutes. The Medium CPR width (0.11%) combined with an Overlapping structure means the CPR band acts as a battleground: bulls need a 30-min candle close back above TC (23,464.37) to neutralize the gap, while bears need to sustain below BC (23,437.53) to confirm bearish control and target L3 (23,446.22). Minor gaps inside the CPR band often fill within 60 minutes in a balanced market structure, so the first 30-minute candle direction is decisive — specifically, a close above TC (23,464.37) targets P (23,450.95) recovery path toward PDH (23,494.95), while a close below BC (23,437.53) targets L4 (23,414.63) and S1 (23,406.95).
Significant Gap (0.25–0.5%) — Balanced
A significant gap down of 0.25–0.5% would open NIFTY between approximately 23,361–23,419, placing price below BC (23,437.53) and the entire CPR band, near S1 (23,406.95) and L4 (23,414.63), and close to PDL (23,380.10) — a structurally bearish location that validates the gap-down momentum. The 30-minute reclaim rule applies: if price fails to recover above BC (23,437.53) within the first 30 minutes, the failure-and-resume bearish pattern triggers with L3 (23,446.22) becoming overhead resistance and L4 (23,414.63) → S1 (23,406.95) → PDL (23,380.10) → L5 (23,377.73) as the cascade targets; PE OI buildup at 23,000 strike means put writers will start squaring positions below L5 (23,377.73), amplifying velocity. A recovery above BC (23,437.53) within 30 minutes opens a gap-fill attempt toward TC (23,464.37), though the CPR band would act as overhead resistance requiring two 30-min closes above TC to confirm genuine recovery.
Large Gap (>0.5%) — Gap Direction Dominant
A large gap down of greater than 0.5% would open NIFTY below 23,360, breaching PDL (23,380.10), L5 (23,377.73), and L6 (23,362.47) simultaneously — a major support cluster breakdown that signals panic or a significant overnight negative catalyst. In this scenario, VIX (unavailable today) would presumably spike, PUT premiums would expand, and the primary straddle monetisation opportunity is in selling OTM calls above TC (23,464.37) since the weekly straddle of 203.5 pts from 23,500 already prices the downside exhaustion zone near 23,296. Specific recovery levels to watch are L5 (23,377.73) and PDL (23,380.10) — a 30-min close above these levels is the first sign of stabilization; however, sustained trading below L6 (23,362.47) opens a swift move toward S2 (23,336.10) and S3 (23,292.10), uncomfortably close to the OI-S at 23,000.
|
▲ Upside Path → OI-R The recovery path for a gap-down session runs BC (23,437.53) → P (23,450.95) → TC (23,464.37) → PDH (23,494.95) → H3 (23,509.38) → R1 (23,521.80), with each level requiring a 30-min candle close above it to confirm genuine demand rather than a temporary short-covering bounce. A full gap-fill recovery above PDH (23,494.95) would represent a significant bullish reversal and require above-average buying volume in the cash market, with the OI-R at 24,000 remaining the ultimate ceiling for any extended recovery. |
▼ Downside Path → OI-S The downside continuation path from a failed recovery runs L3 (23,446.22) → L4 (23,414.63) → S1 (23,406.95) → PDL (23,380.10) → L5 (23,377.73) → L6 (23,362.47) → S2 (23,336.10) → S3 (23,292.10), with retail stop-losses accumulating below PDL (23,380.10) and L5 (23,377.73) likely to accelerate the move once those levels are breached on volume. The OI-S at 23,000 is the ultimate downside magnet and PE monetisation zone where put writers would face maximum pressure, triggering a technical bounce unless fundamental selling continues. |
| 🔴 OI-R: The OI-R at 24,000 in a gap-down scenario represents a deeply overhead ceiling guarded by CE writers who are comfortably in profit and will not be forced to cover in a down session, meaning the short side faces no gamma-driven headwinds from options writers on the upside. This makes the OI-R at 24,000 effectively irrelevant as an intraday target in a gap-down, but confirms that institutional shorts are structurally positioned from high strikes and any recovery attempt will face increasing selling from CE writers as price approaches that ceiling. | 🟢 OI-S: The OI-S at 23,000 is the primary PUT writing floor and the key bear target in a significant or large gap-down session; PE writers who have sold 23,000 puts will defend this level aggressively by buying futures or closing put positions as price approaches, creating a natural demand zone. However, if the gap-down is driven by a macro event and price decisively breaches 23,100–23,000, the PUT writing support collapses rapidly as writers are forced to hedge, converting the OI-S from a support floor to a trap-door catalyst. |
⚡ Key Trigger: The key trigger for the gap-down scenario is whether NIFTY can reclaim and sustain above BC (23,437.53) within the first 30 minutes of trade — a 30-min candle close above BC confirms recovery potential and targets TC (23,464.37) and PDH (23,494.95) for gap fill. Failure to reclaim BC (23,437.53) within the first 30 minutes and a sustained close below L3 (23,446.22) confirms bearish resumption, targeting L4 (23,414.63) → S1 (23,406.95) → PDL (23,380.10) with stop for short positions above TC (23,464.37).
◆ Near Flat Open — Open ≈ Prev Close (±0.05%)
◆ Neutral
Open lands: A flat open within ±0.05% of prev close (23,477.80) would place NIFTY in the range of approximately 23,466–23,490, which is above TC (23,464.37) since the prev close already sits above TC. This means a flat open lands just above the CPR band, making the CPR (BC 23,437.53 to TC 23,464.37) an immediate support floor below the opening price.
CPR role: Decision zone and support floor — the CPR band sits just below the flat open, and the first 30-minute candle determines whether the band holds as support (bullish) or gets breached as the market gravitates back through TC (23,464.37) toward BC (23,437.53) (bearish transition).
Near Flat (±0.05%)
A flat open in a Medium Overlapping CPR (0.11% width) where price is already above TC (23,464.37) is an extremely high-information setup: the CPR band immediately below acts as a support test zone, and the first 30-minute candle tells traders whether institutional intent is to push higher or fade back into the band. Specifically, TC at 23,464.37 is the critical bull-bear line: a 30-min candle that sustains above TC (23,464.37) with the open near 23,478 confirms the CPR as support and targets H3 (23,509.38) → PDH (23,494.95) → R1 (23,521.80) on the upside, while a break and 30-min close below TC (23,464.37) shifts the band from support to resistance and targets P (23,450.95) → BC (23,437.53) → L3 (23,446.22). At 0.11% width — technically at the upper boundary of Narrow and the lower boundary of Medium — this CPR has a meaningful trend-day probability of approximately 60–65% once the first 30-min direction is established, because a flat open in a compact band forces a resolution; both bulls and bears know the same key levels, meaning the breakout or breakdown is typically swift and committed. The bull trigger is a first 30-min candle close above PDH (23,494.95) after holding TC (23,464.37) as support, and the bear trigger is a 30-min candle close below BC (23,437.53) with L3 (23,446.22) as the confirming reference — each trigger, once confirmed, has high follow-through given the balanced market structure transitioning into a directional session.
|
▲ Upside Path → OI-R Confirmed bull path from flat open: TC (23,464.37) support hold → H3 (23,509.38) as first Camarilla resistance → PDH (23,494.95) tested and broken → R1 (23,521.80) as Traditional first target → H4 (23,540.97) as breakout trigger → R2 (23,565.80) as second Traditional target, with the ultimate session ceiling being the OI-R at 24,000 which remains the structural CE wall for the September cycle. Volume expansion above H3 (23,509.38) and PDH (23,494.95) is the key confirmation that the flat-open trend day is developing to the upside, and partial profits should be taken at R1 (23,521.80) per Medium CPR confirmation rules. |
▼ Downside Path → OI-S Confirmed bear path from flat open: TC (23,464.37) fails → P (23,450.95) tested → BC (23,437.53) broken on 30-min close → L3 (23,446.22) as first Camarilla mean-reversion support → L4 (23,414.63) as breakdown trigger → S1 (23,406.95) → PDL (23,380.10) → L5 (23,377.73), with the ultimate downside target being the OI-S at 23,000 where PE writers will mount their strongest defense. Retail stop-losses typically cluster below PDL (23,380.10) and L5 (23,377.73), meaning a breach of those levels with volume would accelerate the move toward S2 (23,336.10) and S3 (23,292.10). |
| 🔴 OI-R: The OI-R at 24,000 in a flat-open scenario is a distant but structurally dominant ceiling approximately 522 pts above the opening price, making it irrelevant as an immediate intraday target but crucial as the boundary that CE writers are defending — meaning any institutional selling flow will be triggered well before 24,000, specifically at H5 (23,577.87), H6 (23,593.13), and R3 (23,636.65) as proxy resistance zones. CE writers at 24,000 will be selling futures or calls on any rally above 23,550, creating a structural headwind that limits the upside of any flat-open bull trend day to the R2 (23,565.80)–R3 (23,636.65) zone. | 🟢 OI-S: The OI-S at 23,000 in a flat-open scenario functions as the absolute floor and PE writing anchor, approximately 478 pts below the open, which means PE writers are comfortably positioned and will not face margin pressure unless price approaches 23,100–23,050; this PE support base prevents panic selling on minor dips and creates a natural buy-the-dip mentality in the 23,200–23,100 zone. In the event of a bear trend day from flat open, the OI-S at 23,000 becomes the ultimate target where straddle sellers and put writers would aggressively cover, creating a sharp reversal zone that traders should treat as a profit-booking level rather than a continuation signal. |
⚡ Key Trigger: The exact trigger for the bull side is a first 30-minute candle close above PDH (23,494.95) after the open holds TC (23,464.37) as support, which signals that the CPR band is acting as a confirmed launch pad and that H3 (23,509.38) is the next immediate target; a failed hold of TC (23,464.37) at any point in the first 30 minutes and a close below BC (23,437.53) is the bear trigger, activating the downside path toward L3 (23,446.22) and S1 (23,406.95). The structural fulcrum at TC (23,464.37) is critical because it is the mathematical midpoint between the CPR band and the previous session close, meaning that market psychology is exactly balanced at this price — any decisive close on either side of this level reveals the dominant participant for the session.
BANKNIFTY
Inside — Narrow (Width 0.08%)
▲ Bullish
Market Structure Trending (up or down trend) | Straddle BANKNIFTY Monthly ATM 56,500 straddle priced at 1,265.0 pts (Call 685.0 + Put 580.0), implying a monthly expected move of approximately ±1,265 pts from 56,500, defining a range of roughly 55,235 to 57,765 for the 29 Sep 2026 expiry. The higher Call LTP (685.0) vs Put LTP (580.0) signals mild bullish skew — options participants are paying slightly more for upside protection, consistent with the Inside CPR compression-energy setup suggesting a directional breakout is imminent. The asymmetry in the straddle also suggests that market makers expect the breakout from the Inside CPR to be biased upward, aligning with the monthly max pain at 57,500. | Max Pain BANKNIFTY Monthly Max Pain is at 57,500, approximately 1,028 pts above yesterday's close of 56,471.95, suggesting that option sellers collectively benefit from expiry near 57,500 and will structurally support the index through put writing and hedging flows as the month progresses. This max pain pull creates a gravitational upside bias for the remainder of September, making short-side trades against BANKNIFTY riskier than they appear technically, and reinforces that dips toward 56,000–55,500 may be absorbed by institutional put writers. |
Tomorrow's Complete Level Map
OI-R: 57,500 R3: 56,964.09 H6: 56,816.72 H5: 56,771.02 R2: 56,769.62 H4 ▶: 56,660.76 R1: 56,620.79 PDH: 56,575.15 H3 ↩: 56,566.36
TC: 56,449.14 P: 56,426.32 BC: 56,403.50
L3 ↩: 56,377.54 PDL: 56,231.85 S1: 56,277.49 L4 ▶: 56,283.13 S2: 56,083.02 L5: 56,172.86 L6: 56,127.18 S3: 55,934.19 OI-S: 54,000
↩ = Camarilla reversal point | ▶ = Camarilla breakout/breakdown trigger | OI-R/OI-S = Options wall (CE/PE max OI)
▲ Higher Open (Gap Up) — Open > Prev Close
▲ Bullish
Open lands: With prev close at 56,471.95 and TC at 56,449.14, prev close is already above TC. The BANKNIFTY CPR is Inside — Narrow (0.08%), meaning any gap up that opens above TC (56,449.14) constitutes a DOUBLE compression release upward. A minor gap up opens price above TC and potentially near PDH (56,575.15); a significant gap up opens above PDH into H3 (56,566.36)–H4 (56,660.76) territory; a large gap up could open above H4 (56,660.76) and toward R1 (56,620.79).
CPR role: Launch pad — the Inside Narrow CPR (BC 56,403.50 to TC 56,449.14) acts as a high-energy launch pad. Since price closed above TC on 10 Sep, any gap-up open confirms the double compression release and the CPR transitions to a strong support floor.
Minor Gap (0.05–0.25%) — Structure Dominant
A minor gap up of 0.05–0.25% would open BANKNIFTY between approximately 56,500–56,613, placing price above TC (56,449.14) and the entire Inside CPR band — this is the classic double compression release signal for a Narrow Inside CPR where the first 15-minute candle in the direction of the gap typically sets the session's trend with high probability. The Inside Narrow CPR at 0.08% width activates the highest-confidence trending-day setup: per the Narrow confirmation rule, traders should use the first 15-minute candle close above PDH (56,575.15) as the bull trigger and immediately target H3 (56,566.36) → R1 (56,620.79), taking a partial at R1 and trailing to the Camarilla H4 (56,660.76) zone. Any failure to hold TC (56,449.14) after the initial gap-up probe would be the only bearish signal, but given the Inside CPR double-release structure and the monthly max pain pull toward 57,500, the probability strongly favors upside follow-through on a minor gap up.
Significant Gap (0.25–0.5%) — Balanced
A significant gap up of 0.25–0.5% would open BANKNIFTY between approximately 56,613–56,754, placing price above PDH (56,575.15) and directly into the H3 (56,566.36)–H4 (56,660.76) Camarilla breakout zone — this is simultaneously an aggressive entry zone and a gap-fill risk area, because the Inside Narrow CPR's double-release energy is strong but opening directly into a dense resistance cluster of H3 (56,566.36), PDH (56,575.15), and R1 (56,620.79) within 59 points creates chop risk. Delta-hedging by CE writers at 57,500 (the monthly OI-R and max pain) will not be triggered at this level, so the path from H3 (56,566.36) to H4 (56,660.76) is relatively clear; traders should use the first 15-min candle for confirmation — a close above H4 (56,660.76) after opening above PDH (56,575.15) confirms breakout momentum with R1 (56,620.79) as immediate partial and R2 (56,769.62) as the next target. Gap-fill back toward TC (56,449.14) is the abort scenario requiring sustained price below PDH (56,575.15) for 30 minutes.
Large Gap (>0.5%) — Gap Direction Dominant
A large gap up of greater than 0.5% would open BANKNIFTY above 56,754, potentially into the H4 (56,660.76)–H5 (56,771.02)–R2 (56,769.62) cluster or even approaching H6 (56,816.72), which represents extreme Camarilla territory where mean-reversion probability is significant. However, the Inside Narrow CPR is the one exception where compression energy can survive large gaps — the accumulated selling and buying orders from the compressed Inside session are released with full force, meaning even a large gap has a higher probability of following through than would be expected from a standard Wide CPR scenario. The key target beyond H5 (56,771.02) is the OI-R at 57,500, which is the monthly CE writing wall and the ultimate test for any sustained gap-up rally; two consecutive 15-min candles above H5 (56,771.02) confirm the extension, with the abort level for any long position being a 30-min close below H3 (56,566.36).
|
▲ Upside Path → OI-R The upside path from confirmed gap-up break: PDH (56,575.15) → H3 (56,566.36) [first stall reference] → R1 (56,620.79) [first partial, Narrow CPR rule] → H4 (56,660.76) [breakout trigger, trail here] → R2 (56,769.62) → H5 (56,771.02) → H6 (56,816.72) → OI-R at 57,500 as the ultimate monthly ceiling where CE writers will defend. Volume expansion on the move from H4 (56,660.76) to R2 (56,769.62) is the key confirmation that institutional buying is driving the session rather than retail FOMO; above H6 (56,816.72), treat any sustained price as a genuine attempt at the OI-R 57,500 monthly max pain target. |
▼ Downside Path → OI-S If the gap-up fails at PDH (56,575.15) or H3 (56,566.36) and price reverses, the downside path is TC (56,449.14) → P (56,426.32) → BC (56,403.50) → L3 (56,377.54) → L4 (56,283.13), with L4 (56,283.13) nearly confluent with PDL (56,231.85) — a critical demand zone where both Camarilla and price-history buyers congregate. Below L4 (56,283.13) and PDL (56,231.85), the next targets are S1 (56,277.49) [nearly the same level] → L5 (56,172.86) → S2 (56,083.02) → L6 (56,127.18), with the OI-S at 54,000 remaining the ultimate deep downside floor that would require a multi-session breakdown to test. |
| 🔴 OI-R: The OI-R at 57,500 is the monthly CE writing wall and maximum pain strike simultaneously, meaning that CE writers have sold 57,500 calls in significant quantity and their delta-hedging selling will intensify as BANKNIFTY approaches this level, creating a powerful gravitational ceiling that requires exceptional bullish momentum to breach. In a gap-up session, the 57,500 OI-R is approximately 1,028 pts above current price, so it functions as the ultimate monthly trend target rather than an immediate intraday ceiling, and any intraday session that sustains above H6 (56,816.72) with volume should be treated as a potential accelerator toward 57,500. | 🟢 OI-S: The OI-S at 54,000 is deeply out of range at approximately 2,472 pts below yesterday's close, making it structurally irrelevant for intraday gap-up scenarios but relevant as context that PE writers have massive positions far below current price — this means the institutional put writing community is comfortable at current levels and will actively buy futures on any dip, providing a structural floor that limits downside velocity in gap-up sessions. |
⚡ Key Trigger: The key trigger for BANKNIFTY gap-up is the first 15-minute candle close above PDH (56,575.15), which confirms that the Inside CPR double compression release is genuine and that the market structure has transitioned to trending-up for the session; the Narrow CPR rule specifies that the first 15-min candle is the directional confirmation window, making this the highest-conviction trigger signal of all CPR types. Failure of the first 15-min candle to hold above TC (56,449.14) — specifically a 15-min candle that reverses and closes below TC (56,449.14) — is the only signal that would negate the gap-up thesis and convert the session to bearish, targeting L3 (56,377.54) and L4 (56,283.13).
▼ Lower Open (Gap Down) — Open < Prev Close
▼ Bearish
Open lands: With prev close at 56,471.95, a gap-down open would push BANKNIFTY below TC (56,449.14). For an Inside Narrow CPR, a gap down below TC constitutes a double compression release downward — a high-energy bearish signal. A minor gap down opens near TC–BC (56,403.50–56,449.14); a significant gap down opens below BC (56,403.50) and toward L3 (56,377.54); a large gap down opens below L3 and potentially into L4 (56,283.13) or PDL (56,231.85) territory.
CPR role: Overhead resistance — when BANKNIFTY opens below TC (56,449.14) after a gap down in an Inside Narrow CPR, the CPR band (BC 56,403.50 to TC 56,449.14) immediately becomes a formidable resistance block, and the double compression release downward means bearish momentum can be swift and sustained.
Minor Gap (0.05–0.25%) — Structure Dominant
A minor gap down of 0.05–0.25% would open BANKNIFTY between approximately 56,330–56,443, placing price inside the CPR band (near BC at 56,403.50) or just below it — this is technically still an Inside CPR signal but on the lower boundary, creating a downside double-release potential if price fails to immediately recover above TC (56,449.14). The Narrow CPR (0.08%) confirmation rule dictates that the first 15-minute candle is decisive: a 15-min close back above TC (56,449.14) negates the gap-down and reopens the bullish double-release upward scenario targeting H3 (56,566.36), while a 15-min candle that fails to recover and closes below BC (56,403.50) confirms the bearish double-release with L3 (56,377.54) as the first target and L4 (56,283.13) as the breakdown trigger. Given the monthly max pain pull toward 57,500, a minor gap-down in BANKNIFTY is likely to attract dip buyers near BC (56,403.50), making the recovery scenario marginally more probable than continuation in a minor-gap context.
Significant Gap (0.25–0.5%) — Balanced
A significant gap down of 0.25–0.5% would open BANKNIFTY between approximately 56,330–56,330 (approximately 56,190–56,330), placing price below BC (56,403.50) and into the L3 (56,377.54)–S1 (56,277.49)–L4 (56,283.13) support cluster — this is a meaningful downside break of the Inside CPR that activates the bearish double-compression release with conviction. The 30-min reclaim rule (per Medium CPR reference for this session structure) applies: failure to recover above BC (56,403.50) within 30 minutes confirms continuation toward L4 (56,283.13) → S1 (56,277.49) → PDL (56,231.85) → L5 (56,172.86), with PUT writers at 56,000 and 55,500 starting to feel pressure; CE writers at 57,500 remain in deep profit and will not delta-hedge on the buy side, removing upside support. A recovery above BC (56,403.50) within 30 minutes opens a gap-fill attempt toward TC (56,449.14) and P (56,426.32), but two 30-min closes above TC would be required to confirm genuine recovery given the significant gap magnitude.
Large Gap (>0.5%) — Gap Direction Dominant
A large gap down of greater than 0.5% would open BANKNIFTY below 56,190, breaching L4 (56,283.13), S1 (56,277.49), and PDL (56,231.85) — a major breakdown of the Inside CPR double-compression release downward with velocity, likely driven by a significant macro or sector-specific negative catalyst such as RBI action, global credit events, or major bank-specific news. In this extreme scenario, the straddle-based downside limit from 56,500 is approximately 1,265 pts (monthly straddle), implying a floor near 55,235 — meaning even a large gap down is within the monthly options market's priced range, and smart money would be straddle sellers monetizing the panic rather than chasing shorts. Recovery levels to watch are L4 (56,283.13) → PDL (56,231.85) → L5 (56,172.86) → S2 (56,083.02), and the abort level for any short continuation is a 30-min close back above L4 (56,283.13); the OI-S at 54,000 remains the ultimate floor, approximately 2,000+ pts below, and would require a sustained multi-session breakdown to test.
|
▲ Upside Path → OI-R Recovery path from gap-down: BC (56,403.50) → P (56,426.32) → TC (56,449.14) [15-min close required] → PDH (56,575.15) → H3 (56,566.36) → R1 (56,620.79) → H4 (56,660.76), with the monthly max pain pull toward 57,500 providing structural tailwind for any recovery that sustains above TC (56,449.14). A genuine recovery above PDH (56,575.15) with above-average volume confirms that the gap-down was a shakeout of weak longs and that the trending structure has resumed upward, targeting the OI-R at 57,500 as the monthly session ceiling. |
▼ Downside Path → OI-S Bear continuation path from failed recovery: L3 (56,377.54) → L4 (56,283.13) → S1 (56,277.49) [nearly confluent with L4] → PDL (56,231.85) → L5 (56,172.86) → S2 (56,083.02) → L6 (56,127.18) → S3 (55,934.19), with retail stop-losses below PDL (56,231.85) and L5 (56,172.86) accelerating the move as algorithmic systems trigger sell orders at these pre-set levels. The OI-S at 54,000 is the deep institutional floor approximately 2,472 pts below current price, and a cascade toward S3 (55,934.19) would represent a 0.95% intraday breakdown — extreme but within the monthly straddle range. |
| 🔴 OI-R: The OI-R at 57,500 in a gap-down scenario becomes a deeply overhead ceiling where CE writers are in maximum profit and have zero urgency to cover, meaning there is no delta-hedging buy flow from the upside that would support a recovery; this absence of CE-driven buying makes the gap-down more dangerous than it would be if the OI-R were closer to current price. Structurally, the 57,500 CE wall reinforces that the path of least resistance for option sellers is to let BANKNIFTY drift lower and time-decay the monthly puts — reducing their motivation to defend the downside aggressively. | 🟢 OI-S: The OI-S at 54,000 is the primary monthly PE writing floor, approximately 2,472 pts below the close at 56,471.95, representing a major institutional commitment to the 54,000–54,500 range as a support anchor through September 2026. In a gap-down session, the OI-S at 54,000 is not an immediate intraday target but defines the boundary of institutional comfort for put writers — any sustained move below S3 (55,934.19) would begin to concern PE writers and trigger partial covering, providing natural demand in the 55,500–55,900 zone before the index would approach the OI-S at 54,000. |
⚡ Key Trigger: The key trigger for BANKNIFTY gap-down is whether the first 15-minute candle can recover and close above TC (56,449.14) — success confirms the gap-down was a fakeout or opening noise and reopens the bullish double-release thesis targeting H3 (56,566.36) and PDH (56,575.15); failure (15-min close below BC at 56,403.50) confirms the bearish double-release with L3 (56,377.54) → L4 (56,283.13) as the cascade path. The structural significance of TC (56,449.14) as the trigger cannot be overstated in an Inside Narrow CPR: it is the mathematical boundary of the compressed energy band, and a confirmed close below it in a gap-down session triggers algorithmic breakout-follow systems and retail stop-loss orders simultaneously, accelerating the move.
◆ Near Flat Open — Open ≈ Prev Close (±0.05%)
◆ Neutral
Open lands: A flat open within ±0.05% of prev close (56,471.95) would place BANKNIFTY in the range of approximately 56,444–56,500, which is above TC (56,449.14) since the prev close is already above TC. For an Inside Narrow CPR, a flat open at the boundary of TC (56,449.14) is the most electrically charged setup: price is sitting on the edge of the compressed energy band, and the first 15-minute candle will determine which direction the compression releases.
CPR role: Compression boundary and decision zone — the Inside Narrow CPR (BC 56,403.50 to TC 56,449.14) is the highest-tension CPR configuration; a flat open at TC (56,449.14) means the market opens exactly at the fulcrum of the compressed band, and any directional commitment will trigger a rapid expansion in volatility.
Near Flat (±0.05%)
A flat open in an Inside Narrow CPR (0.08% width) is the single highest-probability trend-day setup in the CPR framework: the compressed energy from the previous session's range being engulfed within today's tight band creates an explosive directional signal the moment price commits to either side of the CPR boundaries. Specifically, BC is at 56,403.50 and TC is at 56,449.14 — a 45.64-point band — and a flat open at approximately 56,472 (just above TC) places price in a tentative position where bulls hold a marginal advantage but bears can easily challenge TC with a single 15-minute reversal candle. For a Narrow CPR, the Narrow confirmation rule applies: the first 15-minute candle close is THE definitive signal — a 15-min close above PDH (56,575.15) while holding above TC (56,449.14) as support is the bull trigger with H3 (56,566.36) → R1 (56,620.79) as immediate targets; a 15-min close below BC (56,403.50) is the bear trigger with L3 (56,377.54) → L4 (56,283.13) as the cascade path. Given the monthly max pain at 57,500 and the Trending (up or down trend) market structure designation, the Inside Narrow CPR flat-open carries approximately 65–70% probability of a strong trending day, making this one of the highest-conviction intraday setups available in F&O; traders should NOT fade the first 15-min direction in this configuration.
|
▲ Upside Path → OI-R Confirmed bull path from flat open: TC (56,449.14) holds as support → first 15-min close above PDH (56,575.15) → H3 (56,566.36) first stall reference → R1 (56,620.79) partial profit per Narrow CPR rule → trail to H4 (56,660.76) → R2 (56,769.62) → H5 (56,771.02) → H6 (56,816.72) → OI-R at 57,500 as the monthly max pain and CE wall. Volume expansion on the break above PDH (56,575.15) is essential to confirm institutional buying participation; a breakout without volume above PDH is a high-risk long that may fade back to TC (56,449.14) quickly. |
▼ Downside Path → OI-S Confirmed bear path from flat open: BC (56,403.50) broken on 15-min close → L3 (56,377.54) first Camarilla mean-reversion reference → L4 (56,283.13) breakdown trigger → S1 (56,277.49) [nearly confluent] → PDL (56,231.85) → L5 (56,172.86) → S2 (56,083.02) → L6 (56,127.18) → S3 (55,934.19) with OI-S at 54,000 as the ultimate floor. The confluence of L4 (56,283.13) and S1 (56,277.49) approximately 6 points apart creates a critical demand cluster that will generate a first bounce; a second failure at this cluster accelerates toward L5 (56,172.86) and S2 (56,083.02). |
| 🔴 OI-R: The OI-R at 57,500 in a flat-open Inside Narrow CPR scenario is the monthly ceiling that CE writers have staked their position on, meaning any strong trending-day bullish breakout from the flat open will face increasing selling pressure as BANKNIFTY approaches 57,000–57,500 from delta-hedging flows; however, the max pain at 57,500 also means that market makers want price to eventually gravitate there by expiry, creating a paradox of both resistance and gravitational pull. For intraday purposes, the OI-R at 57,500 is the session target for a strong trend day, and CE writers are unlikely to aggressively delta-hedge until price is above H6 (56,816.72) — meaning the path from flat open to 56,816.72 is relatively clean if the bull trigger is activated. | 🟢 OI-S: The OI-S at 54,000 in a flat-open scenario represents the deep institutional put-writing anchor that makes aggressive intraday short positions extremely risky unless price breaks below multiple Camarilla and Traditional support levels; PE writers at 54,000 are deeply out-of-the-money and in maximum profit, meaning they will buy aggressively on any significant dip to protect their positions and prevent exercise. This massive PE writing base at 54,000 provides a structural argument for treating any flat-open bear day in BANKNIFTY as a potential short-term dip rather than a multi-session reversal, unless price decisively breaches S2 (56,083.02) and S3 (55,934.19) on volume. |
⚡ Key Trigger: The exact trigger for the bull side is a first 15-minute candle close above PDH (56,575.15) after sustaining above TC (56,449.14), confirming that the Inside CPR compression has released upward and targeting H3 (56,566.36) → R1 (56,620.79) with a stop below TC (56,449.14). The bear trigger is a first 15-minute candle close below BC (56,403.50), which confirms the downside double compression release, targeting L3 (56,377.54) → L4 (56,283.13) with a stop above TC (56,449.14); the fulcrum between these two triggers is the 45.64-point Inside Narrow CPR band itself — whichever boundary is broken with commitment determines the session's character, and in a Trending structure, that character typically holds for 70–80% of the trading day.
SENSEX
Overlapping — Medium (Width 0.13%)
↕ Conflicted
Market Structure Balanced or transitional | Straddle SENSEX Monthly ATM 74,900 straddle priced at 1,302.95 pts (Call 728.25 + Put 574.7), implying an expected monthly move of approximately ±1,302.95 pts from 74,900, defining a range of roughly 73,597 to 76,203 for the 24 Sep 2026 expiry. The significantly higher Call LTP (728.25) versus Put LTP (574.7) reveals a notable bullish skew — market participants are paying substantially more for upside exposure than downside protection, suggesting expectations of an upward resolution despite the current price being near the lower bound of the monthly range. The weekly SENSEX straddle is virtually worthless at 2.65 pts (Call 2.6 + Put 0.05), indicating the 10 Sep 2026 weekly expiry was essentially at maximum decay, making this data point unreliable for forward intraday analysis; focus should be on the monthly straddle of 1,302.95 pts. | Max Pain SENSEX Weekly Max Pain was at 74,900 which coincides exactly with yesterday's close of 74,902.59 — an extraordinarily tight alignment that suggests the weekly expiry on 10 Sep 2026 was perfectly pin-controlled by option sellers, and residual CE/PE positions from this expiry have largely decayed. SENSEX Monthly Max Pain at 76,500 is approximately 1,597 pts above yesterday's close, indicating significant gravitational pull upward through the 24 Sep 2026 monthly expiry and suggesting that institutional option writers are positioned for a recovery toward 76,500 — a bullish implication for the remainder of September. |
Tomorrow's Complete Level Map
OI-R: 75,000 R3: 75,322.04 H6: 75,216.35 H5: 75,174.84 R2: 75,116.50 H4 ▶: 75,074.46 R1: 75,009.55 PDH: 74,910.96 H3 ↩: 74,988.52
TC: 74,853.31 P: 74,804.01 BC: 74,754.71
L3 ↩: 74,816.66 PDL: 74,598.47 S1: 74,697.06 L4 ▶: 74,730.72 S2: 74,491.52 L5: 74,630.34 L6: 74,588.83 S3: 74,384.57 OI-S: 74,900
↩ = Camarilla reversal point | ▶ = Camarilla breakout/breakdown trigger | OI-R/OI-S = Options wall (CE/PE max OI)
▲ Higher Open (Gap Up) — Open > Prev Close
↕ Conflicted
Open lands: With prev close at 74,902.59 and TC at 74,853.31, prev close is already above TC. An Overlapping Medium CPR with prev close above TC means a gap-up open will further extend above TC and potentially above PDH (74,910.96). Critically, the OI-S at 74,900 and the OI-R at 75,000 are extraordinarily close — only 100 pts apart — creating a unique compressed OI band that the SENSEX must navigate. A minor gap up opens between 74,940–75,075; a significant gap up could open above 75,075 and directly into or above the OI-R at 75,000.
CPR role: Launch pad and support floor — the CPR band (BC 74,754.71 to TC 74,853.31) is below the prev close and gap-up open, transitioning to a firm support floor. However, the extreme proximity of OI-R (75,000) to the open creates an immediate resistance challenge unlike any other index in this analysis.
Minor Gap (0.05–0.25%) — Structure Dominant
A minor gap up of 0.05–0.25% would open SENSEX between approximately 74,940–75,090, placing price above TC (74,853.31), above PDH (74,910.96), and directly into or just above the OI-R at 75,000 — a unique and challenging setup where a minor gap immediately confronts the primary CE options wall. The Overlapping Medium CPR (0.13%) confirms a bullish bias with a 30-min close rule, but the OI-R at 75,000 is the most important factor: CE writers have sold 75,000 calls aggressively, and delta-hedging selling will materialize immediately upon gap-up above 75,000, creating a high probability of a gap-fill back toward PDH (74,910.96) and TC (74,853.31) within the first 30–60 minutes. If the 30-min candle can close above OI-R at 75,000 and hold it as support — converting the 75,000 CE wall into a floor — then the path to R1 (75,009.55) → H3 (74,988.52) → H4 (75,074.46) → R2 (75,116.50) opens; however, a gap-up that stalls and reverses at 75,000 is the highest-probability scenario for a minor gap in this OI configuration.
Significant Gap (0.25–0.5%) — Balanced
A significant gap up of 0.25–0.5% would open SENSEX between approximately 75,090–75,277, placing price above OI-R at 75,000, above R1 (75,009.55), and potentially into H4 (75,074.46)–R2 (75,116.50) territory — this is a genuine breakout above the CE wall that would trigger forced covering by 75,000 CE writers and delta-hedging buy flows. The monthly straddle of 1,302.95 pts supports a 75,000 breakout from a risk-management perspective, but the gap-fill risk back toward OI-S at 74,900 is still significant unless two consecutive 30-min candles close above R1 (75,009.55) with above-average volume; the OI-S at 74,900 acts as a magnetic gap-fill target approximately 90–190 pts below the open, and weak buying would attract sellers who fade the gap using the 75,000 OI-R as resistance. Targets above the OI-R on confirmation: R1 (75,009.55) → H4 (75,074.46) → R2 (75,116.50) → H5 (75,174.84) → H6 (75,216.35) → R3 (75,322.04).
Large Gap (>0.5%) — Gap Direction Dominant
A large gap up of greater than 0.5% would open SENSEX above 75,277, potentially above R2 (75,116.50) and into H5 (75,174.84)–H6 (75,216.35)–R3 (75,322.04) territory — an extreme move that fully clears the OI-R at 75,000 and places price in Camarilla extreme territory where mean-reversion probability is high. The prevailing weekly pin at 74,900 (exactly matching the max pain) and the tight OI band (74,900 OI-S to 75,000 OI-R) suggest that a large gap up would be driven by an unusual catalyst; without VIX confirmation, gap-fill probability back to at least 75,000 within the session is high. The abort level for longs in a large gap up is H4 (75,074.46) on a 30-min close basis; targets remain R3 (75,322.04) only with two 30-min closes above H5 (75,174.84) and expanding volume confirming institutional commitment.
|
▲ Upside Path → OI-R Upside path from confirmed gap-up above OI-R at 75,000: 75,000 converts to support → R1 (75,009.55) as first Traditional target → H3 (74,988.52) [already below, acts as prior reference] → H4 (75,074.46) as breakout confirmation → R2 (75,116.50) as second partial → H5 (75,174.84) → H6 (75,216.35) → R3 (75,322.04), with the monthly max pain pull toward 76,500 providing a structural tailwind for extended moves. Above R3 (75,322.04), the daily CPR zone becomes support from below and the weekly Camarilla and Traditional levels take over as the next reference framework. |
▼ Downside Path → OI-S Failed gap-up downside path: rejection at OI-R (75,000) → gap fill back to PDH (74,910.96) → TC (74,853.31) → P (74,804.01) → BC (74,754.71) → L3 (74,816.66) [note: L3 is above BC, check levels — L3 74,816.66 is above BC 74,754.71, so order is TC → L3 → P → BC → L4] → L4 (74,730.72) → S1 (74,697.06) → PDL (74,598.47) → L5 (74,630.34) → L6 (74,588.83), with the OI-S at 74,900 acting as a key gap-fill target and first natural support for any intraday pullback. A sustained break below BC (74,754.71) on a 30-min close opens the path toward S2 (74,491.52) and S3 (74,384.57). |
| 🔴 OI-R: The OI-R at 75,000 is the single most important level for SENSEX on 11 Sep 2026 — it sits a mere 97.41 pts above yesterday's close of 74,902.59 and represents the strike where CE writers have maximum open interest, making it both an immediate resistance ceiling and a critical breakout confirmation level. A gap-up opening above or at 75,000 will immediately trigger delta-hedging selling from CE writers who sold 75,000 calls, creating a 'wall effect' where every point above 75,000 generates incremental selling pressure; however, if price holds above 75,000 for 30 minutes with strong volume, the CE writers are forced to cover (buy back) and their covering buying amplifies the upside — converting the CE wall from a ceiling into a launch pad. | 🟢 OI-S: The OI-S at 74,900 is the PE writing floor, located only 2.59 pts below yesterday's close of 74,902.59 — an extraordinarily tight alignment that indicates the weekly expiry (10 Sep 2026) has created a perfect pin at exactly this level. PE writers who sold 74,900 puts have their position at exactly the spot where the index is trading, meaning any gap-up above 74,900 takes them into profit immediately and they are unlikely to hedge, while any gap-down below 74,900 puts them under pressure and triggers futures buying from PE writers to defend — making 74,900 a highly reactive support level with genuine institutional commitment to defending it. |
⚡ Key Trigger: The critical trigger for SENSEX gap-up is whether price can sustain a 30-minute candle close above OI-R at 75,000 — this is not a standard CPR trigger but an OI-level trigger that supersedes the Traditional R1 (75,009.55) because the CE writing wall at 75,000 is the primary market structure determinant in this unique setup. Failure to hold above 75,000 on the 30-min candle close sends price back toward PDH (74,910.96) and TC (74,853.31), where the CPR band becomes support; sustained close above 75,000 converts that level to a floor and unlocks H3 (74,988.52) → H4 (75,074.46) → R1 (75,009.55) → R2 (75,116.50) as the bullish cascade.
▼ Lower Open (Gap Down) — Open < Prev Close
▼ Bearish
Open lands: A gap-down open below prev close (74,902.59) would push SENSEX below TC (74,853.31). Critically, it would also push price below OI-S at 74,900, which sits only 2.59 pts below the close — meaning even a minor gap down below 74,900 immediately breaches the PE writing floor. The CPR band (BC 74,754.71 to TC 74,853.31) becomes the primary battleground, with OI-S at 74,900 acting as a first immediate level of interest for PE writers who must defend or cover.
CPR role: Overhead resistance and battleground — a gap-down open places the CPR band above the opening price. The OI-S at 74,900 is the immediate first test: PE writers who are at-the-money on their positions will be aggressively defending, creating a complex dynamic where selling pressure from the gap competes with PE writer buying.
Minor Gap (0.05–0.25%) — Structure Dominant
A minor gap down of 0.05–0.25% would open SENSEX between approximately 74,715–74,865, placing price below OI-S at 74,900 (breached immediately), near or inside the CPR band (TC 74,853.31 to BC 74,754.71), with the extreme case of a 0.25% gap opening near 74,715 — below BC (74,754.71) and near L4 (74,730.72). The breach of OI-S at 74,900 is the most critical signal: PE writers who sold 74,900 puts are now in a loss position and must buy futures to delta-hedge, creating natural demand in the 74,850–74,900 zone that competes with selling pressure — a highly contested recovery attempt is expected in the first 30 minutes. If PE writer buying fails to push price back above OI-S (74,900) within the first 30 minutes, the 30-min candle close below BC (74,754.71) becomes the bear confirmation, targeting L3 (74,816.66) → L4 (74,730.72) → S1 (74,697.06) → PDL (74,598.47) → L5 (74,630.34); recovery above TC (74,853.31) on a 30-min close would neutralize the gap and reopen the 75,000 OI-R challenge.
Significant Gap (0.25–0.5%) — Balanced
A significant gap down of 0.25–0.5% would open SENSEX between approximately 74,527–74,715, placing price below BC (74,754.71), below L4 (74,730.72), and potentially near S1 (74,697.06) — a meaningful breakdown below the entire CPR band and the OI-S at 74,900 that puts PE writers firmly under pressure and could trigger rapid covering. The 30-min reclaim rule applies for the Medium CPR: failure to reclaim BC (74,754.71) within 30 minutes of open confirms the bearish structure is in control with L4 (74,730.72) → S1 (74,697.06) → PDL (74,598.47) → L5 (74,630.34) → L6 (74,588.83) as the cascade, while PE writer panic covering amplifies both the initial selling and any eventual bounce; the monthly straddle of 1,302.95 pts from 74,900 places the downside expectation floor near 73,597, meaning a significant gap is still within the priced range. Two 30-min closes above BC (74,754.71) would be required to confirm genuine recovery and rebuild the case for an OI-R test at 75,000.
Large Gap (>0.5%) — Gap Direction Dominant
A large gap down of greater than 0.5% would open SENSEX below 74,527, breaching PDL (74,598.47), L5 (74,630.34), L6 (74,588.83), and approaching S2 (74,491.52) — a catastrophic breach of multiple support levels simultaneously, including the PE writing floor at 74,900, that would trigger forced covering, margin calls, and potential VIX spike. In this extreme scenario, the monthly straddle at 1,302.95 pts has likely already been partially monetised by the gap itself, and straddle sellers would immediately sell OTM calls to collect premium while the market is in panic; the specific recovery level from a large gap down is L5 (74,630.34) and PDL (74,598.47), and a first 30-min candle that stabilizes above L6 (74,588.83) is the minimum signal required to consider any bounce trade. Primary downside targets in a large gap scenario: S2 (74,491.52) → S3 (74,384.57), with the OI-S at 74,900 now acting as overhead resistance rather than support — a complete structural role reversal.
|
▲ Upside Path → OI-R Recovery path from gap-down: OI-S at 74,900 reclaimed on 30-min close → TC (74,853.31) → P (74,804.01) [wait, TC is 74,853.31 which is above OI-S at 74,900 — correction: OI-S 74,900 → TC 74,853.31 is below OI-S, so actual order from below is PDL (74,598.47) → L6 (74,588.83) → L5 (74,630.34) → PDL → S1 (74,697.06) → L4 (74,730.72) → BC (74,754.71) → L3 (74,816.66) → P (74,804.01) → TC (74,853.31) → OI-S at 74,900 → PDH (74,910.96) → H3 (74,988.52) → OI-R at 75,000]. A genuine recovery requires two 30-min closes above TC (74,853.31) and then above OI-S at 74,900 to confirm bullish structure restoration. |
▼ Downside Path → OI-S Bear continuation path: below OI-S at 74,900 → BC (74,754.71) → L4 (74,730.72) → S1 (74,697.06) → PDL (74,598.47) → L5 (74,630.34) → L6 (74,588.83) → S2 (74,491.52) → S3 (74,384.57), with retail stop-losses below PDL (74,598.47) and L5 (74,630.34) accelerating momentum in a sector that recently had monthly max pain at 76,500 — approximately 1,600 pts away — meaning a large gap down would be a significant deviation from the expiry gravitational pull. The OI-S at 74,900 as a breached former-support-turned-resistance would add to the bearish pressure on any attempted recovery. |
| 🔴 OI-R: The OI-R at 75,000 in a gap-down scenario is a distant ceiling of approximately 370–470 pts above the open for a significant gap down, and represents CE writers comfortably in profit with zero delta-hedging urgency to buy — removing any structural upside support from the options market. CE writers at 75,000 may even add short futures positions on any intraday recovery above 74,800–74,900 to further hedge their delta, actively compressing recovery attempts and making the gap-down more sustained. | 🟢 OI-S: The OI-S at 74,900 is the most reactive level in the SENSEX universe on 11 Sep 2026 — in a gap-down scenario, PE writers at 74,900 who sold puts are immediately in a loss position and will buy futures aggressively to delta-hedge, creating natural demand in the 74,820–74,900 zone that is likely to generate a bounce within the first 15–30 minutes. If this PE writer buying fails and price sustains below 74,900 for more than 30 minutes, it signals that selling pressure is overwhelming even institutional hedging flows, which is a powerful bearish confirmation; the 74,900 PE base transitioning from support to resistance is one of the most powerful structural signals in this analysis. |
⚡ Key Trigger: The critical trigger for SENSEX gap-down is whether the OI-S at 74,900 can be reclaimed within the first 30 minutes — specifically, a 30-min candle close back above 74,900 after a gap-down below it signals that PE writers have successfully defended their positions and buying flows are overwhelming the gap. Failure to reclaim OI-S at 74,900 and a 30-min close below BC (74,754.71) is the definitive bear confirmation, converting the entire CPR band from a battleground to overhead resistance and activating the L4 (74,730.72) → S1 (74,697.06) → PDL (74,598.47) cascade with stops for short positions above TC (74,853.31).
◆ Near Flat Open — Open ≈ Prev Close (±0.05%)
◆ Neutral
Open lands: A flat open within ±0.05% of prev close (74,902.59) would place SENSEX in the range of approximately 74,865–74,940, which is above TC (74,853.31) and near or above OI-S at 74,900. Since the Overlapping Medium CPR has prev close above TC, a flat open maintains the same position — just above TC (74,853.31) — with the extraordinarily important context that OI-S at 74,900 and OI-R at 75,000 sandwich the opening price in a 100-point band.
CPR role: Decision zone within an OI sandwich — the CPR band (BC 74,754.71 to TC 74,853.31) sits just below the flat open while OI-R at 75,000 sits approximately 97 pts above; this creates an extraordinarily compressed 100-pt OI band (74,900 to 75,000) around the opening price that dominates all other technical signals for the session.
Near Flat (±0.05%)
A flat open in SENSEX's Overlapping Medium CPR (0.13%) with the opening price sandwiched between OI-S at 74,900 and OI-R at 75,000 — a mere 100-pt range — is the most unique and complex setup among all three indices today: the CPR analysis is secondary to the options OI dynamics that create a magnetic compression around the 74,900–75,000 band. The first 30-minute candle is the primary signal: a 30-min close above OI-R at 75,000 (while holding OI-S at 74,900 as support) triggers CE writer covering and opens the bullish path to H3 (74,988.52) → R1 (75,009.55) → H4 (75,074.46) → R2 (75,116.50), with the monthly max pain at 76,500 providing gravitational pull; a 30-min close below OI-S at 74,900 puts PE writers under pressure and opens the bearish path to TC (74,853.31) → BC (74,754.71) → L4 (74,730.72) → S1 (74,697.06). For a Medium CPR, the analysis suggests that the 100-pt OI sandwich (74,900–75,000) will produce significant early-session range-trading and false breakouts before a direction is established — the first 30-min rule is essential to avoid being trapped in noise; sustained 30-min close above 75,000 is the only clean bull signal, and sustained close below 74,900 (OI-S) is the only clean bear signal, with everything in between being high-noise chop that should be avoided by directional traders.
|
▲ Upside Path → OI-R Confirmed bull path from flat open after 30-min close above OI-R at 75,000: OI-R (75,000) converts to support floor → H3 (74,988.52) already below [prior reference, not upside target] → R1 (75,009.55) as first Traditional target and first partial → H4 (75,074.46) as next Camarilla reference → R2 (75,116.50) as second partial per Medium CPR rule → H5 (75,174.84) → H6 (75,216.35) → R3 (75,322.04), with the monthly max pain gravitational pull toward 76,500 supporting any extension above R3 (75,322.04). The key volume confirmation signal is above-average buying in the first 30-minute candle that closes above 75,000 — thin volume breakouts above the OI-R in SENSEX are unreliable and should be treated with skepticism. |
▼ Downside Path → OI-S Confirmed bear path from flat open after 30-min close below OI-S at 74,900: OI-S (74,900) becomes overhead resistance → TC (74,853.31) → P (74,804.01) → BC (74,754.71) → L3 (74,816.66) [note: L3 74,816.66 is between TC and P, acting as a minor stall point] → L4 (74,730.72) → S1 (74,697.06) → PDL (74,598.47) → L5 (74,630.34) → L6 (74,588.83) → S2 (74,491.52) → S3 (74,384.57) as the extended bear target. A sustained position below BC (74,754.71) on a 30-min close is the accelerant for the S1 (74,697.06) → PDL (74,598.47) test, and retail stop-losses below PDL (74,598.47) would drive momentum toward L5 (74,630.34) and L6 (74,588.83). |
| 🔴 OI-R: The OI-R at 75,000 in a flat-open scenario is not just a resistance level — it is a defining boundary that separates bull from bear control for the session, sitting a mere 97.41 pts above the opening price in an Overlapping Medium CPR framework. CE writers at 75,000 are at-the-money relative to the opening price and will delta-hedge aggressively on any approach, meaning every attempt to break above 75,000 faces immediate selling from CE writers — but a sustained break above 75,000 on volume triggers forced covering that amplifies the move to R1 (75,009.55) → H4 (75,074.46) → R2 (75,116.50) rapidly. | 🟢 OI-S: The OI-S at 74,900 in a flat-open scenario is effectively the PE writing pin level — the weekly max pain was exactly 74,900 and yesterday's close was 74,902.59, meaning the market pinned perfectly at the weekly PE writing strike on expiry day (10 Sep 2026). On 11 Sep 2026 (post-expiry), the 74,900 PE OI carries over to the monthly cycle, and PE writers who sold 74,900 monthly puts are now just barely in-the-money on puts — meaning they will defend 74,900 as aggressively as CE writers defend 75,000, creating the 100-pt sandwich dynamic that makes SENSEX the most technically complex index to trade on 11 Sep 2026. |
⚡ Key Trigger: The dual trigger for SENSEX flat-open is: Bull — first 30-minute candle close above OI-R at 75,000 with volume confirmation, signaling CE writer short-covering and unlocking R1 (75,009.55) → H4 (75,074.46) → R2 (75,116.50) as the upside cascade; Bear — first 30-minute candle close below OI-S at 74,900 (and by extension below TC at 74,853.31), signaling PE writer delta-hedging failure and activating the downside path to BC (74,754.71) → L4 (74,730.72) → S1 (74,697.06). Between 74,900 and 75,000, SENSEX is in a no-trade zone for directional players; the 100-pt OI sandwich creates excessive chop and false signals that destroy discipline — patient traders wait for a confirmed 30-min close outside this band.
📊 VIX Insight: India VIX data is unavailable for this session, which is a significant limitation for premium-decay calibration and volatility-adjusted position sizing on 11 Sep 2026. In the absence of VIX data, traders should use the weekly NIFTY straddle of 203.5 pts as the proxy volatility measure — an expected move of ±0.87% from 23,500 — and treat any intraday move beyond this range as an outlier requiring fresh confirmation rather than directional extrapolation. For BANKNIFTY and SENSEX, the monthly straddles (1,265 pts and 1,302.95 pts respectively) define the outer boundaries of expected price action through September expiry, and the absence of VIX narrows the reliable intraday signals to pure price-action confirmations (15-min and 30-min candle closes) rather than volatility-adjusted entries.
Overall View:
All three indices present a nuanced picture heading into 11 Sep 2026: NIFTY's Overlapping Medium CPR with prev close above TC creates a slight bullish lean but the balanced structure limits conviction; BANKNIFTY's Inside Narrow CPR is the highest-conviction setup of the three, signaling an explosive directional trending day with the monthly max pain pull at 57,500 adding bullish gravitational force; and SENSEX presents the most unique configuration, with OI-S at 74,900 and OI-R at 75,000 sandwiching the opening price in a 100-pt band that creates extreme early-session chop before a direction is established. The dominant cross-index theme is that all three remain well below their weekly CPR pivots (NIFTY 23,942.55, BANKNIFTY 57,405.93, SENSEX 76,627.67), maintaining an intermediate bearish structure that will require decisive, volume-backed breakouts above daily CPR resistance levels to begin reversing — traders should prefer intraday long setups with tight stops above the respective CPR bands and avoid aggressive overnight long positioning until weekly CPR reclamation occurs.
All three indices present a nuanced picture heading into 11 Sep 2026: NIFTY's Overlapping Medium CPR with prev close above TC creates a slight bullish lean but the balanced structure limits conviction; BANKNIFTY's Inside Narrow CPR is the highest-conviction setup of the three, signaling an explosive directional trending day with the monthly max pain pull at 57,500 adding bullish gravitational force; and SENSEX presents the most unique configuration, with OI-S at 74,900 and OI-R at 75,000 sandwiching the opening price in a 100-pt band that creates extreme early-session chop before a direction is established. The dominant cross-index theme is that all three remain well below their weekly CPR pivots (NIFTY 23,942.55, BANKNIFTY 57,405.93, SENSEX 76,627.67), maintaining an intermediate bearish structure that will require decisive, volume-backed breakouts above daily CPR resistance levels to begin reversing — traders should prefer intraday long setups with tight stops above the respective CPR bands and avoid aggressive overnight long positioning until weekly CPR reclamation occurs.
Disclaimer: KRV Prime provides educational and informational content relating to financial markets. Articles, research, examples, charts, strategies and tools are provided for educational purposes and should not be interpreted as personalised investment advice or a guarantee of financial performance. Markets involve risk, including possible loss of capital. Past performance does not guarantee future results. KRV Prime is not a SEBI Registered Investment Adviser or Research Analyst.