
Index Analysis
Intraday Analysis for 14 Sep 2026
KRV Prime16 September 202648 min
Educational/Derived AnalysisSource: KRV Prime Market Insights (End-of-Day)As of 16 Sep 2026, 03:52 PM IST
Intraday Analysis for 14 Sep 2026
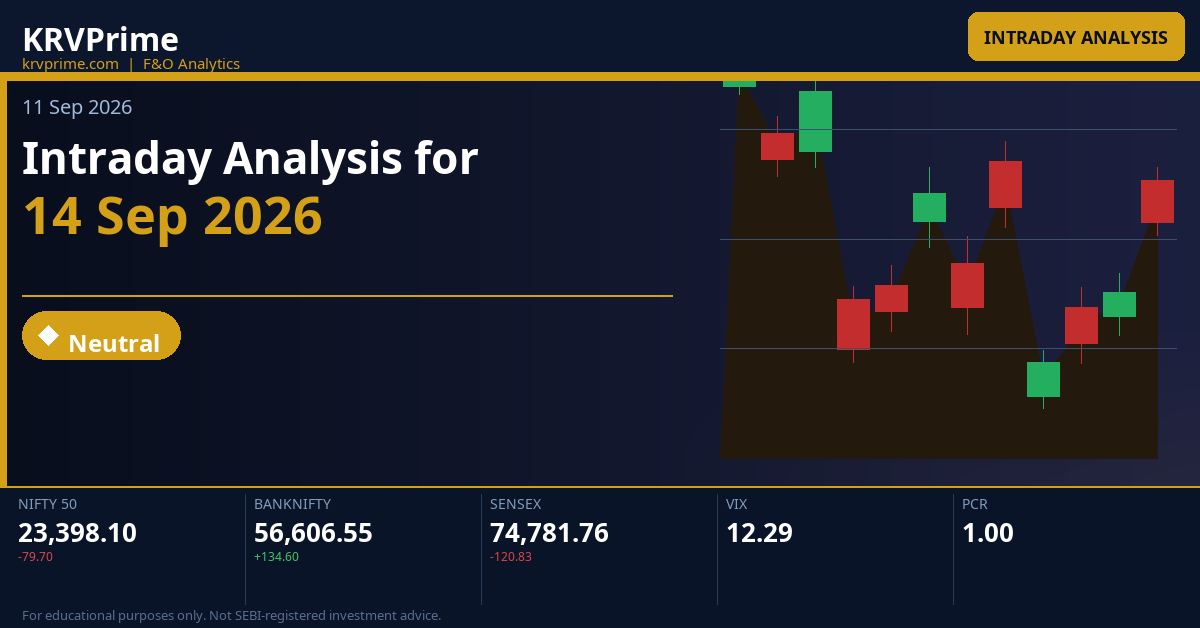
Markets head into Monday's session on a mixed note after NIFTY closed at 23,398.10 (-0.34%) and BANKNIFTY at 56,606.55 (+0.24%), with SENSEX settling at 74,781.76 (-0.16%) on 11 Sep 2026. India VIX data is unavailable for this session, which makes straddle pricing the primary gauge of expected volatility — NIFTY's weekly straddle of 204 points implies a roughly ±0.87% expected move for the expiry week, while SENSEX's weekly straddle of 933.55 points signals elevated premium in that index. With NIFTY's monthly max pain at 24,000 sitting well above the current close of 23,398.10 and BANKNIFTY's monthly max pain at 57,500 above its close of 56,606.55, there is a structural gravitational pull higher into month-end even as near-term price action remains under CPR resistance.
Key Market Signals — Intraday Setup
All three indices are trading below their respective weekly CPR pivots — NIFTY below 23,942.55, BANKNIFTY below 57,405.93, and SENSEX below 76,627.67 — confirming broad market weakness heading into Monday, while the divergence of BANKNIFTY (+0.24%) versus NIFTY (-0.34%) on 11 Sep signals selective buying in financials that may produce index-level divergence in Monday's session as well.
Deep Technical Analysis & Levels
NIFTY
Descending — Medium
▼ Bearish
Market Structure Balanced or transitional | Straddle NIFTY weekly ATM 23,400 straddle priced at 204.0 points (Call 133.6 + Put 70.4), implying an expected intraday move of approximately ±204 points, placing the weekly range between roughly 23,196 and 23,604 — notably, this straddle premium keeps the upper boundary below both the weekly CPR pivot at 23,942.55 and the OI resistance wall at 24,000, reinforcing the bearish structure. | Max Pain NIFTY weekly max pain is 23,450 for the 15-Sep-2026 expiry, sitting just above Thursday's close of 23,398.10 and inside the CPR band (BC 23,339.75 to TC 23,378.65 is technically below 23,450), which implies option sellers will defend 23,450 as the gravitational magnet for expiry — a drift toward 23,450 from below is the path of least resistance for option writers this week. |
Tomorrow's Complete Level Map
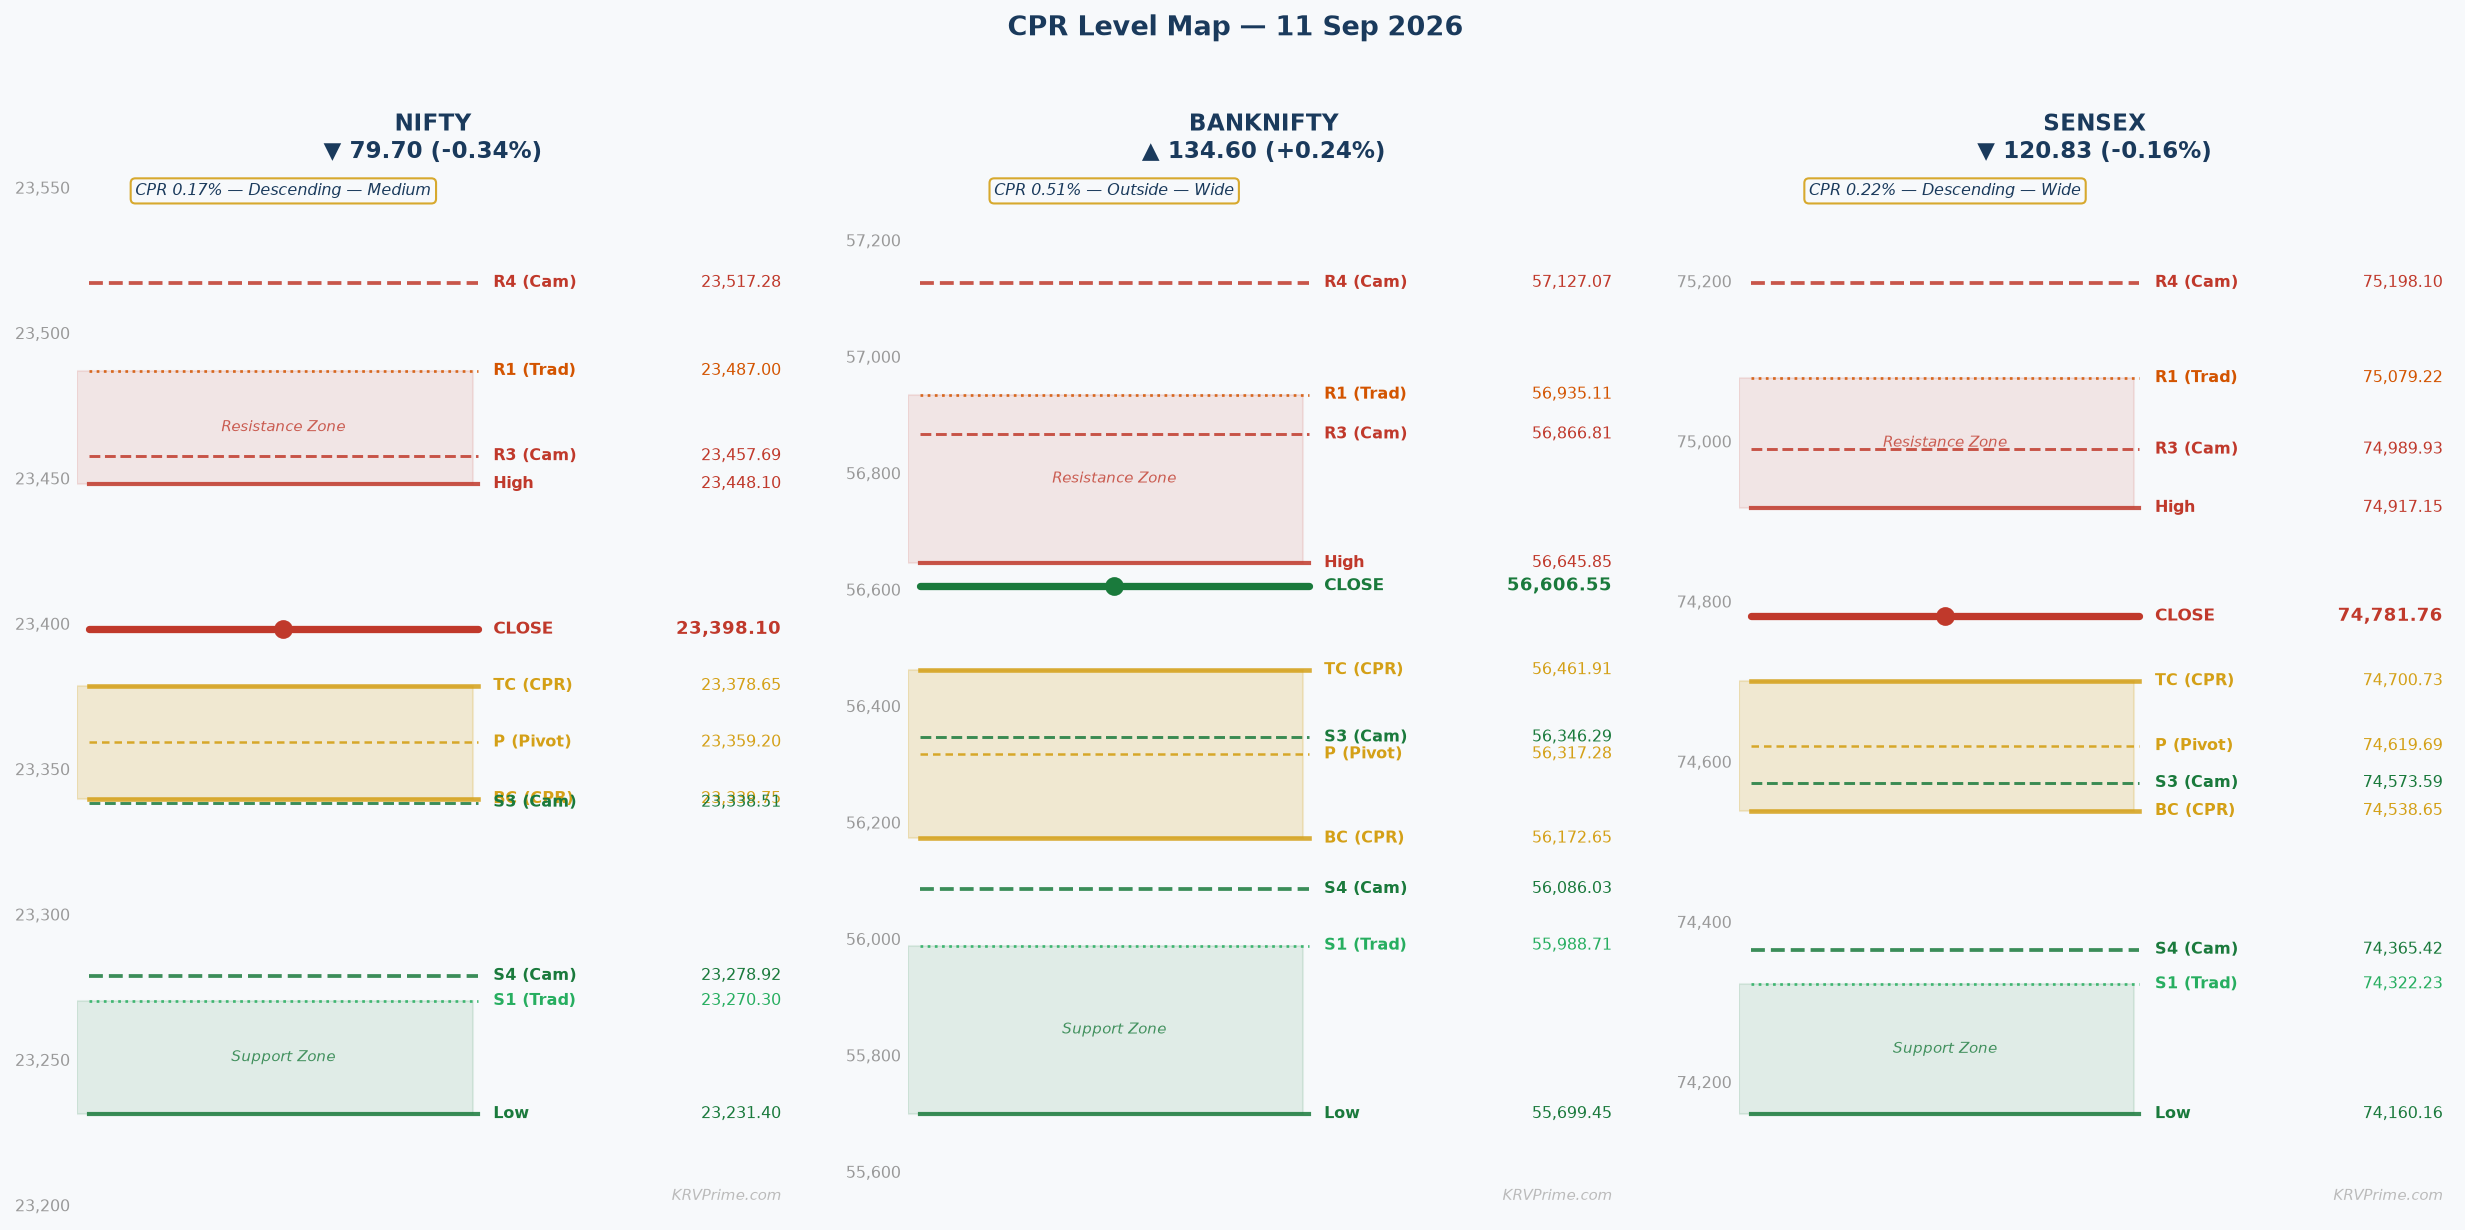
OI-R: 24,000 R3: 23,703.70 H6: 23,616.35 H5: 23,586.88 R2: 23,575.90 H4 ▶: 23,517.28 R1: 23,487 PDH: 23,448.10 H3 ↩: 23,457.69
TC: 23,378.65 P: 23,359.20 BC: 23,339.75
L3 ↩: 23,338.51 PDL: 23,231.40 S1: 23,270.30 L4 ▶: 23,278.92 S2: 23,142.50 L5: 23,209.32 L6: 23,179.85 S3: 23,053.60 OI-S: 23,300
↩ = Camarilla reversal point | ▶ = Camarilla breakout/breakdown trigger | OI-R/OI-S = Options wall (CE/PE max OI)
▲ Higher Open (Gap Up) — Open > Prev Close
▲ Bullish
Open lands: With Descending CPR, the entire CPR band (BC 23,339.75 to TC 23,378.65) sits below the previous close of 23,398.10. A gap-up open lands ABOVE TC 23,378.65, placing price above the entire descending CPR band — this is the Descending CPR gap-up scenario where price opens above resistance, giving the bulls an immediate structural advantage if the gap is sustained.
CPR role: The CPR band (BC 23,339.75 to TC 23,378.65) flips to immediate support below price in this scenario — if price opens above TC 23,378.65 and holds, the CPR band acts as a launch pad; any pullback to TC 23,378.65 is a retest opportunity for longs.
Minor Gap (0.05–0.25%) — Structure Dominant
A minor gap up of 0.05–0.25% places the opening price in the range of roughly 23,410 to 23,457, which is above TC 23,378.65 but still below the Camarilla H3 at 23,457.69 and PDH at 23,448.10. The descending CPR structure adds confirmation to the gap — since the entire CPR sits below the open, the band immediately becomes support rather than resistance, and the medium-width (0.17%) CPR requires a first 30-minute candle close above TC 23,378.65 to confirm directional intent. The first upside target on a confirmed 30-minute close above PDH 23,448.10 is Camarilla H3 at 23,457.69, followed by Traditional R1 at 23,487, with the straddle-implied upper boundary near 23,604 aligning with H5 at 23,586.88.
Significant Gap (0.25–0.5%) — Balanced
A significant gap up of 0.25–0.5% opens price between approximately 23,457 and 23,515 — directly into the Camarilla H3 zone at 23,457.69 and approaching H4 at 23,517.28, which represents immediate resistance. Gap-fill risk is elevated in this range as price opens into a key Camarilla mean-reversion zone where sellers typically engage; the medium-width CPR rule still applies (30-minute close required), but the gap's momentum needs to drive through H3 23,457.69 on the first 30-minute candle to avoid a H3-driven fade back toward TC 23,378.65 and Pivot 23,359.20. If the 30-minute candle closes above H4 23,517.28, the delta-hedging flow from CE writers being tested at their H3-H4 zone accelerates a squeeze toward R2 23,575.90 and H5 23,586.88.
Large Gap (>0.5%) — Gap Direction Dominant
A large gap up exceeding 0.5% opens price above H4 23,517.28 and potentially above R1 23,487 — the gap overrides the descending CPR structure's residual bearish lean and turns the session into a momentum-dominated environment. Gap-fill probability increases significantly as price opens into or above Camarilla H4 23,517.28, a classical breakout trigger zone where mean-reversion trades attract short-term sellers; however, if global cues justify the gap, the first two 30-minute closes confirming above H4 23,517.28 open the path to H5 23,586.88 and R2 23,575.90. The straddle of 204 points only extends the implied upper range to ~23,604, so a large gap opening near or above that level would be a straddle-breaker event requiring an abort level at re-entry below H4 23,517.28.
|
▲ Upside Path → OI-R Confirmed 30-minute close above PDH 23,448.10 targets Camarilla H3 23,457.69 (first partial profit, mean-reversion stall zone), then H4 23,517.28 (breakout trigger — acceleration if closed above on 30-min basis), then Traditional R2 23,575.90 and H5 23,586.88 as the straddle-implied ceiling, with the ultimate OI resistance wall at 24,000 acting as the weekly macro target that only becomes relevant if price sustains above R3 23,703.70. Genuine momentum is confirmed when volume expands on the H3-to-H4 break and intraday pullbacks hold above Pivot 23,359.20. |
▼ Downside Path → OI-S Failure to sustain above TC 23,378.65 after the gap-up open triggers a fade back toward Pivot 23,359.20 and then BC 23,339.75 (which converges with Camarilla L3 at 23,338.51, a powerful dual-support confluence); a 30-minute close below L3 23,338.51 opens the downside path toward L4 23,278.92 and Traditional S1 23,270.30, with OI support at 23,300 acting as the primary PE writing floor that put writers will defend aggressively. Loss of 23,300 OI-S on a closing basis flips the day's structure from gap-up bull trap to a genuine downside session targeting PDL 23,231.40 and L5 23,209.32. |
| 🔴 OI-R: The OI resistance at 24,000 (highest CE writing strike for the week) is a distant ceiling in the gap-up scenario — it is not an intraday target but rather the weekly options wall that CE writers have structured their maximum pain defense around, meaning any rally toward 24,000 will face exponentially increasing gamma-hedging selling pressure from market makers delta-hedging their short call exposure. In practical terms, the 24,000 OI-R functions as a ceiling that anchors the weekly range and keeps any gap-up day constrained to targets between H4 23,517.28 and R2 23,575.90 unless a major macro catalyst drives a genuine weekly CPR reclaim above 23,942.55. | 🟢 OI-S: The OI support at 23,300 (highest PE writing strike for the week) is the primary downside abort level — in a gap-up scenario, a drop below 23,300 would be a critical failure signal indicating that PE writers at this strike are being threatened, which typically triggers defensive covering by put sellers and can accelerate a sharp downmove. As long as price remains above 23,300, the PE base provides a cushion that limits downside even if the gap-up fails, making it the structural floor to watch if the bull trade is abandoned. |
⚡ Key Trigger: The primary trigger for bulls in any gap-up scenario is a 30-minute candle close above PDH 23,448.10 (which also clears H3 23,457.69 in a significant-gap context), confirming that the prior day's high is now support and Camarilla breakout dynamics are engaged. Failure to hold above TC 23,378.65 after the opening surge and a 30-minute close back below TC converts the gap-up into a bull trap, shifting the directional bias back to bearish with CPR acting as overhead resistance for the remainder of the session.
▼ Lower Open (Gap Down) — Open < Prev Close
▼ Bearish
Open lands: A gap-down open on a Descending CPR places price inside the CPR band (between BC 23,339.75 and TC 23,378.65) for a minor gap, or below the entire CPR band (below BC 23,339.75) for a significant or large gap — in either case, the descending CPR acts as overhead resistance, with sellers having structural advantage.
CPR role: The CPR band (BC 23,339.75 to TC 23,378.65) acts as overhead resistance in the gap-down scenario — any intraday bounce attempting to recover will face the CPR band as a supply zone, with TC 23,378.65 being the key bull-reclaim level that must be closed above on a 30-minute basis for the bear structure to be neutralised.
Minor Gap (0.05–0.25%) — Structure Dominant
A minor gap down of 0.05–0.25% opens price between approximately 23,339 and 23,387, placing it either just inside the CPR band or at BC 23,339.75 — this is a nuanced opening where price is essentially testing the bottom of the CPR band from above and the Camarilla L3 at 23,338.51 simultaneously creates a dual-support test. Minor gaps in a descending CPR often fill within 30–60 minutes, as the gap is small enough for buyers to absorb, but the medium-width CPR (0.17%) means the 30-minute confirmation rule applies — a close back above Pivot 23,359.20 within 30 minutes suggests gap-fill intent toward TC 23,378.65, while failure at Pivot keeps BC 23,339.75 and L3 23,338.51 as the primary bear targets. If BC and L3 break on a 30-minute close, the next support cluster is Traditional S1 23,270.30 converging with L4 23,278.92.
Significant Gap (0.25–0.5%) — Balanced
A significant gap down of 0.25–0.5% opens price between approximately 23,281 and 23,339 — below the entire CPR band and near the L4 23,278.92 / S1 23,270.30 support cluster, which is a critical zone where the failure-and-resume versus recovery debate plays out. A 30-minute close below S1 23,270.30 confirms resumption of the downtrend with targets at L5 23,209.32 and PDL 23,231.40, while a 30-minute candle that reclaims BC 23,339.75 (with volume) sets up a short-covering recovery toward Pivot 23,359.20 and TC 23,378.65. PUT writers at OI-S 23,300 will actively defend that level, meaning price action between 23,270 and 23,340 will be highly contested — the 30-minute candle behavior in this zone is the key read for the rest of the day's direction.
Large Gap (>0.5%) — Gap Direction Dominant
A large gap down exceeding 0.5% opens price below L4 23,278.92 and potentially below the OI support at 23,300 — this is a structural breakdown event where major support levels are breached at the open, triggering retail stop-losses and institutional delta-hedging on put positions. The panic-versus-recovery dynamic typically plays out in the first 30 minutes: if price finds a base at L5 23,209.32 or PDL 23,231.40 and produces a 30-minute candle closing above L4 23,278.92, straddle monetisation and short-covering begins; if L5 23,209.32 fails on a 30-minute close, the path opens to L6 23,179.85 and ultimately S2 23,142.50. The straddle of 204 points implies a maximum downside of approximately 23,196, making L5 23,209.32 the straddle-implied floor — a breach of this level would be a volatility event requiring VIX confirmation.
|
▲ Upside Path → OI-R The recovery path in a gap-down scenario moves from BC 23,339.75 (CPR reclaim first hurdle) to Pivot 23,359.20 (mid-CPR confirmation) to TC 23,378.65 (full CPR reclaim, bear structure neutralised) and then to H3 23,457.69 and PDH 23,448.10 (gap-fill and prior-day-high zone). A genuine recovery — not a dead-cat bounce — is confirmed when the 30-minute candle closing above TC 23,378.65 is followed by a second 30-minute candle also closing above TC, per the wide-width confirmation rule applied to any session where the opening breach is deep. |
▼ Downside Path → OI-S The bear path from a gap-down cascades through L3 23,338.51 (converging with BC 23,339.75 as dual breakdown trigger), then L4 23,278.92 (Camarilla breakdown zone — acceleration level where retail stops cluster), then L5 23,209.32 and PDL 23,231.40 (straddle-implied floor zone), with OI support at 23,300 acting as the key PE-writer defense line — a sustained breach of 23,300 removes the put-writing cushion and opens S2 23,142.50 and L6 23,179.85 as bear extension targets. Retail stop-losses below L3 23,338.51 are the primary catalyst for the L3-to-L4 acceleration, making that level the most important intraday trigger for momentum shorts. |
| 🔴 OI-R: The OI resistance at 24,000 is effectively irrelevant as an intraday ceiling in the gap-down scenario — it is too distant (over 600 points above the open in a significant gap-down) to exert gamma pressure, but it does confirm that CE writers are confident price stays well below 24,000, which reinforces the bearish tone and discourages aggressive bull countertrend positions. The 24,000 CE wall represents the weekly structural ceiling that option writers have committed to defending, making any gap-down recovery attempt unlikely to challenge that level within a single session. | 🟢 OI-S: The OI support at 23,300 is the primary bear target and PUT monetisation zone — this is where the highest concentration of PE open interest resides, and put writers at this strike will defend it aggressively, creating a significant demand cluster that intraday bears must break through with sustained volume to extend lower. A decisive close below 23,300 on a 30-minute candle would trigger put-writer stop-outs and delta-hedging by put buyers, creating a self-reinforcing downmove toward L5 23,209.32; conversely, a bounce from 23,300 represents the PUT base defending and can produce sharp short-covering rallies of 50–80 points. |
⚡ Key Trigger: Failure to reclaim BC 23,339.75 within the first 30 minutes of trade confirms bearish resumption — the descending CPR acts as overhead resistance and sellers remain in control as long as price stays below BC 23,339.75. The bull trigger is a 30-minute candle close back above TC 23,378.65 with volume expansion, which would signal that buyers have absorbed the gap-down selling and the CPR band has been reclaimed, shifting bias to neutral-bullish with the first recovery target at PDH 23,448.10.
◆ Near Flat Open — Open ≈ Prev Close (±0.05%)
◆ Neutral
Open lands: A flat open of ±0.05% around prev close 23,398.10 places the opening price between approximately 23,386 and 23,410, which is above TC 23,378.65 and outside the CPR band entirely — in the Descending CPR framework, a flat open lands above TC, meaning the entire CPR band is below price and acts as support.
CPR role: The CPR band (BC 23,339.75 to TC 23,378.65) acts as an immediate support zone below the flat open — the descending CPR in a flat-open scenario creates a 'Desc. Trend Reversal' sub-case where two consecutive sessions trade above the CPR, suggesting hidden strength despite the negative close; the CPR band becomes the decision zone that bulls must hold for the structure to remain positive.
Near Flat (±0.05%)
A flat open near 23,398 on a Descending Medium CPR is a high-information setup — with price already above the entire CPR band (TC 23,378.65 and BC 23,339.75 both below the open), the first 30-minute candle direction IS the trade for the day, as the market has already processed the descending CPR structure and chosen to open above it, creating a 'Desc. Trend Reversal' condition. TC 23,378.65 is the critical bull-hold level: as long as the first 30-minute candle holds above TC 23,378.65, buyers are in structural control and the CPR band functions as support, with the straddle-implied upside range near 23,602 aligning with H5 23,586.88; a breach of TC 23,378.65 on a 30-minute close shifts the structure to bearish, with the CPR band now overhead and BC 23,339.75 converging with L3 23,338.51 as the first bear target cluster. The medium CPR width of 0.17% means this is not a compression day but a balanced session requiring 30-minute confirmation — a 30-minute close above PDH 23,448.10 triggers the bull chain toward H3 23,457.69 and R1 23,487, while a 30-minute close below BC 23,339.75 and L3 23,338.51 opens the bear chain toward S1 23,270.30 and L4 23,278.92. Both bull trigger (hold TC 23,378.65 for 30 minutes, then close above PDH 23,448.10) and bear trigger (30-minute close below BC 23,339.75) are clean, actionable setups with defined abort levels — the pivot at 23,359.20 serves as the intraday neutral line that separates the two camps.
|
▲ Upside Path → OI-R Bull path from TC 23,378.65 (hold confirmation) moves to H3 23,457.69 and PDH 23,448.10 (first partial profit zone and Camarilla mean-reversion target), then H4 23,517.28 (Camarilla breakout trigger requiring 30-minute close for confirmation), then R2 23,575.90 and H5 23,586.88 (straddle-implied ceiling zone). OI resistance at 24,000 is the weekly macro ceiling — not an intraday target from a flat open, but confirming that the broad bull case remains intact structurally if weekly CPR levels above 23,942.55 are eventually reclaimed. |
▼ Downside Path → OI-S Bear path from BC 23,339.75 (30-minute close below confirms breakdown) immediately reaches L3 23,338.51 (dual confluence breakdown trigger — Camarilla L3 and CPR-BC simultaneously), then L4 23,278.92 (Camarilla breakdown acceleration zone, retail stops cluster here), then Traditional S1 23,270.30 and OI support at 23,300 (PUT writer defense — primary downside target). OI-S 23,300 is the key level where put writers engage aggressively; a sustained 30-minute close below 23,300 would open L5 23,209.32 and PDL 23,231.40 as final bear extension targets. |
| 🔴 OI-R: In the flat-open scenario, OI resistance at 24,000 (CE max OI for the week) acts as the distant structural ceiling that CE writers are committed to defending — even in an optimistic flat-open day, the 24,000 level is approximately 600 points above the open, meaning it only becomes relevant in a multi-session recovery context. The CE writing concentration at 24,000 tells traders that the options market consensus expects NIFTY to remain well below 24,000 through the weekly expiry on 15 Sep, reinforcing a short-term range ceiling closer to H4 23,517.28 and R2 23,575.90 for any intraday bull extension. | 🟢 OI-S: OI support at 23,300 (PE max OI for the week) in the flat-open scenario is the critical downside floor that put writers will defend with aggressive selling of puts — this level sits approximately 98 points below the flat open, within the straddle-implied range of 204 points, making it a realistic intraday downside target if the bear trigger fires. A bounce from 23,300 OI-S during the flat-open session would represent classic put-base support action and is the structural level where intraday longs can re-enter with stops below L5 23,209.32. |
⚡ Key Trigger: Bull trigger: first 30-minute candle close above PDH 23,448.10 (clearing both H3 23,457.69 zone and the prior session high) with volume confirms upside momentum toward R1 23,487 and H4 23,517.28. Bear trigger: first 30-minute candle close below BC 23,339.75 (converging with L3 23,338.51) confirms the descending CPR has reasserted resistance and the market is resuming the downtrend, with S1 23,270.30 and L4 23,278.92 as immediate targets — the Pivot at 23,359.20 serves as the intraday neutral fulcrum between these two camps.
BANKNIFTY
Outside — Wide
◆ Neutral
Market Structure Sideways or range-bound | Straddle BANKNIFTY monthly ATM 56,600 straddle priced at 1,312.8 points (Call 818.9 + Put 493.9), implying an expected monthly move of approximately ±1,312.8 points, placing the monthly range between roughly 55,287 and 57,913 — notably, the upper boundary of 57,913 aligns closely with the monthly OI resistance at 57,500 and H6 at 57,568.36, confirming that the options market has priced the ceiling at the primary CE writing wall. | Max Pain BANKNIFTY monthly max pain is 57,500 for the 29-Sep-2026 expiry, sitting approximately 893 points above Thursday's close of 56,606.55 — this confirms a strong gravitational pull higher into month-end, and the 57,500 level coincides exactly with the OI resistance (CE max OI), meaning option sellers at this strike face maximum pain if price exceeds it and will defend it aggressively through the expiry period. |
Tomorrow's Complete Level Map
OI-R: 57,500 R3: 57,881.51 H6: 57,568.36 H5: 57,431.05 R2: 57,263.68 H4 ▶: 57,127.07 R1: 56,935.11 PDH: 56,645.85 H3 ↩: 56,866.81
TC: 56,461.91 P: 56,317.28 BC: 56,172.65
L3 ↩: 56,346.29 PDL: 55,699.45 S1: 55,988.71 L4 ▶: 56,086.03 S2: 55,370.88 L5: 55,782.05 L6: 55,644.74 S3: 55,042.31 OI-S: 56,000
↩ = Camarilla reversal point | ▶ = Camarilla breakout/breakdown trigger | OI-R/OI-S = Options wall (CE/PE max OI)
▲ Higher Open (Gap Up) — Open > Prev Close
▲ Bullish
Open lands: BANKNIFTY's Outside Wide CPR (BC 56,172.65 to TC 56,461.91) engulfs the previous session's range — the previous close of 56,606.55 is ABOVE TC 56,461.91, meaning a flat or minor gap-up open stays above TC and outside the CPR band on the upside. A gap-up open from 56,606.55 opens further above TC 56,461.91, with the entire wide CPR band below price as support.
CPR role: The wide Outside CPR band (BC 56,172.65 to TC 56,461.91) acts as a deep support zone below price in the gap-up scenario — the width of 0.51% means the band covers approximately 289 points of buffer, providing substantial demand absorption capacity if any pullback occurs. The wide CPR also means two 30-minute closes are required before confirming directional intent per the Wide confirmation rule.
Minor Gap (0.05–0.25%) — Structure Dominant
A minor gap up of 0.05–0.25% from 56,606.55 places the open between approximately 56,635 and 56,748, which is above TC 56,461.91 and approaching the PDH at 56,645.85 — for a minor gap, price is effectively opening at or near the prior day's high, which is a natural first resistance in any session. The Outside Wide CPR structure is range-bound by nature, meaning this minor gap-up opening near PDH 56,645.85 faces immediate selling interest from those who missed the prior session's high — two 30-minute candle closes above PDH 56,645.85 are required (Wide CPR rule) before the bull move is confirmed. The first confirmed target is H3 56,866.81 (Camarilla mean-reversion zone — first partial profit), followed by Traditional R1 56,935.11, with OI resistance at 57,500 as the ultimate weekly ceiling.
Significant Gap (0.25–0.5%) — Balanced
A significant gap up of 0.25–0.5% from 56,606.55 opens price between approximately 56,748 and 56,890, placing it above PDH 56,645.85 and inside the Camarilla H3 zone at 56,866.81 — this is a high-risk opening for longs as price is gapping directly into the primary mean-reversion resistance where sellers actively engage. Gap-fill risk is very high in this scenario because the Outside Wide CPR structure implies range-bound behavior, and an opening above H3 56,866.81 with two 30-minute closes required for confirmation means price has 60 minutes to either consolidate or fade back toward PDH 56,645.85 and TC 56,461.91. If two 30-minute candles close above H3 56,866.81, delta-hedging flow from call writers accelerates toward H4 57,127.07 and R1 56,935.11, with the OI resistance wall at 57,500 as the gamma-squeeze ceiling.
Large Gap (>0.5%) — Gap Direction Dominant
A large gap up exceeding 0.5% opens price above H3 56,866.81 and potentially above R1 56,935.11 — this is an exceptional opening for BANKNIFTY that would place price within striking distance of H4 57,127.07 and R2 57,263.68. In an Outside Wide CPR, a large gap retains outside-CPR dynamics regardless of the gap, meaning the wide band's range-bound nature is now fully overridden by gap momentum — two 30-minute candle closes above H4 57,127.07 would confirm a genuine breakout toward OI resistance at 57,500, which coincides with H5 57,431.05 and H6 57,568.36 as the straddle-implied ceiling. The abort level in a large-gap bull scenario is a failure below PDH 56,645.85 on a 30-minute close, which would signal a gap-and-trap and trigger aggressive profit-booking back toward TC 56,461.91.
|
▲ Upside Path → OI-R Confirmed bull path requires two 30-minute closes above PDH 56,645.85, targeting H3 56,866.81 (first partial profit — Camarilla mean-reversion zone where sellers are active), then H4 57,127.07 (breakout trigger — two 30-minute closes above H4 needed for confirmation), then R2 57,263.68 and H5 57,431.05, with the OI resistance wall at 57,500 as the ultimate ceiling where CE writers defend maximum pain for the monthly expiry. Genuine momentum is confirmed when intraday pullbacks to H3 56,866.81 hold as support and volume remains above average on the upside candles. |
▼ Downside Path → OI-S Failure path from a gap-up: rejection at PDH 56,645.85 or H3 56,866.81 sends price back toward TC 56,461.91 (top of wide CPR band — first intraday support), then Pivot 56,317.28 (mid-CPR level), then BC 56,172.65 (bottom of wide CPR — critical support), and then OI support at 56,000 (PE writing wall, primary floor). A 30-minute close below BC 56,172.65 is the structural breakdown signal that flips the gap-up bull scenario into a full reversal bear day, opening L4 56,086.03 and S1 55,988.71 as the next targets. |
| 🔴 OI-R: The OI resistance at 57,500 (CE max OI for the monthly expiry coinciding with monthly max pain at 57,500) is the absolute ceiling for any gap-up bull extension — CE writers have positioned their maximum writing concentration here, meaning gamma-hedging selling pressure accelerates exponentially as price approaches 57,500. In a gap-up scenario, 57,500 functions as the target-and-fade level: a move toward 57,500 intraday triggers aggressive CE writing and short-selling from institutional desks, making it a profit-booking zone rather than a level to chase longs. | 🟢 OI-S: The OI support at 56,000 (PE max OI for the month) is the primary downside floor in the gap-up scenario — even if the gap-up fails, put writers at 56,000 will defend aggressively, meaning a drop toward 56,000 is more likely to bounce than break in a single session. The 56,000 PE wall is approximately 607 points below the close of 56,606.55, well within the straddle-implied range of 1,312.8 points, making it a realistic intraday downside target if the gap-up fails and bears gain control. |
⚡ Key Trigger: The primary bull trigger in a gap-up scenario is two consecutive 30-minute candle closes above PDH 56,645.85 (Wide CPR rule), confirming that the prior session's high has been absorbed and buyers are in control with the next target being H3 56,866.81. Failure to produce two 30-minute closes above PDH 56,645.85 — especially if the second 30-minute candle closes below it — signals a gap-and-trap scenario where the Outside Wide CPR's range-bound structure reasserts and price fades toward TC 56,461.91 and Pivot 56,317.28.
▼ Lower Open (Gap Down) — Open < Prev Close
▼ Bearish
Open lands: A gap-down open from 56,606.55 on an Outside Wide CPR (BC 56,172.65 to TC 56,461.91) places price either above TC 56,461.91 for a very minor gap, inside the wide CPR band for a minor-to-significant gap (between BC 56,172.65 and TC 56,461.91), or below BC 56,172.65 for a large gap — the key characteristic of Outside CPR is that the prev close was above TC, so the entire wide band is now below, and price dropping into the band enters a wide support zone.
CPR role: The wide Outside CPR band (BC 56,172.65 to TC 56,461.91) acts as a broad battleground support zone in the gap-down scenario — the 289-point wide band absorbs gap-down pressure and requires two 30-minute candle closes (Wide CPR rule) before a directional bias is confirmed. Entry inside the band is considered neutral until a close above TC 56,461.91 (bullish reclaim) or below BC 56,172.65 (bearish breakdown) is produced.
Minor Gap (0.05–0.25%) — Structure Dominant
A minor gap down of 0.05–0.25% from 56,606.55 opens price between approximately 56,465 and 56,578 — just at or slightly below TC 56,461.91 (top of the wide CPR band), placing price at the cusp of re-entering the wide Outside CPR band. The minor gap here is a critical test of TC 56,461.91 as support: a 30-minute candle that holds above TC 56,461.91 suggests gap-fill intent back toward PDH 56,645.85 and prev close 56,606.55, while a 30-minute close below TC 56,461.91 draws price into the wide CPR band toward Pivot 56,317.28 and L3 56,346.29 (which converges tightly with Pivot — a strong dual-support zone). The wide CPR rule requires two 30-minute closes below TC to confirm sustained weakness into the band.
Significant Gap (0.25–0.5%) — Balanced
A significant gap down of 0.25–0.5% opens price between approximately 56,325 and 56,465, placing it inside the wide CPR band near the Pivot at 56,317.28 and L3 at 56,346.29 — a very contested zone. A 30-minute close below Pivot 56,317.28 and L3 56,346.29 (dual breakdown trigger) opens BC 56,172.65 as the next downside target; however, PUT writers at OI-S 56,000 are aware that price is approaching their defense zone at roughly 317 points below, and they may step in aggressively near BC 56,172.65. Two 30-minute closes below BC 56,172.65 (Wide CPR rule) would confirm a genuine breakdown toward S1 55,988.71, L4 56,086.03, and OI-S 56,000.
Large Gap (>0.5%) — Gap Direction Dominant
A large gap down exceeding 0.5% opens price below BC 56,172.65 and potentially near L4 56,086.03 or OI-S 56,000 — this is a structural breakdown event where the wide Outside CPR band has been breached at the open. The panic-versus-recovery dynamic in BANKNIFTY is particularly sharp given its beta: if price opens at or near OI-S 56,000 (PE max OI), put writers defend aggressively and a violent snap-back rally toward BC 56,172.65 and Pivot 56,317.28 within the first 30 minutes is the highest-probability scenario (classic OI-S defense). If OI-S 56,000 breaks on two 30-minute closes, straddle monetisation accelerates sharply toward L5 55,782.05 and PDL 55,699.45 as the next major downside landmarks.
|
▲ Upside Path → OI-R Recovery path moves from BC 56,172.65 (two 30-min closes above BC needed) to Pivot 56,317.28 (mid-CPR confirmation) to TC 56,461.91 (full CPR reclaim — bull structure restored) to PDH 56,645.85 (gap-fill target) and H3 56,866.81 (Camarilla mean-reversion zone). A genuine recovery is distinguished from a dead-cat bounce when the second 30-minute candle above TC 56,461.91 also holds TC as support on a retest before extending toward PDH. |
▼ Downside Path → OI-S Bear path cascades from L3 56,346.29 (Camarilla L3 and near-Pivot confluence — first bear target), through BC 56,172.65 (CPR band bottom breakdown), to L4 56,086.03 (Camarilla breakdown trigger — retail stops concentrate here), then OI-S 56,000 (PE writing wall — primary downside target), and if breached, L5 55,782.05 and PDL 55,699.45. The L3-to-L4 move of approximately 260 points is where stop-loss cascades typically accelerate in BANKNIFTY, making L3 56,346.29 the most important near-term bear trigger for momentum shorts. |
| 🔴 OI-R: The OI resistance at 57,500 (CE max OI, monthly max pain level) is entirely irrelevant as an intraday ceiling in a gap-down scenario — at 893+ points above the open, it provides no gamma pressure on the day. It does, however, confirm the structural bearish narrative: CE writers are not concerned about upside risk above 57,500 even with price falling below the CPR band, suggesting institutional confidence that any bounce will not threaten their short-call positions through expiry. | 🟢 OI-S: The OI support at 56,000 (PE max OI for the month) is the single most important level to monitor in the gap-down scenario — it is both the primary bear target AND the key defense level where put writers will fight to prevent a close below. A decisive two 30-minute candle closes below 56,000 would be a historic breakdown in OI structure, triggering put-writer stop-outs and creating delta-hedging selling pressure that pushes toward L5 55,782.05 and L6 55,644.74 as the next Camarilla downside extension targets. |
⚡ Key Trigger: The primary bear trigger is two 30-minute candle closes below BC 56,172.65 — this confirms that the wide Outside CPR band has been fully breached and sellers are in structural control, with OI-S 56,000 and L4 56,086.03 as immediate targets. The bull reclaim trigger is a 30-minute close back above TC 56,461.91, after which a second 30-minute close above TC confirms CPR reclaim and shifts bias to bullish recovery toward PDH 56,645.85 and H3 56,866.81.
◆ Near Flat Open — Open ≈ Prev Close (±0.05%)
◆ Neutral
Open lands: A flat open of ±0.05% around prev close 56,606.55 places the opening price between approximately 56,578 and 56,635 — this is above TC 56,461.91, placing price outside and above the entire Outside Wide CPR band. In the Outside CPR framework with prev close above TC, a flat open creates a sideways decision zone above the wide band.
CPR role: The wide Outside CPR band (BC 56,172.65 to TC 56,461.91) acts as a deep support decision zone approximately 145–434 points below the flat open — in a flat-open scenario above the wide CPR, the band provides substantial structural support and any intraday drop into the band (below TC 56,461.91) should be treated as a buying opportunity until two 30-minute closes below BC 56,172.65 confirm a genuine breakdown. The flat-open energy dissipates inside the wide band if price falls into it.
Near Flat (±0.05%)
A flat open near 56,606.55 on an Outside Wide CPR is the highest-information setup this index produces — with price above the entire 289-point wide CPR band, the session is a pure breakout-or-breakdown read with the wide band providing a meaningful buffer. In a flat-open sideways structure, the first meaningful directional signal comes from whether PDH 56,645.85 is challenged on the upside or whether TC 56,461.91 is tested on the downside — two 30-minute closes above PDH 56,645.85 confirm bullish intent toward H3 56,866.81 and R1 56,935.11, while a single 30-minute close below TC 56,461.91 draws price into the wide CPR band's battleground zone toward Pivot 56,317.28 and L3 56,346.29. The sideways market structure and Outside Wide CPR combination strongly implies a range-bound session where fading moves toward Camarilla extremes (H3 56,866.81 on the upside, L3 56,346.29 on the downside) is the highest-probability strategy. The wide CPR confirmation rule of two 30-minute closes applies to any direction, meaning traders should avoid premature conviction — wait for two confirmed 30-minute candles before committing to a directional trade, and set profit targets at the first Traditional level (R1 56,935.11 for bulls, S1 55,988.71 for bears) rather than trailing beyond OI walls.
|
▲ Upside Path → OI-R Bull path from flat open moves to PDH 56,645.85 (two 30-min closes required for confirmation), then H3 56,866.81 (first partial profit — Camarilla mean-reversion zone, fade risk here), then R1 56,935.11 (Traditional first target — exit per Wide CPR rule), then H4 57,127.07 and OI resistance at 57,500. Per the Wide CPR rule, profits should be taken at R1 56,935.11 and NOT trailed beyond OI-R 57,500 unless H4 57,127.07 is decisively cleared on two 30-minute closes. |
▼ Downside Path → OI-S Bear path from TC 56,461.91 (two 30-min closes below required) drops to L3 56,346.29 (Camarilla L3 near Pivot 56,317.28 — dual support, first bear target), then BC 56,172.65 (CPR base — two 30-min closes below confirm full breakdown), then L4 56,086.03 (Camarilla breakdown trigger) and OI support at 56,000 (PE writing wall — primary downside target and profit-booking zone per Wide CPR rule). Do NOT trail shorts beyond 56,000 without two 30-minute closes below, as PUT writers at this level defend aggressively. |
| 🔴 OI-R: In the flat-open scenario, OI resistance at 57,500 (CE max OI and monthly max pain level) functions as the long-term session ceiling that CE writers have committed to defending — even in a bullish flat-open scenario, 57,500 is approximately 893 points away, making it a weekly destination rather than an intraday target. CE writing concentration at 57,500 means any intraday rally that approaches H5 57,431.05 or H6 57,568.36 will face exponentially increasing selling pressure from market makers delta-hedging their gamma exposure at the 57,500 strike. | 🟢 OI-S: OI support at 56,000 (PE max OI for the month) in the flat-open scenario is the key downside anchor — even if bears gain control and push below the wide CPR band, 56,000 is the level where the most aggressive put-writing defense occurs, creating a demand wall that can produce 200–400 point snap-back rallies in BANKNIFTY. The 56,000 level is approximately 607 points below the flat open of 56,606.55, within the straddle-implied range of 1,312.8 points, making it a realistic but extreme downside target only accessible if both the wide CPR band AND OI-S are breached on a sustained basis. |
⚡ Key Trigger: Bull trigger: two 30-minute candle closes above PDH 56,645.85 confirms upside momentum, with H3 56,866.81 and R1 56,935.11 as the first targets. Bear trigger: a single 30-minute close below TC 56,461.91 followed by a second 30-minute close below TC draws price into the wide CPR band toward Pivot 56,317.28 — the structural fulcrum between the two camps is PDH 56,645.85 above and TC 56,461.91 below, with the flat-open zone of 56,578–56,635 sitting in the middle of this 184-point decision channel.
SENSEX
Descending — Wide
▼ Bearish
Market Structure Sideways or range-bound | Straddle SENSEX weekly ATM 74,800 straddle priced at 933.55 points (Call 568.65 + Put 364.9), implying an expected weekly move of approximately ±933.55 points, placing the weekly range between roughly 73,866 and 75,734 — the upper boundary of 75,734 sits above PDH 74,917.15 but below R1 75,079.22 and OI resistance at 75,000, confirming that the options market has priced the ceiling at the primary CE writing wall. | Max Pain SENSEX weekly max pain is 74,800 for the 17-Sep-2026 expiry, exactly at the ATM straddle strike and current PDC 74,781.76 (within 18 points), meaning option sellers face minimum pain if SENSEX expires right at the close — this is a strong gravitational pin signal for the weekly expiry and implies the market is already at max pain equilibrium, with any move away from 74,800 creating mounting pressure for reversion. |
Tomorrow's Complete Level Map
OI-R: 75,000 R3: 75,836.21 H6: 75,545.09 H5: 75,441.24 R2: 75,376.68 H4 ▶: 75,198.10 R1: 75,079.22 PDH: 74,917.15 H3 ↩: 74,989.93
TC: 74,700.73 P: 74,619.69 BC: 74,538.65
L3 ↩: 74,573.59 PDL: 74,160.16 S1: 74,322.23 L4 ▶: 74,365.42 S2: 73,862.70 L5: 74,122.28 L6: 74,018.43 S3: 73,565.24 OI-S: 70,000
↩ = Camarilla reversal point | ▶ = Camarilla breakout/breakdown trigger | OI-R/OI-S = Options wall (CE/PE max OI)
▲ Higher Open (Gap Up) — Open > Prev Close
▲ Bullish
Open lands: SENSEX has a Descending Wide CPR — TC is 74,700.73 and BC is 74,538.65, both below the previous close of 74,781.76. A gap-up open places price ABOVE TC 74,700.73 and above the entire descending CPR band, following the 'Desc. Trend Reversal' sub-case where price opens above the entire CPR for the second consecutive session, signalling hidden strength that contradicts the descending structure.
CPR role: The wide CPR band (BC 74,538.65 to TC 74,700.73) acts as a launch pad support below price in the gap-up scenario — the wide width of 0.22% means two 30-minute candle closes are required to confirm any directional move (Wide CPR rule), and the 162-point wide band provides meaningful support if price attempts a pullback from the gap-up open.
Minor Gap (0.05–0.25%) — Structure Dominant
A minor gap up of 0.05–0.25% from 74,781.76 opens SENSEX between approximately 74,819 and 74,969 — above TC 74,700.73 and approaching the PDH at 74,917.15, with the Camarilla H3 at 74,989.93 sitting just above. The descending wide CPR creates an interesting structural conflict: the gap-up opens above the CPR, confirming the 'Desc. Trend Reversal' dynamic, but the wide CPR confirmation rule requires two 30-minute closes to validate any directional move, meaning premature longs near PDH 74,917.15 are risky. The first confirmed target after two 30-minute closes above PDH 74,917.15 is H3 74,989.93 (also coinciding with OI resistance at 75,000 — a powerful dual ceiling), followed by Traditional R1 75,079.22.
Significant Gap (0.25–0.5%) — Balanced
A significant gap up of 0.25–0.5% from 74,781.76 opens price between approximately 74,969 and 75,156 — directly into the H3 74,989.93 and OI resistance 75,000 zone simultaneously, making this a very high-risk opening for longs. The gap-fill risk here is extreme: opening at or above 75,000 (the CE max OI for the week) immediately triggers delta-hedging selling pressure from market makers who are short calls at this strike, and two 30-minute candle closes above 75,000 are required to overcome this resistance. If confirmed above 75,000 on two 30-minute closes, H4 75,198.10 and R1 75,079.22 become the next targets, but the weekly straddle ceiling at 75,734 limits further extension significantly.
Large Gap (>0.5%) — Gap Direction Dominant
A large gap up exceeding 0.5% opens SENSEX above H4 75,198.10 and potentially above R1 75,079.22 — this would be an exceptional opening that fully overrides the descending wide CPR structure. A large gap above R1 75,079.22 places price near the weekly straddle-implied ceiling of 75,734 and within striking distance of R2 75,376.68 and H5 75,441.24 — the straddle premium would be heavily eroded on the call side, triggering aggressive CE monetisation selling from put-call writers. Abort level for large-gap bulls is a failure to hold TC 74,700.73 on a 30-minute close, which converts the large gap into a significant bull trap that would see aggressive profit-booking back toward Pivot 74,619.69 and BC 74,538.65.
|
▲ Upside Path → OI-R Confirmed bull path from gap-up: two 30-minute closes above PDH 74,917.15 targets H3 74,989.93 and OI resistance 75,000 (first partial profit — do NOT hold through 75,000 without two more 30-minute confirms above OI-R per Wide CPR rule), then R1 75,079.22 (Traditional first target — profit booking zone), then H4 75,198.10 and R2 75,376.68 only if OI resistance is cleared with volume. The 75,000 OI-R is the decisive ceiling — partial profits should be taken at 74,989.93 and the position managed with trailing stops if 75,000 is decisively crossed. |
▼ Downside Path → OI-S Failure path from gap-up: rejection at PDH 74,917.15 or OI-R 75,000 sends price back toward TC 74,700.73 (two 30-min closes below TC needed to confirm weakness), then Pivot 74,619.69 (mid-CPR level, secondary support), then BC 74,538.65 (CPR base, critical support), and then L3 74,573.59 (converging tightly with BC — dual support that if broken on two 30-min closes opens S1 74,322.23 and L4 74,365.42). The max pain pin at 74,800 also creates a gravitational pull that limits both upside extension and downside breakdown, reinforcing the mean-reversion nature of any gap-up on expiry-week SENSEX. |
| 🔴 OI-R: The OI resistance at 75,000 (CE max OI for SENSEX weekly expiry on 17-Sep-2026) is the most critical level in the gap-up scenario — CE writers have concentrated their maximum writing at exactly 75,000, creating a gamma wall that forces market makers to sell futures as price approaches this strike (delta-hedging their short gamma). This means 75,000 acts as a magnetic ceiling: price can approach but getting through requires exceptional buying volume to offset the systematic delta-hedging selling, making partial profit-booking at 74,989.93 (H3) the disciplined trade before committing to a breakout above 75,000. | 🟢 OI-S: The OI support at 70,000 (PE max OI for SENSEX monthly expiry) is irrelevant as an intraday support level in the gap-up scenario — at 4,781 points below the close of 74,781.76, it is a monthly structural anchor rather than a session reference. Its distance from current price confirms that put writers at the 70,000 strike are deeply out of the money and face no immediate risk, which reinforces the bullish overall put-writing structure for the month but provides no actionable intraday guidance. |
⚡ Key Trigger: The primary bull trigger in the gap-up scenario is two consecutive 30-minute candle closes above PDH 74,917.15 — but this trigger must also account for the OI resistance at 75,000 sitting only 82.85 points above PDH, meaning the real trigger for momentum buying is a two 30-minute close above 75,000 with volume. Failure of the first two 30-minute candles to both close above PDH 74,917.15 signals exhaustion near the top of the weekly range and triggers a CPR-band retest move toward TC 74,700.73 and Pivot 74,619.69.
▼ Lower Open (Gap Down) — Open < Prev Close
▼ Bearish
Open lands: A gap-down open on a Descending Wide CPR — with TC 74,700.73 and BC 74,538.65 both below prev close 74,781.76 — places a minor gap-down open inside the wide CPR band (between 74,538.65 and 74,700.73), while a significant gap places it below BC 74,538.65. This is the primary bearish scenario for SENSEX as the descending structure now fully aligns with the gap-down direction.
CPR role: The wide CPR band (BC 74,538.65 to TC 74,700.73) acts as overhead resistance in the gap-down scenario — any recovery attempt must fight through the full 162-point wide band before reclaiming TC, and the wide CPR confirmation rule (two 30-minute closes) makes recovery slow and difficult. The band is a 'trap door' in this configuration: price falling through BC 74,538.65 on two consecutive 30-minute closes confirms full abandonment of CPR support.
Minor Gap (0.05–0.25%) — Structure Dominant
A minor gap down of 0.05–0.25% from 74,781.76 opens SENSEX between approximately 74,595 and 74,744 — inside the wide CPR band (BC 74,538.65 to TC 74,700.73), placing price in the heart of the descending CPR's support-and-resistance battleground. A 30-minute close above TC 74,700.73 suggests gap-fill recovery toward prev close 74,781.76 and PDH 74,917.15, while a 30-minute close below Pivot 74,619.69 and then BC 74,538.65 confirms bearish dominance with L3 74,573.59 (near-BC — dual cluster) as the first bear trigger and S1 74,322.23 as the next target. The wide CPR rule means two 30-minute closes are needed below BC 74,538.65 before committing to shorts targeting L4 74,365.42.
Significant Gap (0.25–0.5%) — Balanced
A significant gap down of 0.25–0.5% from 74,781.76 opens price between approximately 74,594 and 74,594 — wait, a 0.25% gap down from 74,781.76 is approximately 74,594 and a 0.5% gap is approximately 74,407, placing price between BC 74,538.65 and L4 74,365.42. This is a critical opening that tests the bottom of the wide CPR band and the L3 74,573.59 / L4 74,365.42 Camarilla downside zone simultaneously — a 30-minute close below BC 74,538.65 followed by a second 30-minute close below L3 74,573.59 (note: L3 is ABOVE BC here at 74,573.59 vs BC 74,538.65, making L3 a near-BC resistance on the downside) confirms breakdown toward S1 74,322.23 and L4 74,365.42. PUT writers at OI-S 70,000 are so far out of the money that they provide no near-term floor defense, making S1 74,322.23 and L4 74,365.42 the practical bear targets.
Large Gap (>0.5%) — Gap Direction Dominant
A large gap down exceeding 0.5% opens SENSEX below 74,407 — below BC 74,538.65 and into the L4 74,365.42 / S1 74,322.23 support cluster, which is the primary institutional accumulation zone. This is a panic-level opening for SENSEX that tests the bottom of the straddle-implied range (74,781.76 minus 933.55 = 73,848.21), and a large gap down approaching S1 74,322.23 places price near the straddle's expected floor — at this level, straddle monetisation by PUT sellers accelerates, meaning mean-reversion buying from delta-neutral desks supports a recovery. Two 30-minute closes below S1 74,322.23 would be a bearish extension signal targeting S2 73,862.70, which aligns with the straddle's maximum downside of 73,848.21 — a rare convergence suggesting S2 73,862.70 is the true structural floor for the week.
|
▲ Upside Path → OI-R Recovery path: two 30-minute closes above TC 74,700.73 (CPR band reclaim confirmed), then PDH 74,917.15 (gap-fill target and natural resistance), then H3 74,989.93 and OI resistance 75,000 (dual ceiling — partial profit zone). A genuine recovery from a gap-down is distinguished from a bounce when the 30-minute candle that reclaims TC 74,700.73 also exceeds the prior candle's high (expanding range), confirming absorption of supply in the wide CPR band. |
▼ Downside Path → OI-S Bear path cascades from L3 74,573.59 (Camarilla L3 just above BC 74,538.65 — treat as near-simultaneous trigger zone), through BC 74,538.65 (CPR base breakdown — two 30-min closes), to L4 74,365.42 (Camarilla breakdown trigger — retail stops flood in here), then S1 74,322.23 (Traditional first target — first partial profit for bears), then L5 74,122.28 and PDL 74,160.16 (straddle-implied floor zone for the week). OI support at 70,000 is entirely irrelevant as an intraday floor — do not use it for intraday profit targets. |
| 🔴 OI-R: The OI resistance at 75,000 (CE max OI for the weekly expiry) is irrelevant as an intraday ceiling in the gap-down scenario — at approximately 219–593 points above the gap-down open range, it merely confirms that CE writers are comfortable with price staying below 75,000 and provides no actionable gamma pressure for the session. Its primary value in a gap-down scenario is as a reference confirming the structural ceiling that prevents any recovery from becoming a meaningful breakout. | 🟢 OI-S: The OI support at 70,000 (PE max OI for the monthly expiry) is entirely too distant to function as an intraday floor in the gap-down scenario — at over 4,700 points below price, PE writers at 70,000 face no delta-hedging pressure regardless of the session's severity. The practical floor levels are L5 74,122.28 and PDL 74,160.16 for this session, with S2 73,862.70 aligning with the weekly straddle's maximum downside of approximately 73,848 serving as the extreme weekly bear scenario floor. |
⚡ Key Trigger: The primary bear trigger is two consecutive 30-minute candle closes below BC 74,538.65 — in the descending wide CPR, BC 74,538.65 is the final CPR support, and two 30-minute closes below it confirm full CPR abandonment with targets at L4 74,365.42 and S1 74,322.23. Bull reclaim trigger: a 30-minute close back above TC 74,700.73 followed by a second 30-minute close above TC shifts the day to neutral-bullish, with recovery targets at PDH 74,917.15 and H3 74,989.93.
◆ Near Flat Open — Open ≈ Prev Close (±0.05%)
◆ Neutral
Open lands: A flat open of ±0.05% around prev close 74,781.76 places SENSEX between approximately 74,744 and 74,819 — this is above TC 74,700.73, placing price above the entire descending wide CPR band. This mirrors the 'Desc. Trend Reversal' scenario where two sessions open above the descending CPR, signalling persistent buyer interest despite the bearish CPR structure.
CPR role: The wide CPR band (BC 74,538.65 to TC 74,700.73) acts as a deep support zone approximately 82–243 points below the flat open — the 162-point wide band provides meaningful demand absorption buffer. In the flat-open scenario above the entire descending wide CPR, the band is a 'launch pad' as long as price stays above TC 74,700.73, and any test of TC within the session should be treated as a potential retest entry opportunity rather than a breakdown signal.
Near Flat (±0.05%)
A flat open near 74,781.76 on a Descending Wide CPR with the entire band below price is one of the most information-rich setups for SENSEX — the market is essentially confirming that buyers have absorbed the descending CPR's overhead pressure for two sessions and price is hovering above the full wide band. TC 74,700.73 is the critical structural level: a flat open 81 points above TC means the opening zone (74,744–74,819) is the intraday decision channel — a 30-minute close above PDH 74,917.15 opens the bull path toward H3 74,989.93 and the OI resistance at 75,000, while a 30-minute close below TC 74,700.73 drops price into the wide CPR band and shifts the risk to the downside toward Pivot 74,619.69 and BC 74,538.65. The wide CPR confirmation rule (two 30-minute closes in either direction) is mandatory — premature directional trades in the first 30 minutes risk being caught in the natural oscillation within the 74,700–74,919 zone. The max pain pin at 74,800 for the weekly expiry (17-Sep-2026) sits almost exactly at the flat open, creating a powerful gravitational force that may pin SENSEX in a narrow 74,700–74,917 range for much of the session — this is the most important context for expiry-week flat opens.
|
▲ Upside Path → OI-R Bull path from the flat open moves to PDH 74,917.15 (two 30-min closes required — prior session high and first resistance), then H3 74,989.93 (Camarilla mean-reversion zone — first partial profit AND converging with OI resistance at 75,000), then R1 75,079.22 (Traditional first target — exit point per Wide CPR rule). Do NOT hold above OI resistance 75,000 without two 30-minute closes above 75,000, as CE writers will defend this level aggressively given it is the weekly max CE writing concentration through the 17-Sep expiry. |
▼ Downside Path → OI-S Bear path from TC 74,700.73 (two 30-min closes below required) drops to Pivot 74,619.69 (mid-CPR level — secondary support, partial bear target), then BC 74,538.65 (CPR base — two 30-min closes below opens full breakdown), then L3 74,573.59 (Camarilla L3, near-BC dual cluster — note L3 is slightly above BC, treating the 74,538–74,574 band as the primary bear trigger zone), then L4 74,365.42 (Camarilla breakdown trigger and Traditional S1 74,322.23 confluence — first major bear target). OI support at 70,000 is too distant for intraday reference; PDL 74,160.16 and L5 74,122.28 serve as the practical extreme downside targets for the session. |
| 🔴 OI-R: In the flat-open scenario, OI resistance at 75,000 (CE max OI for the 17-Sep weekly expiry) is the single most critical level to watch — it is only 218.24 points above the flat open, well within the straddle-implied weekly range of ±933.55 points, making it an extremely realistic intraday target. CE writing concentration at 75,000 creates the gamma wall that defines the session's upside ceiling: market makers systematically sell futures as price approaches 75,000, and only a volume-driven breakout (two 30-minute closes above 75,000) can push toward R1 75,079.22 — this makes the 74,989.93 H3 / 75,000 OI-R zone the primary intraday battleground in the flat-open bull scenario. | 🟢 OI-S: OI support at 70,000 (PE max OI for SENSEX monthly expiry) in the flat-open scenario is irrelevant as an intraday floor — it is over 4,700 points below the opening level and puts at 70,000 are so deeply out of the money that they impose no delta-hedging pressure on the session whatsoever. The practical put-base for this session is the max pain level at 74,800 (weekly expiry), which creates its own form of 'gravitational OI support' as weekly option sellers defend the 74,800 pin — this is more relevant than the 70,000 monthly OI-S for Monday's intraday session. |
⚡ Key Trigger: Bull trigger: two 30-minute candle closes above PDH 74,917.15 with volume expansion confirms upside momentum, opening the path toward H3 74,989.93 and OI resistance at 75,000 — the 75,000 CE wall is only 218.24 points above the flat open, making it the key test level for any bull day. Bear trigger: a 30-minute close below TC 74,700.73 followed by a second 30-minute close below TC (Wide CPR rule) confirms that the descending CPR is reasserting overhead pressure, with Pivot 74,619.69 and BC 74,538.65 as the bear targets — the max pain pin at 74,800 makes both triggers less reliable than in a non-expiry environment, so volume confirmation is essential.
📊 VIX Insight: India VIX data is unavailable for this analysis session, which removes one of the key implied volatility gauges for session sizing and premium direction. In the absence of VIX data, traders should rely on straddle pricing as the primary volatility proxy — NIFTY weekly straddle of 204 points implies approximately ±0.87% expected move, while SENSEX weekly straddle of 933.55 points and BANKNIFTY monthly straddle of 1,312.8 points both suggest contained but non-trivial expected volatility. The historical context of NIFTY trading below its weekly CPR at 23,942.55 and monthly CPR at 24,282.77 suggests elevated structural risk, and if VIX were available, a reading above 15 would corroborate the straddle-implied volatility expansion that the premium levels suggest.
Overall View:
All three indices head into Monday's session with bearish structural CPR configurations — NIFTY's Descending Medium CPR and SENSEX's Descending Wide CPR both sit below their respective closes, while BANKNIFTY's Outside Wide CPR has its close above TC, creating a divergent backdrop where BANKNIFTY is relatively stronger. The critical cross-index observation is that all three indices are trading significantly below their weekly and monthly CPR pivots (NIFTY below 23,942.55, BANKNIFTY below 57,405.93, SENSEX below 76,627.67), confirming a multi-session bearish macro structure that can only be neutralised by strong gap-up opens reclaiming these weekly levels. The OI structure — NIFTY weekly max pain at 23,450 near current price, SENSEX weekly max pain at 74,800 near current price, and BANKNIFTY monthly max pain at 57,500 well above — suggests selective expiry-week pinning for NIFTY and SENSEX while BANKNIFTY has room to move higher toward its OI ceiling.
All three indices head into Monday's session with bearish structural CPR configurations — NIFTY's Descending Medium CPR and SENSEX's Descending Wide CPR both sit below their respective closes, while BANKNIFTY's Outside Wide CPR has its close above TC, creating a divergent backdrop where BANKNIFTY is relatively stronger. The critical cross-index observation is that all three indices are trading significantly below their weekly and monthly CPR pivots (NIFTY below 23,942.55, BANKNIFTY below 57,405.93, SENSEX below 76,627.67), confirming a multi-session bearish macro structure that can only be neutralised by strong gap-up opens reclaiming these weekly levels. The OI structure — NIFTY weekly max pain at 23,450 near current price, SENSEX weekly max pain at 74,800 near current price, and BANKNIFTY monthly max pain at 57,500 well above — suggests selective expiry-week pinning for NIFTY and SENSEX while BANKNIFTY has room to move higher toward its OI ceiling.
Disclaimer: KRV Prime provides educational and informational content relating to financial markets. Articles, research, examples, charts, strategies and tools are provided for educational purposes and should not be interpreted as personalised investment advice or a guarantee of financial performance. Markets involve risk, including possible loss of capital. Past performance does not guarantee future results. KRV Prime is not a SEBI Registered Investment Adviser or Research Analyst.