
Index Analysis
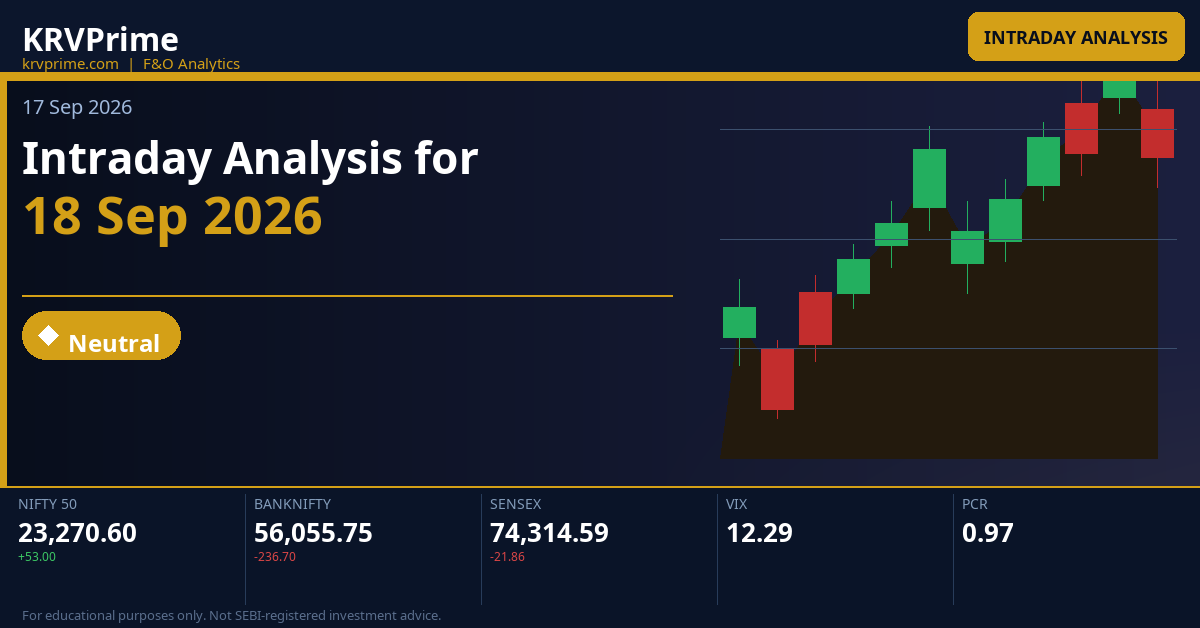
Intraday Analysis for 18 Sep 2026
KRV Prime17 September 202656 min
Educational/Derived AnalysisSource: KRV Prime Market Insights (End-of-Day)As of 17 Sep 2026, 04:33 PM IST
Intraday Analysis for 18 Sep 2026
Heading into 18 Sep 2026, markets present a mixed yet structurally nuanced picture: NIFTY closed marginally higher at **23,270.60 (+0.23%)** while BANKNIFTY slipped to **56,055.75 (-0.42%)** and SENSEX ended nearly flat at **74,314.59 (-0.03%)**, reflecting divergence between largecap and banking indices. India VIX data is unavailable for this session, making it critical to lean heavily on CPR structure, OI positioning, and straddle premiums to gauge implied volatility expectations — the NIFTY weekly straddle of **239.25 points** and monthly straddle of **386.65 points** suggest the market is pricing in a contained move, reinforcing a bias toward range-bound to mildly directional trading. Traders should watch whether NIFTY can defend its ascending narrow CPR band (BC 23,273.26 — TC 23,278.60) as a launching pad while BankNifty's wide overlapping CPR (BC 56,138.67 — TC 56,304.47) continues to act as a contested battleground.
Key Market Signals — Intraday Setup
All three indices are trading below their respective Weekly CPR pivot levels (NIFTY Weekly P: 23,506.50; BankNifty Weekly P: 56,577.62; Sensex Weekly P: 75,139.70), confirming broad weekly bearish structure even as NIFTY's ascending narrow daily CPR hints at intraday bullish potential — this divergence between daily and weekly structure demands caution and strict level-based trade management.
Deep Technical Analysis & Levels
NIFTY
Ascending — Narrow (Width: 0.02%)
▲ Bullish
Market Structure Trending (up or down trend) | Straddle ATM 23,250 — Weekly straddle at **239.25 pts** (Call 158.00 + Put 81.25) implies an expected intraday move of approximately ±239 points from 23,250, defining a range of roughly 23,011 to 23,489 for the weekly expiry; the skew toward calls (158 vs 81.25) indicates mild bullish premium bias with puts relatively cheaper, suggesting the market is more fearful of upside extension than downside. | Max Pain Weekly Max Pain at **23,300** (expiry 22-Sep-2026) — price is currently 29.40 points below max pain at 23,270.60, creating a gravitational pull toward 23,300 as option sellers defend this strike; expect intermittent buying pressure near current levels as market makers attempt to pin expiry near this zone, making 23,300 a key magnetic level for the session. |
Tomorrow's Complete Level Map
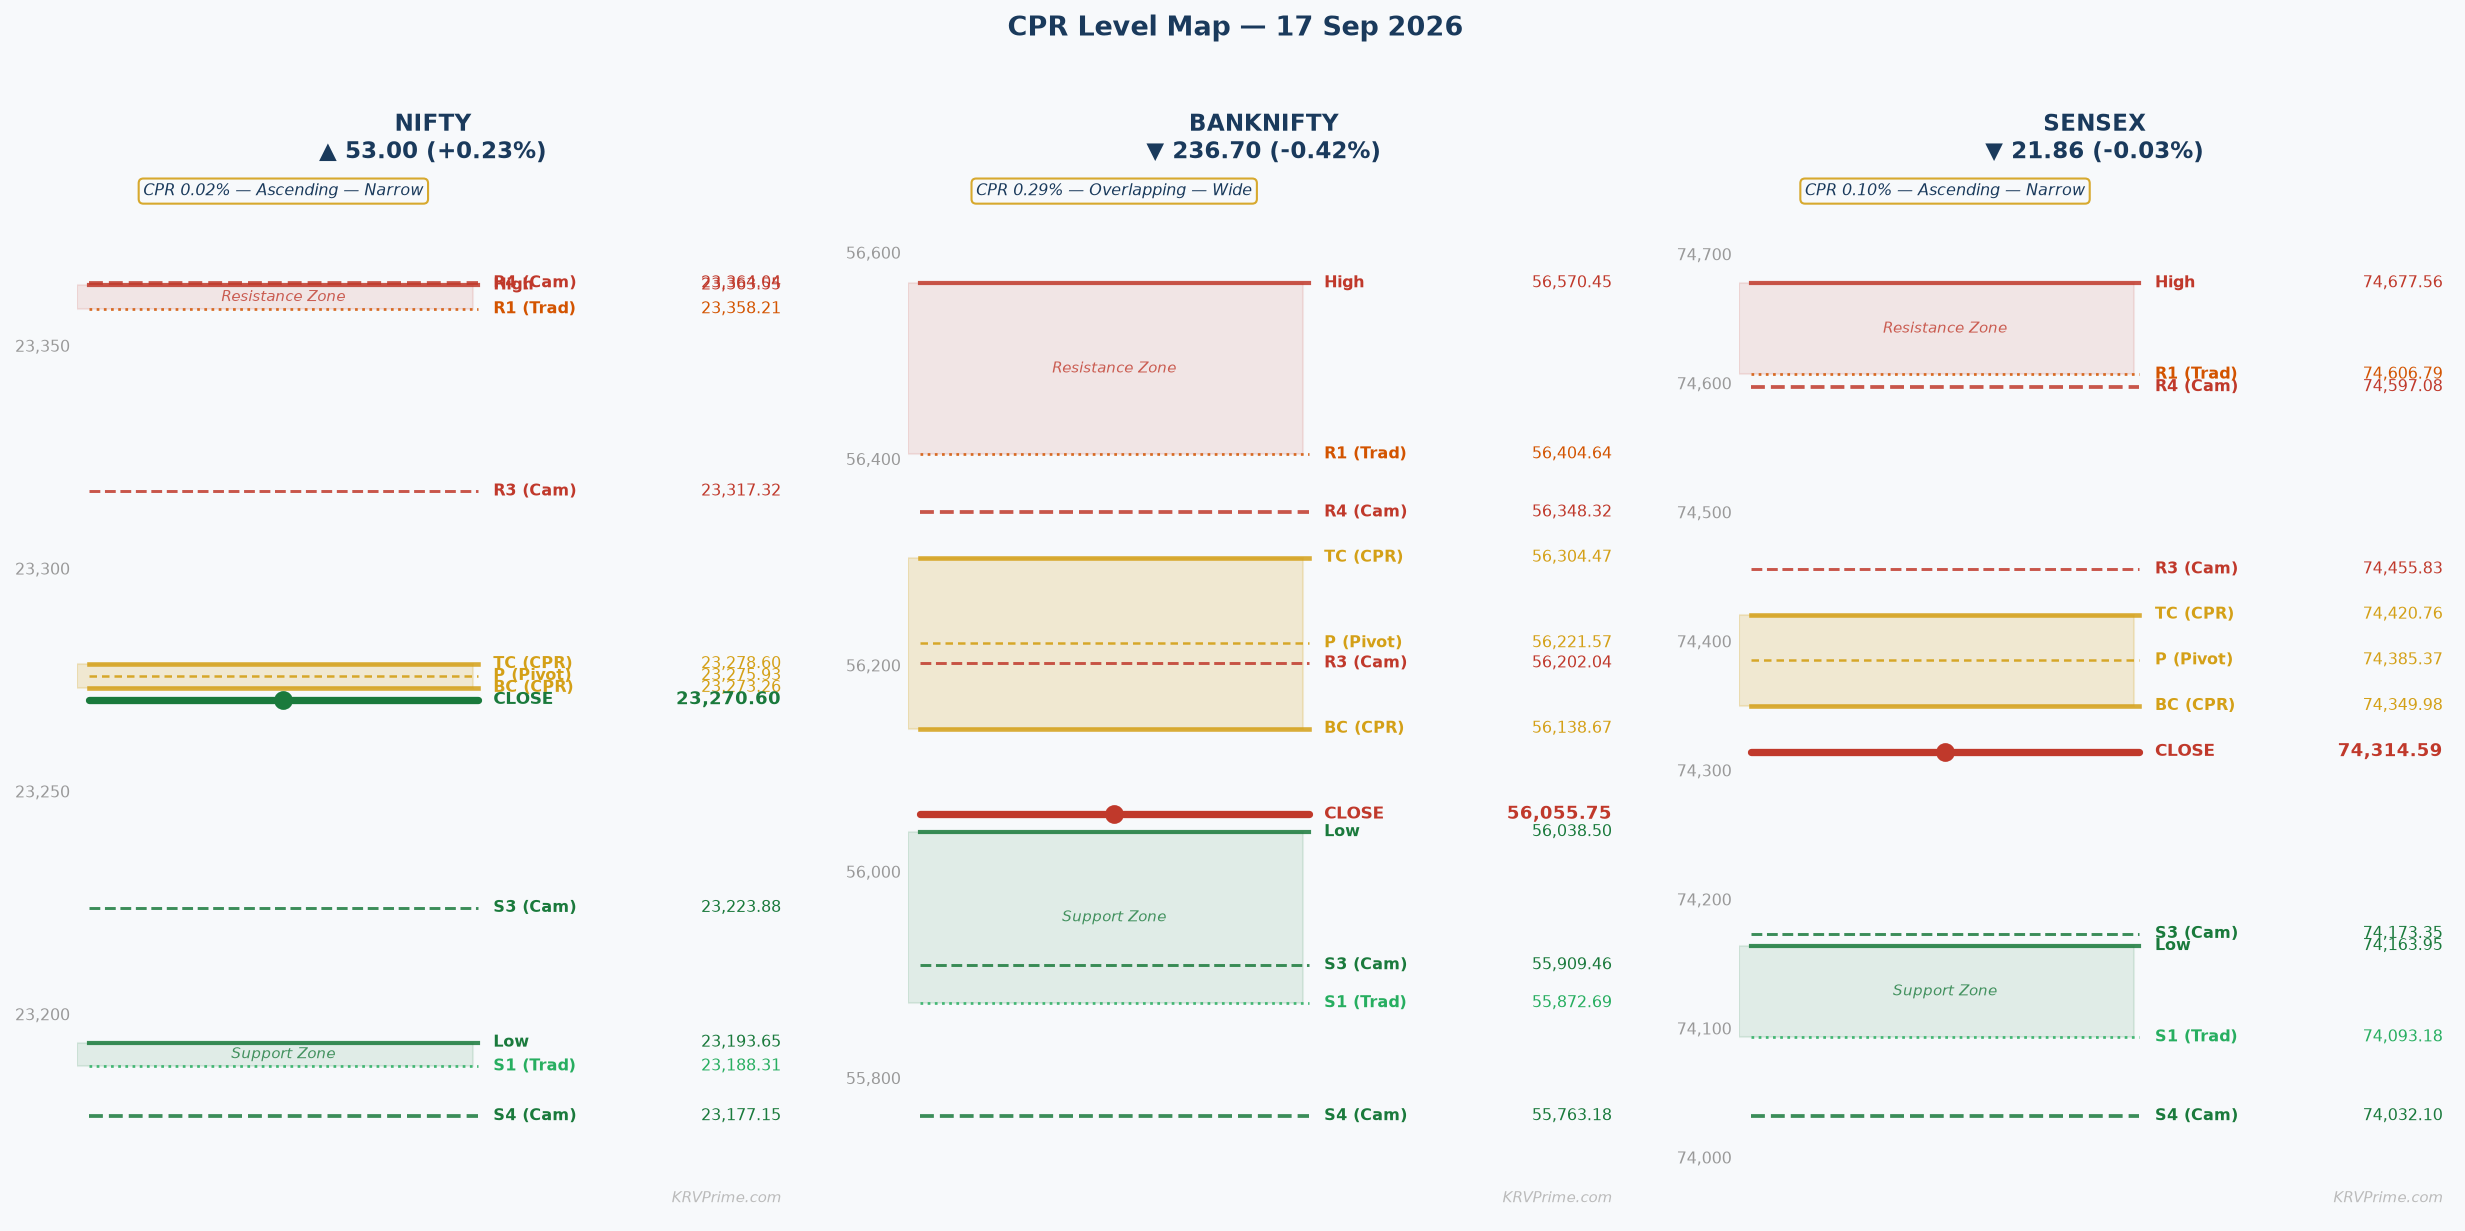
OI-R: 24,500 R3: 23,528.11 H6: 23,441.06 H5: 23,418.61 R2: 23,445.83 H4 ▶: 23,364.04 R1: 23,358.21 PDH: 23,363.55 H3 ↩: 23,317.32
TC: 23,278.60 P: 23,275.93 BC: 23,273.26
L3 ↩: 23,223.88 PDL: 23,193.65 S1: 23,188.31 L4 ▶: 23,177.15 S2: 23,106.03 L5: 23,122.57 L6: 23,100.14 S3: 23,018.41 OI-S: 22,000
↩ = Camarilla reversal point | ▶ = Camarilla breakout/breakdown trigger | OI-R/OI-S = Options wall (CE/PE max OI)
▲ Higher Open (Gap Up) — Open > Prev Close
▲ Bullish
Open lands: With an Ascending CPR where BC (23,273.26) is already above the previous session close (23,270.60), any gap-up open will place price either inside the CPR band (between BC 23,273.26 and TC 23,278.60) or above TC 23,278.60, depending on the gap magnitude — even a minor gap of 0.05% from 23,270.60 translates to roughly 23,282, which is already above TC 23,278.60, confirming that the entire CPR band acts as immediate support below the opening price.
CPR role: Launch Pad — the CPR band (BC 23,273.26 to TC 23,278.60) acts as a confirmed support zone below the gap-up open; price gapping above TC confirms bullish control and the CPR band is now the first line of defense on any intraday dip.
Minor Gap (0.05–0.25%) — Structure Dominant
A minor gap-up of 0.05%–0.25% opens NIFTY in the range of approximately 23,282 to 23,328, placing price just above TC 23,278.60 and directly inside the Camarilla H3 zone at 23,317.32 — this is a highly meaningful open because the ascending narrow CPR confirms multi-session uptrend structure and the gap adds directional lean without overextending. The CPR band (BC 23,273.26 — TC 23,278.60) immediately transitions into launch pad support, and any first 15-min candle that holds above TC 23,278.60 confirms bullish intent per the narrow CPR confirmation rule. The primary first target is H3 at 23,317.32 followed by R1 at 23,358.21 and PDH at 23,363.55, with traders taking partial profits at R1 and trailing to H4 at 23,364.04 for the Camarilla breakout zone.
Significant Gap (0.25–0.5%) — Balanced
A significant gap-up of 0.25%–0.50% opens NIFTY in the range of approximately 23,328 to 23,387, placing price between H3 (23,317.32) and PDH/H4 cluster (23,363.55 — 23,364.04) — this zone is congested with the previous day's high, R1 at 23,358.21, and H4 at 23,364.04 all acting as immediate overhead resistance. Gap-fill risk is elevated here because opening directly into the PDH-H4-R1 cluster (23,358–23,364) means longs entered at open are already buying into a resistance confluence, and delta-hedging by market makers who wrote calls at 23,350-23,400 will create selling pressure. If price sustains above PDH 23,363.55 on the first 15-min close, the next targets are H5 at 23,418.61 and R2 at 23,445.83, but a failure at PDH suggests a gap-fill back to CPR band (23,273–23,278) is the higher probability intraday outcome.
Large Gap (>0.5%) — Gap Direction Dominant
A large gap-up exceeding 0.50% opens NIFTY above approximately 23,387, potentially reaching the H5-H6 cluster (23,418.61 — 23,441.06) and even R2 at 23,445.83 — at this level, price is opening into Camarilla extreme zones where mean-reversion probability is highest and gap-fill risk becomes dominant. Market psychology at large gap-ups into H5-H6 territory is typically that aggressive overnight buyers are trapped as soon as institutional selling emerges at the Camarilla extremes, and with the weekly straddle implying only ±239 points of expected move, a 0.50%+ gap (~116+ points) consumes more than half the weekly premium, making further extension unsustainable. The abort level for any long initiated at open is a 15-min close below H3 at 23,317.32, which would indicate momentum exhaustion; primary fade target would be the CPR band (TC 23,278.60 — BC 23,273.26) with extension to L3 23,223.88 if selling accelerates.
|
▲ Upside Path → OI-R The confirmed upside path progresses from TC 23,278.60 → H3 23,317.32 → R1 23,358.21 → H4 23,364.04 → PDH 23,363.55 → H5 23,418.61 → R2 23,445.83, with each Camarilla level acting as a waypoint for partial profits — H3 is the first stall/partial zone, H4 is the breakout trigger for the next leg, and R2 at 23,445.83 aligns near H6 at 23,441.06, creating a cluster target for the day's high. Above R2 and H6, the OI-R ceiling at 24,500 is extremely distant (roughly 1,050 points away), meaning it is not a practical intraday target but confirms no structural OI resistance until that level, giving room for trending moves above H5. |
▼ Downside Path → OI-S On failure below TC 23,278.60 in a gap-up scenario, price gravitates back through P 23,275.93 → BC 23,273.26 → L3 23,223.88 → PDL 23,193.65 → S1 23,188.31 → L4 23,177.15, with L3 at 23,223.88 being the first meaningful bearish confirmation as it marks the Camarilla mean-reversion support flipping to resistance. A close below L4 at 23,177.15 activates the Camarilla breakdown extension toward L5 23,122.57 and L6 23,100.14, while OI-S at 22,000 is the structural floor far below and not an intraday target in a gap-up scenario unless catastrophic macro news drives exceptional selling. |
| 🔴 OI-R: OI-R at **24,500** (CE max OI for the week) is a distant structural ceiling approximately 1,229 points above current price — in a gap-up scenario it does not create immediate intraday resistance but confirms that CE writers are comfortable with the market staying well below this level, meaning there is no gamma-driven selling pressure until price approaches 24,500. The practical implication is that CE writing at 24,500 provides a strong implied directional ceiling for weekly expiry but is irrelevant for intraday momentum management; intraday traders should focus on the H4-R1-PDH cluster (23,358–23,364) as the real overhead zone where CE writers at near-term strikes will defend. | 🟢 OI-S: OI-S at **22,000** (PE max OI for the week) represents the structural floor and is approximately 1,270 points below current price — in a gap-up scenario this level is entirely irrelevant as an intraday target and instead confirms that PE writers have established a very wide downside buffer, indicating the broader market participant consensus is that NIFTY will not breach 22,000 during this weekly expiry cycle. The PE base at 22,000 provides psychological comfort for bulls on gap-up days, as massive put writing at this strike means any dip toward meaningful support will be met with institutional buying to protect those positions. |
⚡ Key Trigger: The key trigger for a higher open on NIFTY is the **first 15-min candle close above TC 23,278.60** (per narrow CPR confirmation rule) — since the ascending CPR already places the entire band above yesterday's close, any gap that opens above TC means the 15-min confirmation is about whether price can sustain above TC 23,278.60 and begin advancing toward H3 23,317.32. If the first 15-min candle fails to hold above TC 23,278.60 and instead closes back inside or below the CPR band, it signals a false gap-up and the intraday structure reverts to neutral-to-bearish, targeting L3 23,223.88 and PDL 23,193.65.
▼ Lower Open (Gap Down) — Open < Prev Close
▼ Bearish
Open lands: With an Ascending CPR where BC (23,273.26) sits just 2.66 points above yesterday's close (23,270.60), any gap-down open — even a minor one — immediately places price below the entire CPR band (below BC 23,273.26), below TC 23,278.60, and below P 23,275.93, meaning the ascending CPR flips from being a support-above scenario to acting as a fresh overhead resistance zone that price must reclaim from below.
CPR role: Overhead Resistance — the CPR band (BC 23,273.26 to TC 23,278.60) sits above the gap-down open price and acts as immediate resistance; bulls must reclaim BC 23,273.26 quickly to prevent bearish acceleration.
Minor Gap (0.05–0.25%) — Structure Dominant
A minor gap-down of 0.05%–0.25% opens NIFTY in the range of approximately 23,212 to 23,259, placing price below BC 23,273.26 and inside the L3 zone at 23,223.88 — the ascending CPR's entire band now sits overhead as resistance (BC 23,273.26 — TC 23,278.60), which is a structurally bearish signal because the uptrend structure identified by the ascending CPR is immediately challenged when price fails to open above it. Minor gaps in the context of a narrow ascending CPR frequently see a gap-fill attempt within the first 30–60 minutes, and the critical test is whether BC 23,273.26 can be reclaimed on the first 15-min candle close — success targets P 23,275.93 and TC 23,278.60, while failure to reclaim BC confirms a downside day targeting L3 23,223.88 and PDL 23,193.65.
Significant Gap (0.25–0.5%) — Balanced
A significant gap-down of 0.25%–0.50% opens NIFTY in the range of approximately 23,154 to 23,212, placing price near or below L4 at 23,177.15 and well below BC 23,273.26, making the CPR band an elevated resistance zone unlikely to be recovered intraday. The failure-and-resume structure takes over: the entire CPR band (23,273–23,279) acts as a hard overhead ceiling, and the 30-min reclaim rule requires two consecutive 30-min closes above BC 23,273.26 for bullish recovery to be trusted — anything less is a dead-cat bounce. Specific bear targets are L3 23,223.88 as first stall, L4 23,177.15 as breakdown trigger, S1 23,188.31 as traditional support, and L5 23,122.57 as the Camarilla downside extension zone, while heavy PUT writing at 22,000 (OI-S) confirms institutional expectation of no collapse below that structural floor this week.
Large Gap (>0.5%) — Gap Direction Dominant
A large gap-down exceeding 0.50% opens NIFTY below approximately 23,154, potentially breaching S2 at 23,106.03 and entering the L5-L6 Camarilla extreme zone (23,122.57 — 23,100.14) — at this level, panic-selling dynamics dominate the first 15–30 minutes as stop-losses cascade below PDL 23,193.65 and L4 23,177.15. With the weekly straddle at 239.25 points, a 0.50%+ gap (~116+ points) represents approximately 50% of the entire weekly straddle premium being consumed at open, making straddle sellers (who wrote both calls and puts) immediately pressured on the put side, and their covering of short puts adds selling fuel. The recovery level to watch is L4 at 23,177.15 — a 15-min close above L4 with expanding volume signals exhaustion of the panic and potential for a recovery toward CPR (BC 23,273.26); the primary downside targets in an unrecovered large gap are L5 23,122.57, L6 23,100.14, and S3 23,018.41 on extreme continuation.
|
▲ Upside Path → OI-R The recovery path from a gap-down open ascends through BC 23,273.26 → P 23,275.93 → TC 23,278.60 → H3 23,317.32 → R1 23,358.21 → H4 23,364.04, with BC being the critical first gate that confirms whether recovery is genuine — a clean 15-min close above BC followed by a hold above P and TC confirms bulls have regained control and the ascending CPR structure is restored. Volume confirmation is essential at each level: thin volume reclaims of BC are suspect and likely to fail at P or TC, while high-volume reclaims that push directly through TC 23,278.60 signal institutional participation and increase probability of reaching H3 23,317.32 intraday. |
▼ Downside Path → OI-S The bear path from a gap-down progresses through L3 23,223.88 → PDL 23,193.65 → S1 23,188.31 → L4 23,177.15 → L5 23,122.57 → L6 23,100.14 → S3 23,018.41, with retail stop-losses placed just below PDL 23,193.65 and L4 23,177.15 accelerating the move once these levels are breached — market makers are aware of clustered stops in these zones and price tends to overshoot to L5 23,122.57 before finding stabilization. OI-S at 22,000 remains a very distant structural floor but the presence of massive put writing there confirms no institutional expectation of a freefall below S3 23,018.41 during this weekly expiry. |
| 🔴 OI-R: OI-R at **24,500** in a gap-down scenario acts as a distant overhead structural ceiling that is entirely irrelevant for intraday management — CE writers defending 24,500 have zero gamma exposure at current prices and their positioning actually creates an environment where there is no call-side pressure to force markets lower near current levels, making the gap-down a pure demand-side failure rather than a CE-writing-driven suppression event. What matters more in the context of gap-down recovery is the near-term CE writing at 23,300–23,400 strikes which becomes the practical intraday resistance overlay, and traders should watch order flow at those strikes rather than the distant 24,500 OI-R. | 🟢 OI-S: OI-S at **22,000** in a gap-down scenario is the primary structural support that PE writers will defend aggressively — given the massive put OI at 22,000, any significant intraday decline will trigger PE writers (who are short puts at 22,000) to add delta hedges by buying NIFTY futures, creating a natural support buffer well before 22,000 is ever tested. In practical terms for 18 Sep 2026, OI-S at 22,000 is not a same-session target but provides comfort that the downside is bounded, allowing contra-traders to look for bounce opportunities near L5 23,122.57 and L6 23,100.14 with defined risk against a stop below L6. |
⚡ Key Trigger: The bull trigger in a gap-down scenario is **reclaim of BC 23,273.26 within the first 30 minutes** with a confirmed 15-min candle close above it — this reclaim signals that the gap-down was a false move and bullish ascending CPR structure remains intact, targeting P 23,275.93 then TC 23,278.60 then H3 23,317.32 in sequence. The bear confirmation is the **failure to reclaim BC 23,273.26 within 30 minutes** — each passing 30-min candle that stays below BC deepens the bearish structure, and a first 15-min close below L3 23,223.88 activates the Camarilla breakdown cascade toward L4 23,177.15 and L5 23,122.57.
◆ Near Flat Open — Open ≈ Prev Close (±0.05%)
◆ Neutral
Open lands: A ±0.05% flat open from 23,270.60 places NIFTY in the range of 23,259 to 23,282 — this means price opens either just below BC 23,273.26 (slightly bearish positioning) or just above TC 23,278.60 (slightly bullish positioning), hovering within or at the edge of the extremely narrow ascending CPR band (width only 5.34 points / 0.02%).
CPR role: Decision Zone and Compression Band — the extremely narrow CPR (23,273.26 — 23,278.60, width 5.34 points) creates a maximum compression environment where the first 15-min candle direction IS the trade; the CPR band simultaneously acts as launch pad if held from above and trap door if breached from below.
Near Flat (±0.05%)
A flat open on NIFTY with an ascending narrow CPR of only 0.02% width (5.34 points) is one of the highest-probability trending day setups in technical analysis — the compression is extreme and the ascending structure confirms multi-session bullish momentum, meaning the energy release from this compression is statistically more likely to be upward than downward, though the direction must be confirmed by price action. The specific values to watch are BC at **23,273.26** and TC at **23,278.60**: a flat open inside this 5.34-point band means the entire market's intraday direction is determined by which side price exits from during the first 15-min candle, making this a binary trigger setup with no ambiguity. With CPR width below 0.15% (actually just 0.02%), this qualifies as an ultra-narrow band and the trending day probability is extremely high — narrow CPRs create this dynamic because they represent near-perfect balance between buyers and sellers from the previous session, and any sustained directional push during the first 15 minutes releases the accumulated energy in one direction without the counter-pressure that wide CPRs generate. The bull trigger is a **first 15-min candle close above TC 23,278.60** which targets H3 23,317.32 as the first waypoint, then R1 23,358.21 and PDH 23,363.55 in sequence with H4 at 23,364.04 as the Camarilla breakout level; the bear trigger is a **first 15-min candle close below BC 23,273.26** which targets L3 23,223.88 then PDL 23,193.65 and S1 23,188.31, with the weekly straddle of 239.25 points confirming that a full trending day could easily reach either end of the range.
|
▲ Upside Path → OI-R From TC 23,278.60, the confirmed bull path progresses to H3 23,317.32 (Camarilla mean-reversion first stall, take partial profits here), then R1 23,358.21 and H4 23,364.04 cluster near PDH 23,363.55 (second partial or trail stop), followed by H5 23,418.61 and H6 23,441.06 as the Camarilla upside target zone on a strong trending day, with R2 at 23,445.83 as the Traditional second target — OI-R at 24,500 is far above and confirms no structural ceiling below 24,500, giving the bull trend room to run without gamma-driven suppression. |
▼ Downside Path → OI-S From BC 23,273.26, the confirmed bear path progresses to L3 23,223.88 (Camarilla mean-reversion zone, first partial for shorts), then PDL 23,193.65 and S1 23,188.31 (second partial), followed by L4 23,177.15 as the Camarilla breakdown trigger, L5 23,122.57 and L6 23,100.14 as downside targets on an accelerating trending day, with OI-S at 22,000 as the distant but definitive structural floor that PE writers will defend, limiting the practical downside target for intraday shorts to S3 23,018.41 in extreme scenarios. |
| 🔴 OI-R: OI-R at **24,500** in a flat-open scenario acts as a supreme structural ceiling that is not an intraday target but confirms CE writers have positioned a massive supply wall far above, creating a range where NIFTY can trend upward throughout 18 Sep 2026 without encountering any meaningful CE-writing-driven resistance at current levels — this absence of nearby OI resistance actually enhances the probability of a sustained trending move to the upside if TC 23,278.60 is broken convincingly. Practically, the near-term resistance for the session will come from the PDH-H4-R1 cluster at 23,358–23,364, where shorter-dated CE writers will defend, and traders should treat 24,500 as the weekly expiry ceiling rather than an intraday level. | 🟢 OI-S: OI-S at **22,000** in a flat-open scenario represents the strong PE base that provides a distant but powerful downside buffer — PE writers at 22,000 are deeply out-of-the-money and their gamma is negligible at current NIFTY levels, meaning they do not actively influence intraday price action but instead create a psychological floor that prevents panic-driven collapse and encourages institutional dip-buying on any intraday correction. For 18 Sep 2026, a flat open with OI-S at 22,000 means bear-side traders have no practical PE-driven support floor to target intraday and must instead use Camarilla levels (L3 23,223.88, L4 23,177.15) as their profit-taking zones. |
⚡ Key Trigger: **First 15-min candle close above TC 23,278.60 = Bull trigger** targeting H3 23,317.32 and R1 23,358.21 in succession; **first 15-min candle close below BC 23,273.26 = Bear trigger** targeting L3 23,223.88 and PDL 23,193.65 — the structural reason this 5.34-point band is the absolute fulcrum is that ascending CPRs represent price levels where buyers from previous sessions established control, and a break below BC invalidates that control signal entirely, shifting the structure to bearish for the session. Volume confirmation is critical: a 15-min close above TC on above-average volume is a high-conviction bull signal, while a low-volume close above TC in a flat-open scenario may produce a false breakout that reverses to BC within the next candle.
BANKNIFTY
Overlapping — Wide (Width: 0.29%)
◆ Neutral
Market Structure Sideways or range-bound | Straddle ATM 56,100 — Monthly straddle at **1,117.90 pts** (Call 664.00 + Put 453.90) implies an expected move of approximately ±1,118 points from 56,100 for the monthly expiry, defining a range of roughly 54,982 to 57,218; the call-heavy skew (664 vs 453.90) suggests mild upside premium bias while still reflecting meaningful downside fear, consistent with BankNifty's weaker close on 17 Sep. | Max Pain Monthly Max Pain at **57,100** (expiry 29-Sep-2026) — BankNifty closed at 56,055.75, which is **1,044.25 points below max pain**, creating significant gravitational pull toward 57,100 as option sellers defend this strike over the remaining sessions; this large gap between current price and max pain implies sustained buying pressure from option writers covering delta, making every intraday dip a potential institutional buying opportunity in the near term. |
Tomorrow's Complete Level Map
OI-R: 57,500 R3: 56,936.59 H6: 56,587.86 H5: 56,519.18 R2: 56,753.52 H4 ▶: 56,348.32 R1: 56,404.64 PDH: 56,570.45 H3 ↩: 56,202.04
TC: 56,304.47 P: 56,221.57 BC: 56,138.67
L3 ↩: 55,909.46 PDL: 56,038.50 S1: 55,872.69 L4 ▶: 55,763.18 S2: 55,689.62 L5: 55,592.32 L6: 55,523.64 S3: 55,340.74 OI-S: 54,000
↩ = Camarilla reversal point | ▶ = Camarilla breakout/breakdown trigger | OI-R/OI-S = Options wall (CE/PE max OI)
▲ Higher Open (Gap Up) — Open > Prev Close
▲ Bullish
Open lands: BankNifty's previous close is 56,055.75, while BC is at 56,138.67 and TC is at 56,304.47 — this is an overlapping wide CPR where the previous close (56,055.75) sits BELOW BC (56,138.67), meaning a gap-up open needs to cross 56,138.67 to enter the CPR band, and a minor gap-up brings price to the lower edge of the CPR band while a significant or large gap-up places it inside the wide band or above TC 56,304.47.
CPR role: Overhead Resistance initially transitioning to Support once reclaimed — in an overlapping wide CPR below yesterday's close, the band (56,138.67 — 56,304.47) acts as a contested overhead zone for minor gaps and a potential launch pad for significant/large gaps that open above TC.
Minor Gap (0.05–0.25%) — Structure Dominant
A minor gap-up of 0.05%–0.25% opens BankNifty in the range of approximately 56,084 to 56,196, placing price either still below BC 56,138.67 (bearish positioning relative to CPR) or just inside the lower portion of the wide CPR band — with a wide overlapping CPR, the confirmation rule requires **two consecutive 30-min closes** above TC 56,304.47 before a bullish bias is confirmed, and a minor gap that doesn't clear BC 56,138.67 is structurally weak. The Camarilla H3 at 56,202.04 sits inside the CPR band and acts as a first test zone — price opening between BC 56,138.67 and H3 56,202.04 faces an immediate cluster of resistance from both CPR and Camarilla, making it high-probability that price stalls or rejects in this zone before the direction is resolved. In a successful minor gap-up scenario (open above BC, hold on 30-min close), first target is H3 56,202.04 then TC 56,304.47 then H4 56,348.32 and R1 56,404.64, while failure to hold BC 56,138.67 returns price to PDL zone at 56,038.50 and L3 55,909.46.
Significant Gap (0.25–0.5%) — Balanced
A significant gap-up of 0.25%–0.50% opens BankNifty in the range of approximately 56,196 to 56,336, placing price inside the wide CPR band between H3 56,202.04 and TC 56,304.47, or potentially just above TC — this is a meaningful opening position because price is now inside the CPR band and the question becomes whether buyers can sustain two 30-min closes above TC 56,304.47 to confirm the breakout. Opening inside a wide overlapping CPR after a gap-up creates delta-hedging pressure from CE writers at 56,300–56,350 (who sold calls expecting BankNifty to stay below TC) and their covering creates buying support, which can accelerate the move toward H4 56,348.32 and R1 56,404.64 if the first 30-min candle holds above TC. Specific targets on two confirmed 30-min closes above TC 56,304.47 are H4 56,348.32 → R1 56,404.64 → H5 56,519.18 → PDH 56,570.45 → H6 56,587.86 → R2 56,753.52, with the monthly OI-R at 57,500 as the ultimate ceiling for the month.
Large Gap (>0.5%) — Gap Direction Dominant
A large gap-up exceeding 0.50% opens BankNifty above approximately 56,336, potentially placing it above TC 56,304.47 and near H4 56,348.32 or PDH 56,570.45 — at these levels, price opens directly into the Camarilla breakout zone and the wide CPR confirmation rule (two 30-min closes) must be applied rigorously to separate genuine breakouts from gap-fill traps. The market psychology of a large gap-up into PDH 56,570.45 or H6 56,587.86 is complex: BankNifty's previous close was already 514.70 points below PDH, and a large gap that recovers this entire distance in overnight action faces massive resistance from participants who were short or exited longs at yesterday's high. The abort level for longs on a large gap-up is a 30-min close back below TC 56,304.47, which signals gap-fill toward CPR center P 56,221.57 and BC 56,138.67, while a sustained hold above PDH 56,570.45 targets R2 56,753.52 and ultimately R3 56,936.59 with the OI-R ceiling at 57,500.
|
▲ Upside Path → OI-R The confirmed upside path from a gap-up open on BankNifty progresses: TC 56,304.47 → H4 56,348.32 → R1 56,404.64 → H5 56,519.18 → PDH 56,570.45 → H6 56,587.86 → R2 56,753.52 → R3 56,936.59 → OI-R 57,500, with H4 at 56,348.32 being the Camarilla breakout trigger that accelerates momentum to H5 and PDH, and R2 at 56,753.52 aligned near the weekly high zone creating the key resistance cluster for the session. OI-R at 57,500 is a genuine intraday ceiling in BankNifty given the monthly straddle of 1,117.90 points makes 57,500 a reachable level on a strong trending day, and CE writers defending 57,500 will create significant gamma-driven selling pressure in that zone. |
▼ Downside Path → OI-S Failure to sustain above CPR band in a gap-up scenario brings BankNifty back through P 56,221.57 → BC 56,138.67 → PDL 56,038.50 → L3 55,909.46 → S1 55,872.69 → L4 55,763.18, with the critical bear confirmation being a 30-min close below BC 56,138.67 which signals the gap-up has failed entirely and the wide overlapping CPR is acting as a classic bull trap. L4 at 55,763.18 is the Camarilla breakdown trigger for the next leg down toward L5 55,592.32 and L6 55,523.64, and OI-S at 54,000 provides the ultimate downside boundary where massive PE writing will attract institutional buyers. |
| 🔴 OI-R: OI-R at **57,500** (CE max OI for BankNifty month) in a gap-up scenario is a genuine and practical intraday ceiling — unlike NIFTY's distant OI-R, BankNifty's 57,500 is only 1,444 points above the previous close of 56,055.75, and within the monthly straddle range of 1,117.90 points, making 57,500 a reachable target on strong gap-up days. CE writers at 57,500 have accumulated significant positions and will actively defend this level through delta-hedging (selling BankNifty futures) as price approaches, creating a fade zone; traders should take full profits on longs at or below R3 56,936.59 and not chase positions into 57,500 without strong momentum confirmation. | 🟢 OI-S: OI-S at **54,000** in a gap-up scenario is a remote but structurally important downside anchor — PE writers at 54,000 are approximately 2,056 points below current price, and their presence creates a deeply embedded put base that institutional participants will defend by buying BankNifty on any significant correction, making 54,000 an irrelevant intraday target but a meaningful confidence anchor for bull-side traders. The PE base at 54,000 effectively means that on gap-up days, the risk-reward for chasing longs is enhanced because the downside is structurally capped by massive PE writing far below current levels. |
⚡ Key Trigger: The bull trigger for a gap-up BankNifty is **two consecutive 30-min closes above TC 56,304.47** (per wide CPR confirmation rule) — this double confirmation requirement exists because wide overlapping CPRs are inherently contested zones where single-candle breakouts frequently fail, and requiring two 30-min candles above TC filters out the noise of gap-fill reversals. If the first 30-min close is above TC but the second 30-min candle reverses below TC, the signal is aborted and the setup becomes a fade-the-gap trade targeting P 56,221.57, BC 56,138.67, and L3 55,909.46 on the downside.
▼ Lower Open (Gap Down) — Open < Prev Close
▼ Bearish
Open lands: BankNifty's previous close is 56,055.75, and the BC is at 56,138.67 — since the close is already below BC, any gap-down open only deepens the bearish position relative to the CPR band, placing price further below the entire wide overlapping CPR band (56,138.67 — 56,304.47), which means the entire band acts as overhead resistance for any recovery attempt.
CPR role: Overhead Resistance — the wide CPR band (56,138.67 — 56,304.47) sits above the gap-down open and acts as a formidable resistance zone; bears are in complete structural control as long as price stays below BC 56,138.67.
Minor Gap (0.05–0.25%) — Structure Dominant
A minor gap-down of 0.05%–0.25% opens BankNifty in the range of approximately 55,916 to 56,027, placing price near or below PDL 56,038.50 and inside the L3 Camarilla zone at 55,909.46 — the wide overlapping CPR sitting entirely above (BC 56,138.67 — TC 56,304.47) acts as a massive overhead resistance wall, and the gap-fill probability from a minor gap is low because reclaiming BC 56,138.67 from below requires approximately 150–222 points of recovery against a wide CPR. The bear bias is supported by the sideways market structure and the close already below BC 56,138.67 on 17 Sep — the 30-min confirmation rule for a wide CPR means bears need two 30-min closes below L3 55,909.46 to confirm acceleration toward L4 55,763.18 and S1 55,872.69. The specific bear targets from a minor gap-down are L3 55,909.46 (first stall, partial profits for shorts), PDL 56,038.50 (now overhead resistance), S1 55,872.69, L4 55,763.18, and L5 55,592.32, with OI-S at 54,000 as the monthly floor.
Significant Gap (0.25–0.5%) — Balanced
A significant gap-down of 0.25%–0.50% opens BankNifty in the range of approximately 55,776 to 55,916, placing price near L3 55,909.46 or even at L4 55,763.18 — this is a substantial gap that creates immediate panic in banking stocks and triggers stop-losses from holders of weekly call positions near 56,000-56,100 strikes. The failure-and-resume structure is dominant: two 30-min closes below L3 55,909.46 confirm the breakdown and target L4 55,763.18 → S1 55,872.69 → L5 55,592.32 → L6 55,523.64 → S2 55,689.62, while PUT writers at 55,500-56,000 (near the current area) who are short puts face margin pressure, and their delta-hedging by selling BankNifty futures adds to the bearish momentum. The recovery trigger is a 30-min close above BC 56,138.67 with volume, but this requires a recovery of 300+ points from the significant gap-down open, making it a low-probability scenario that would only materialize on strong positive macro catalysts.
Large Gap (>0.5%) — Gap Direction Dominant
A large gap-down exceeding 0.50% opens BankNifty below approximately 55,776, potentially reaching L4 55,763.18 or even L5 55,592.32 at the open — this places price in the Camarilla extreme downside zone where mean-reversion attempts are most likely, but the wide CPR structure requires caution because two 30-min candle confirmations are needed before any directional trade is initiated. The VIX-absent environment makes this particularly tricky: without India VIX data, the monthly straddle of 1,117.90 points is the primary gauge, and a 0.50%+ gap (~280+ points) consuming 25% of the monthly straddle in the first minute suggests the day could see full straddle monetization. The panic phase typically exhausts near L5 55,592.32 and L6 55,523.64, and straddle buyers (who are long both calls and puts) may start closing put positions near L5-L6 zone, creating temporary stabilization — the recovery level is BC 56,138.67 (extremely difficult from L5), making the highest-probability trade a short-side scalp near the open with L5-L6 as profit targets.
|
▲ Upside Path → OI-R The recovery path from a gap-down open on BankNifty is steep: L3 55,909.46 → PDL 56,038.50 → BC 56,138.67 → P 56,221.57 → H3 56,202.04 (note H3 is inside CPR band at 56,202.04) → TC 56,304.47 → H4 56,348.32, with each level requiring volume confirmation and two 30-min closes above CPR band for sustained recovery. A genuine recovery toward max pain at 57,100 would require multi-session accumulation rather than an intraday reversal from a gap-down, making this path a medium-term recovery thesis rather than a same-day trading opportunity. |
▼ Downside Path → OI-S The bear path from a gap-down progresses through L3 55,909.46 → S1 55,872.69 → L4 55,763.18 → L5 55,592.32 → L6 55,523.64 → S2 55,689.62 → S3 55,340.74, with retail stop-losses concentrated below PDL 56,038.50 and L3 55,909.46 accelerating the initial move, followed by another cluster of stops below L4 55,763.18 that pushes price to the Camarilla extreme zone of L5-L6. OI-S at 54,000 is the structural basement approximately 2,056 points below and will attract institutional buying well before it is reached, making S3 55,340.74 the realistic intraday bear target on an extreme down day. |
| 🔴 OI-R: OI-R at **57,500** in a gap-down scenario is a distant overhead ceiling that becomes the reference point for the max pain pull dynamic — short CE writers at 57,500 have no pressure to cover since price is moving away from their strike, and their comfortable positioning creates a one-sided OI landscape where put writers near 54,000-55,000 are increasingly under pressure. The practical effect is that OI-R at 57,500 provides no intraday support in a gap-down scenario, but the absence of call-side pressure does mean that any recovery above BC 56,138.67 will face reduced gamma resistance compared to a scenario where price was already near 57,500. | 🟢 OI-S: OI-S at **54,000** in a gap-down scenario is the primary structural floor and PUT monetization zone — PE writers at 54,000 who are short puts will begin aggressive delta-hedging (buying BankNifty futures) as price drops from 56,000 toward their strike, and this activity becomes more intense as price approaches L5 55,592.32 and L6 55,523.64 because the delta of the 54,000 puts increases with each 100-point drop. Traders can use L5 55,592.32 and L6 55,523.64 as scalp long entry zones on a large gap-down, anticipating institutional PE-writer covering flows to create temporary bounces toward BC 56,138.67. |
⚡ Key Trigger: The bear confirmation for a gap-down BankNifty is **two 30-min closes below L3 55,909.46** (per wide CPR confirmation rule), which validates bearish momentum and targets L4 55,763.18 → L5 55,592.32 in sequence — the reason two candles are required is that wide CPRs with overlapping structure create frequent false breakdowns where the first 30-min candle breaches support but the second recovers, and requiring two consecutive confirms filters out these whipsaws. The bull recovery trigger (though low probability in gap-down scenario) is a **30-min close above BC 56,138.67** which signals institutional accumulation is overpowering selling pressure, potentially driven by max pain pull toward 57,100 and PE writer delta-hedging from 54,000 strike.
◆ Near Flat Open — Open ≈ Prev Close (±0.05%)
◆ Neutral
Open lands: A ±0.05% flat open from 56,055.75 places BankNifty in the range of 56,028 to 56,084 — this is approximately 55 to 110 points below BC 56,138.67, meaning price opens entirely below the wide overlapping CPR band (56,138.67 — 56,304.47) and the CPR acts as overhead resistance from the open.
CPR role: Overhead Resistance transitioning to Decision Zone — the wide CPR band sits 55-250 points above the flat open price, acting as a ceiling that must be penetrated for bullish bias to emerge; in the absence of that reclaim, the wide CPR is a pure overhead resistance zone in a sideways market structure.
Near Flat (±0.05%)
A flat open on BankNifty with a wide overlapping CPR (0.29% width) is fundamentally different from NIFTY's narrow CPR flat open — wide CPRs in overlapping configuration signal a range-bound day where fading extremes is the primary strategy, and the fact that the flat open is BELOW BC 56,138.67 means bears have a slight structural edge from the start. The specific values that define the day: BC at **56,138.67** is the first overhead resistance (approximately 83 points above flat open), P at **56,221.57** is the pivot mid-point (approximately 166 points above), and TC at **56,304.47** is the upper resistance (approximately 249 points above) — for a wide CPR, reclaiming all three levels requires a 249-point intraday rally from the open, which is a substantial move. Wide overlapping CPRs create range-bound days where the market oscillates between CPR boundaries and Camarilla extreme levels — the bull scenario requires two consecutive 30-min closes above TC 56,304.47, while the bear scenario is confirmed by two consecutive 30-min closes below L3 55,909.46, and between these zones, it is a scalper's market with frequent false moves. The bull trigger is **two 30-min closes above TC 56,304.47** targeting H4 56,348.32 and R1 56,404.64, while the bear trigger is **two 30-min closes below L3 55,909.46** targeting L4 55,763.18 and S1 55,872.69 — between L3 and TC, the wide CPR acts as a friction-filled decision band where scalpers can fade both extremes but positional traders must wait for confirmation.
|
▲ Upside Path → OI-R From TC 56,304.47 (after two confirmed 30-min closes above), the bull path progresses to H4 56,348.32 (Camarilla breakout trigger) → R1 56,404.64 → H5 56,519.18 → PDH 56,570.45 → H6 56,587.86 → R2 56,753.52 → OI-R 57,500, with R1 at 56,404.64 being the first profit-taking zone per wide CPR rules and exit recommended near OI-R 57,500 without trailing, as the wide CPR framework cautions against trailing beyond OI-R in range-bound markets. Max pain at 57,100 aligns between R2 56,753.52 and OI-R 57,500, creating a natural multi-day magnetic target that supports the upside thesis. |
▼ Downside Path → OI-S From L3 55,909.46 (after two confirmed 30-min closes below), the bear path progresses to S1 55,872.69 → L4 55,763.18 (Camarilla breakdown trigger) → L5 55,592.32 → L6 55,523.64 → S2 55,689.62 → S3 55,340.74, with S1 at 55,872.69 as the first profit-taking zone and exit recommended near OI-S 54,000 zone without chasing further, as massive PE writing at 54,000 creates institutional buy-programs that can reverse the trend sharply. Retail stop-losses below PDL 56,038.50 (which becomes overhead after the flat open) and below L3 55,909.46 will accelerate the initial bear move, making L3 a high-conviction short entry for experienced intraday traders. |
| 🔴 OI-R: OI-R at **57,500** in a flat-open sideways BankNifty session represents the maximum practical upside ceiling for the monthly cycle — CE writers at 57,500 are not under immediate pressure when price is at 56,000, but the proximity of max pain at 57,100 (which sits between current price and OI-R) means that any sustained rally from a flat open will be turbocharged by delta-hedging flows from option sellers who need to defend the 57,100 max pain level. Traders in a flat-open scenario should target R2 56,753.52 and R3 56,936.59 as practical upside limits and treat OI-R 57,500 as a monthly target rather than an intraday one, per wide CPR rules. | 🟢 OI-S: OI-S at **54,000** in a flat-open scenario provides a structural safety net that makes aggressive short positions above 55,500 more risky than they appear — the massive PE base at 54,000 means institutional participants (PE writers) will begin buying BankNifty futures in increasing quantities as price drops from 56,000 toward 55,500 and below, creating natural support layers at L5 55,592.32 and L6 55,523.64 well above the 54,000 strike. In practice, OI-S at 54,000 confirms that the downside for BankNifty from a flat open near 56,055 is bounded at approximately 2,055 points, making the risk-reward for positional shorts from the flat open unfavorable unless the wide CPR bear confirmation (two 30-min closes below L3 55,909.46) is firmly in place. |
⚡ Key Trigger: **Two 30-min closes above TC 56,304.47 = Bull trigger** targeting H4 56,348.32, R1 56,404.64, and H5 56,519.18 in sequence; **two 30-min closes below L3 55,909.46 = Bear trigger** targeting S1 55,872.69, L4 55,763.18, and L5 55,592.32 — the reason two candles are mandatory for a wide overlapping CPR is that single-candle breakouts from wide bands are statistically more likely to be false moves, and market structure confirmed sideways behavior means mean-reversion dominates over momentum until double-candle confirmation shifts the probability. The structural fulcrum for the entire session is BC 56,138.67: bulls must prove they can first reclaim BC before targeting TC, while bears who see a failed attempt at BC will use it as entry for shorts targeting L3.
SENSEX
Ascending — Narrow (Width: 0.10%)
▲ Bullish
Market Structure Trending (up or down trend) | Straddle ATM 74,300 — Monthly straddle at **1,011.00 pts** (Call 657.00 + Put 354.00) implies an expected move of approximately ±1,011 points from 74,300 for the monthly expiry, defining a range of roughly 73,289 to 75,311; the weekly straddle is extremely thin at only **14.55 pts** (Call 14.50 + Put 0.05), indicating the weekly expiry (17-Sep-2026) has effectively already expired with near-zero time premium, meaning the weekly straddle is irrelevant for 18 Sep 2026 directional analysis. The call-heavy skew in the monthly straddle (657 vs 354) reflects meaningful upside premium bias but the put at 354 still represents significant downside hedging. | Max Pain Weekly Max Pain at **74,400** (expiry 17-Sep-2026 — effectively same day as this closing data, already expired or expiring today) and Monthly Max Pain at **74,600** (expiry 24-Sep-2026) — SENSEX closed at 74,314.59, which is **85.41 points below weekly max pain (74,400)** and **285.41 points below monthly max pain (74,600)**, creating upward gravitational pull toward both levels; the monthly max pain at 74,600 acts as the near-term magnetic target, and note that OI-R at 74,500 sits between current price and monthly max pain, creating a critical confluence resistance zone. |
Tomorrow's Complete Level Map
OI-R: 74,500 R3: 75,120.40 H6: 74,829.24 H5: 74,762.06 R2: 74,898.98 H4 ▶: 74,597.08 R1: 74,606.79 PDH: 74,677.56 H3 ↩: 74,455.83
TC: 74,420.76 P: 74,385.37 BC: 74,349.98
L3 ↩: 74,173.35 PDL: 74,163.95 S1: 74,093.18 L4 ▶: 74,032.10 S2: 73,871.76 L5: 73,867.12 L6: 73,799.94 S3: 73,579.57 OI-S: 74,300
↩ = Camarilla reversal point | ▶ = Camarilla breakout/breakdown trigger | OI-R/OI-S = Options wall (CE/PE max OI)
▲ Higher Open (Gap Up) — Open > Prev Close
↕ Conflicted
Open lands: SENSEX closed at 74,314.59 while BC is at 74,349.98 and TC is at 74,420.76 — with an ascending CPR, BC (74,349.98) is already 35.39 points above the previous close (74,314.59), meaning even a flat open is below BC. A gap-up of 0.05% (~37 points) takes price to approximately 74,352, just inside the CPR band; a gap-up of 0.10%–0.25% takes price to 74,389–74,500, inside the CPR band or at TC/OI-R; a significant gap-up lands price above TC 74,420.76 and potentially directly into OI-R at 74,500.
CPR role: Launch Pad transitioning to Support once held — a gap-up above BC 74,349.98 places the CPR band (74,349.98 — 74,420.76) as support beneath the open, acting as a launch pad for higher targets; however, the extreme proximity of OI-R at 74,500 (only 79.24 points above TC 74,420.76) means upside is immediately capped.
Minor Gap (0.05–0.25%) — Structure Dominant
A minor gap-up of 0.05%–0.25% opens SENSEX in the range of approximately 74,352 to 74,500, placing price inside the CPR band (between BC 74,349.98 and TC 74,420.76) or directly at TC — this is a critically important zone because OI-R at **74,500** is only 35-80 points above TC 74,420.76, meaning any gap-up immediately runs into the OI resistance ceiling before it can even develop momentum. The CPR structure (ascending, narrow, trending) is bullish and supports continuation, but the CE max OI at 74,500 creates an almost immediate gamma wall where CE writers will aggressively sell SENSEX futures to hedge, making sustained advance above 74,500 extremely difficult on a minor gap. The first 15-min candle (narrow CPR confirmation rule) must close above TC 74,420.76 to confirm bullish control, but traders should be aware that the primary target H3 74,455.83 and H4 74,597.08 sit respectively 35 and 97 points inside the OI-R zone, creating a compressed trading range where the entire upside thesis depends on whether CE writers at 74,500 are overwhelmed by buying pressure.
Significant Gap (0.25–0.5%) — Balanced
A significant gap-up of 0.25%–0.50% opens SENSEX in the range of approximately 74,500 to 74,686, placing price directly at or above OI-R 74,500 — this is a game-changer because the gap-up immediately breaches the CE max OI wall, forcing CE writers who sold 74,500 calls to delta-hedge by buying SENSEX futures, which paradoxically adds more upside momentum and can create a self-reinforcing squeeze toward PDH 74,677.56 and H4 74,597.08. The gap-fill risk from 74,500+ is moderate because opening above OI-R means market participants who missed the move will buy dips toward 74,420.76 (TC) and 74,349.98 (BC), making the CPR band a strong support on any pullback and reducing downside exposure. Primary targets on a significant gap-up that holds above OI-R 74,500 are H4 74,597.08 → R1 74,606.79 → PDH 74,677.56 → H5 74,762.06 → H6 74,829.24 → R2 74,898.98, with monthly max pain at 74,600 providing additional gravitational pull in the 74,600 zone.
Large Gap (>0.5%) — Gap Direction Dominant
A large gap-up exceeding 0.50% opens SENSEX above approximately 74,686, potentially reaching PDH 74,677.56 to H5 74,762.06 territory — at this level, price is opening into the Camarilla H4-H5 zone and the weekly straddle of only 14.55 points (near-expired) means there is no weekly straddle framework to guide the move, making the monthly straddle of 1,011 points the relevant gauge. A large gap-up into H5 74,762.06 consumes approximately 448 points (74,314.59 to 74,762.06) or about 44% of the monthly straddle, which is significant but not extreme — however, the fact that OI-R at 74,500 and OI-S at 74,300 create an extremely tight 200-point OI band means the market structure is compressed and a large gap-up breaking decisively above OI-R 74,500 could see a rapid squeeze to H5 74,762.06 and H6 74,829.24. The abort level for longs on a large gap-up is a 15-min close below TC 74,420.76, which signals the gap is being faded and gap-fill toward OI-S 74,300 and L3 74,173.35 is likely.
|
▲ Upside Path → OI-R From TC 74,420.76, the upside path progresses through OI-R 74,500 → H3 74,455.83 → H4 74,597.08 → R1 74,606.79 → monthly max pain 74,600 cluster → PDH 74,677.56 → H5 74,762.06 → H6 74,829.24 → R2 74,898.98, with the OI-R at 74,500 being the decisive first gate that determines whether the session becomes a trending day or a range-bound day between 74,300 and 74,500. Note the unusual level ordering: H3 74,455.83 sits inside the OI-R 74,500 zone, meaning H3 and OI-R form a combined resistance cluster that price must clear decisively before H4 74,597.08 becomes the next meaningful target. |
▼ Downside Path → OI-S On failure below BC 74,349.98 in a gap-up scenario, SENSEX falls toward OI-S 74,300 → L3 74,173.35 → PDL 74,163.95 → S1 74,093.18 → L4 74,032.10, with OI-S at 74,300 being remarkably close to BC 74,349.98 (only 49.98 points below BC), meaning that a failure of the gap-up at BC brings price almost immediately into the OI support zone where PE writers will defend by buying SENSEX futures. The convergence of BC 74,349.98 and OI-S 74,300 creates a powerful 50-point support band that is very difficult to breach in a gap-up failure scenario, making aggressive short positions below BC highly risky without first seeing a 15-min close below OI-S 74,300. |
| 🔴 OI-R: OI-R at **74,500** (CE max OI for SENSEX month) in a gap-up scenario is the most critical intraday level of the day — positioned only 185.41 points above the previous close and directly above TC 74,420.76, it creates an immediate gamma wall that CE writers will defend through futures sales as soon as price approaches, making any sustained move above 74,500 a genuine breakout that forces short-covering and delta-hedging buying from CE writers. A confirmed 15-min close above 74,500 in a gap-up scenario is one of the most powerful bullish signals for SENSEX intraday, as it means CE writers at 74,500 have been overwhelmed and must cover, accelerating the move to H4 74,597.08 and R1 74,606.79. | 🟢 OI-S: OI-S at **74,300** (PE max OI for SENSEX week) in a gap-up scenario is an extremely important near-term support level — only 14.59 points below the previous close of 74,314.59 and approximately 50 points below BC 74,349.98, it means that any gap-up failure that causes price to slide below BC immediately triggers PE writer support activity at 74,300. The proximity of OI-S to both the previous close and BC creates a very tight support cluster (74,300 — 74,349.98) that gives risk-defined downside for gap-up traders: buying above TC 74,420.76 with a stop at OI-S 74,300 represents only a 120-point risk for a potential 200-500 point upside toward PDH-H5 zone. |
⚡ Key Trigger: The primary trigger for a higher open on SENSEX is the **first 15-min candle close above TC 74,420.76** (narrow CPR confirmation rule) — given the ascending structure and trending market, a confirmed hold above TC 74,420.76 on the first candle signals that buyers are in control and the ascending CPR is acting as support, with the immediate next test being OI-R at 74,500 just 79.24 points above. The critical complication is that OI-R at 74,500 acts as a secondary trigger: if the first 15-min candle closes above TC 74,420.76 but price is stalling at OI-R 74,500, traders must wait for a 15-min close ABOVE 74,500 to confirm the OI wall is breached before targeting H4 74,597.08 — failure to break 74,500 on the first two candles is a sell signal back toward TC 74,420.76.
▼ Lower Open (Gap Down) — Open < Prev Close
▼ Bearish
Open lands: With an ascending CPR where BC (74,349.98) is already 35.39 points above yesterday's close (74,314.59), any gap-down open places SENSEX well below BC 74,349.98 and below the entire ascending CPR band — even a minor gap-down creates an immediate bearish scenario where price falls below OI-S at 74,300 (since prev close was only 14.59 points above OI-S), which is the most dangerous aspect of a gap-down for SENSEX.
CPR role: Overhead Resistance — the entire CPR band (74,349.98 — 74,420.76) is overhead resistance above the gap-down open; crucially, even OI-S at 74,300 may be breached on a gap-down since the previous close was only 14.59 points above it.
Minor Gap (0.05–0.25%) — Structure Dominant
A minor gap-down of 0.05%–0.25% opens SENSEX in the range of approximately 74,129 to 74,277, placing price below OI-S at 74,300 and near L3 at 74,173.35 or between PDL 74,163.95 and S1 74,093.18 — this is an extremely bearish opening configuration because even a minor gap-down breaches the OI support at 74,300, triggering potential stop-losses from PE writers at 74,300 who now face in-the-money puts and must cover by selling SENSEX futures. The ascending narrow CPR sits overhead as resistance (BC 74,349.98 — TC 74,420.76) and the key test is whether OI-S at 74,300 (now above the open) will attract buying — a 15-min close above OI-S 74,300 signals potential recovery, while a continued hold below 74,300 confirms bearish acceleration toward L3 74,173.35 and PDL 74,163.95. From a minor gap-down, the bear targets are L3 74,173.35 → PDL 74,163.95 → S1 74,093.18 → L4 74,032.10, while recovery requires reclaiming OI-S 74,300 first, then BC 74,349.98, before the ascending CPR structure can reassert bullish control.
Significant Gap (0.25–0.5%) — Balanced
A significant gap-down of 0.25%–0.50% opens SENSEX in the range of approximately 73,943 to 74,129, placing price near or below L4 74,032.10 and below S1 74,093.18 — at this level, the ascending narrow CPR sits approximately 220-380 points overhead, making recovery to the CPR band an intraday near-impossibility and the session becomes firmly bearish-trending with the wide CPR acting as a distant target for multi-day recovery. The structure is clear: two 30-min closes below L3 74,173.35 (even though the open may already be below L3) confirm continuation toward L4 74,032.10 → L5 73,867.12 → S2 73,871.76, with PUT writer covering at 74,300 (now 220+ points above) creating overhead selling pressure as their delta-hedging flows reverse (they now buy puts back). Monthly straddle at 1,011 points means a 0.50%+ gap (~373+ points from 74,314.59) brings price to approximately 73,942, consuming 37% of the monthly straddle at open and suggesting the daily range has strong potential for downside continuation toward L5 73,867.12 and L6 73,799.94.
Large Gap (>0.5%) — Gap Direction Dominant
A large gap-down exceeding 0.50% opens SENSEX below approximately 73,942, potentially reaching L5 73,867.12 or L6 73,799.94 at the open — the Camarilla extreme downside zone is now the opening price and mean-reversion probability is statistically elevated, but the ascending narrow CPR structure warning is that the mean-reversion bounce will face CPR band resistance (74,349.98 — 74,420.76) which is now 400-600 points above the gap-down open. Market psychology at large gap-downs into Camarilla L5-L6 zone typically produces a sharp initial stab lower followed by a rapid bounce — the monthly straddle of 1,011 points means a 0.50%+ gap that opens at L5-L6 has already moved approximately 447-515 points, consuming 44-51% of the monthly straddle, making straddle sellers panic-cover their short puts and creating the mechanical bounce. The practical trading approach is to fade the initial extreme at L5 73,867.12 or L6 73,799.94 with a stop below L6, targeting S2 73,871.76 → S1 74,093.18 → L4 74,032.10 on the bounce, but not chasing the recovery above OI-S 74,300 without two 30-min confirmations.
|
▲ Upside Path → OI-R The recovery path from a gap-down progresses through OI-S 74,300 → BC 74,349.98 → P 74,385.37 → TC 74,420.76 → H3 74,455.83 → OI-R 74,500, with each level requiring a 15-min candle confirmation given the narrow CPR framework — OI-S at 74,300 is the first and most important recovery gate because PE writers who are now in-the-money will start covering (buying back puts) as price approaches 74,300 from below, creating mechanical buying support. A clean hold above BC 74,349.98 for two consecutive 15-min candles is the signal that the recovery is genuine and not merely a dead-cat bounce, with TC 74,420.76 as the session high target in a successful recovery scenario. |
▼ Downside Path → OI-S The bear path from a gap-down extends through L3 74,173.35 → PDL 74,163.95 → S1 74,093.18 → L4 74,032.10 → L5 73,867.12 → S2 73,871.76 → L6 73,799.94 → S3 73,579.57, with L4 at 74,032.10 being the psychological 74,000 level where significant retail and institutional stop-losses are clustered, making a breach of 74,000 a momentum-accelerating event. OI-S at 74,300 (now overhead as resistance in a gap-down scenario) creates the unusual dynamic where the monthly max pain at 74,600 and OI-S at 74,300 are both above the current price, meaning ALL the magnetic levels are above the gap-down open, which actually creates a stronger recovery probability after the initial panic exhausts near L4-L5. |
| 🔴 OI-R: OI-R at **74,500** in a gap-down scenario is the primary recovery ceiling — CE writers at 74,500 who were previously under pressure from the ascending CPR breakout possibility are now comfortable as price falls away from their strike, and their comfortable delta-negative position means they have no incentive to cover, actually adding to the weight of overhead resistance. Practically, in a gap-down scenario, OI-R at 74,500 creates a triple resistance cluster with CPR TC at 74,420.76 and H3 at 74,455.83, making any intraday recovery that reaches 74,420-74,500 an aggressive short opportunity with excellent risk-reward for experienced traders. | 🟢 OI-S: OI-S at **74,300** (PE max OI for SENSEX week) in a gap-down scenario is both the most important support level AND a near-term overhead resistance level once breached — the paradox is that with the previous close at 74,314.59 (only 14.59 points above OI-S), a minor gap-down immediately places price below this massive PE writing wall, turning OI-S from floor to ceiling in the first candle. PE writers at 74,300 who are now in-the-money on their short puts face a binary decision: cover (adding buying pressure) or margin-call selling (adding bearish pressure), and the first 30-min price action will reveal which is dominant — a rapid bounce back above 74,300 within 30 minutes signals covering, while sustained trading below 74,300 signals forced liquidation and accelerates the decline toward L3 74,173.35. |
⚡ Key Trigger: The bear confirmation for a gap-down SENSEX is a **15-min close below L3 74,173.35** (narrow CPR confirmation rule requiring first 15-min candle direction), which confirms that even the Camarilla mean-reversion support has failed and the downside path to PDL 74,163.95 → S1 74,093.18 → L4 74,032.10 is open. The bull recovery trigger is a **15-min close above OI-S 74,300** — since OI-S is closer to the gap-down open than BC 74,349.98, reclaiming OI-S 74,300 is the first necessary step for bulls, and only a subsequent 15-min close above BC 74,349.98 confirms that the ascending CPR structure is being restored, targeting P 74,385.37 and TC 74,420.76 in sequence.
◆ Near Flat Open — Open ≈ Prev Close (±0.05%)
◆ Neutral
Open lands: A ±0.05% flat open from 74,314.59 places SENSEX in the range of 74,277 to 74,352 — this positions price just below OI-S 74,300 (at the lower end of the range) to just inside BC 74,349.98 (at the upper end), meaning a flat open creates an immediate test of both the OI support level (74,300) and the ascending CPR's lower band (BC 74,349.98).
CPR role: Compression Band and Decision Zone — the 71-point gap between OI-S 74,300 and TC 74,420.76 (with BC 74,349.98 and OI-S 74,300 flanking the flat-open range) creates an extremely compressed decision band where the first 15-min candle simultaneously tests the OI support floor and the CPR band resistance ceiling.
Near Flat (±0.05%)
A flat open on SENSEX with an ascending narrow CPR (width 0.10%) is a high-information setup that is uniquely complex because the flat-open range (74,277 — 74,352) directly overlaps with both OI-S at 74,300 (PE max OI) and BC at 74,349.98, creating a situation where CPR analysis and OI positioning simultaneously provide conflicting signals — the ascending CPR says buy above BC 74,349.98, while OI-S at 74,300 says the market is pricing heavy put protection right at current levels, meaning a break below 74,300 is structurally significant. The specific values define the battle: **BC 74,349.98** is the ascending CPR support that must hold for bullish trending to commence, **OI-S 74,300** is the PE mass base only 49.98 points below BC, and **TC 74,420.76** is the confirmation level for full bullish control — a flat open that holds between 74,300 and 74,349.98 creates a natural 50-point support band where both CPR and PE writers defend simultaneously. With CPR width at 0.10% (at the boundary of narrow classification, just meeting the 0.10% threshold), trending day probability is elevated, and the first 15-min candle IS the trade — an ascending narrow CPR with a flat open below BC generates the classic ascending trend reversal scenario (Ascending BUT prev_close < today BC), where the market needs to reclaim BC quickly to avoid two-session weakness below the CPR band. The bull trigger is a **first 15-min candle close above TC 74,420.76** targeting H3 74,455.83 → OI-R 74,500 → H4 74,597.08; the bear trigger is a **first 15-min candle close below OI-S 74,300** (which is the more meaningful bear signal than simply BC, given PE dynamics) targeting L3 74,173.35 → PDL 74,163.95 → S1 74,093.18 — between TC 74,420.76 and OI-S 74,300, price is in no-trade zone for positional traders.
|
▲ Upside Path → OI-R From TC 74,420.76, the confirmed bull path progresses to H3 74,455.83 → OI-R 74,500 → H4 74,597.08 → R1 74,606.79 → monthly max pain 74,600 cluster → PDH 74,677.56 → H5 74,762.06 → H6 74,829.24, with H3 74,455.83 and OI-R 74,500 forming a tight 44-point resistance cluster that is the session's most important upside gate — a clear 15-min close above OI-R 74,500 with volume triggers short-covering from CE writers and accelerates toward H4 74,597.08 and the monthly max pain zone at 74,600. The ascending narrow CPR trending structure combined with a flat open creates the most powerful trending day setup, and if OI-R 74,500 is cleared, the full upside target for the session is H5 74,762.06 representing a 447-point move from the previous close. |
▼ Downside Path → OI-S From OI-S 74,300 (the effective bear trigger given PE dynamics), the bear path extends through L3 74,173.35 → PDL 74,163.95 → S1 74,093.18 → L4 74,032.10 → L5 73,867.12 → S2 73,871.76, with retail stop-losses clustered below PDL 74,163.95 and the psychological 74,000 level at L4 74,032.10 creating acceleration points in the bear cascade. The Camarilla L3 74,173.35 is only 126.65 points below OI-S 74,300, meaning a breach of OI-S quickly exposes L3 and PDL in the same 15-30 minute window, making the initial bear move sharp and fast — experienced intraday traders should enter shorts on first 15-min close below 74,300 with target L3 74,173.35 as minimum and stop above BC 74,349.98. |
| 🔴 OI-R: OI-R at **74,500** (CE max OI for SENSEX month) in a flat-open scenario is the single most important intraday level because it sits only 185.41 points above the previous close and directly above TC 74,420.76 — CE writers at 74,500 have a massive vested interest in keeping SENSEX below 74,500 through expiry (24-Sep-2026, monthly max pain 74,600), and their delta-hedging activity (selling futures as price approaches 74,500) creates a powerful gravity effect. If the flat-open bull thesis plays out and TC 74,420.76 is broken, the ability to clear OI-R 74,500 on strong volume becomes the defining moment of the session — a clean break triggers CE covering flows that add 100-200 additional points of momentum, while a rejection at 74,500 creates the highest-probability mean-reversion short of the day back toward P 74,385.37 and BC 74,349.98. | 🟢 OI-S: OI-S at **74,300** (PE max OI for SENSEX week) in a flat-open scenario is simultaneously a support floor AND the bear trigger — the paradox of a flat open between 74,277 and 74,352 is that OI-S 74,300 sits inside the potential opening range, meaning price may test this level within the very first 15-min candle. PE writers at 74,300 will aggressively buy SENSEX futures if price dips toward 74,300 to protect their short put positions from going significantly in-the-money, creating a mechanical support floor; however, if buying fails to hold 74,300 and a 15-min candle closes below it, the same PE writers switch to risk-management mode and begin covering (buying puts back, selling futures), which accelerates the decline and makes OI-S the most actionable bear trigger level in this scenario. |
⚡ Key Trigger: **First 15-min candle close above TC 74,420.76 = Bull trigger** with first target H3 74,455.83 and immediate test of OI-R 74,500; **first 15-min candle close below OI-S 74,300 = Bear trigger** with first target L3 74,173.35 and continuation to PDL 74,163.95 — the reason TC 74,420.76 and OI-S 74,300 are the structural fulcrums (rather than just BC 74,349.98) is that in a flat-open ascending trend reversal scenario, BC alone is not sufficient to confirm bullish control (two sessions below BC would indicate structural weakness), and OI-S at 74,300 provides a PE-defended floor that separates mild consolidation from aggressive selling. Traders who go long at open must place stops below OI-S 74,300 (risk of only ~50 points from BC area) and target TC 74,420.76 first, then H3 74,455.83 — this is the highest reward-to-risk entry structure of all three SENSEX scenarios.
📊 VIX Insight: India VIX data is unavailable for this session, which introduces an additional layer of uncertainty for premium-based trading strategies — without a quantitative fear gauge, traders should rely on the NIFTY weekly straddle of **239.25 points** and monthly straddle of **386.65 points** as the primary implied volatility proxies, and calibrate position sizes conservatively given the VIX blind spot. Historically, sessions without VIX data confirmation tend to see wider bid-ask spreads in options and more erratic intraday premium behavior, reinforcing the importance of level-based CPR and Camarilla frameworks over naked premium selling.
Overall View:
For 18 Sep 2026, the composite picture across NIFTY, BankNifty, and SENSEX is one of structural divergence: NIFTY's ascending narrow CPR (0.02% width) positions it for a high-probability trending day with bullish lean if TC 23,278.60 holds on the first 15-min candle, while BankNifty's wide overlapping CPR (0.29% width) and close below BC 56,138.67 signal range-bound weakness where bears maintain the structural edge below BC 56,138.67. SENSEX presents the most compressed and critical setup with OI-R at 74,500 and OI-S at 74,300 creating a 200-point OI pinch zone around the previous close of 74,314.59, making the opening 15-min candle direction the most decisive moment of the day across all three indices — traders should prioritize NIFTY direction as the macro lead, manage BankNifty independently as a weaker index, and treat SENSEX's OI band as a binary trigger with outsized momentum once either 74,300 or 74,500 is decisively broken.
For 18 Sep 2026, the composite picture across NIFTY, BankNifty, and SENSEX is one of structural divergence: NIFTY's ascending narrow CPR (0.02% width) positions it for a high-probability trending day with bullish lean if TC 23,278.60 holds on the first 15-min candle, while BankNifty's wide overlapping CPR (0.29% width) and close below BC 56,138.67 signal range-bound weakness where bears maintain the structural edge below BC 56,138.67. SENSEX presents the most compressed and critical setup with OI-R at 74,500 and OI-S at 74,300 creating a 200-point OI pinch zone around the previous close of 74,314.59, making the opening 15-min candle direction the most decisive moment of the day across all three indices — traders should prioritize NIFTY direction as the macro lead, manage BankNifty independently as a weaker index, and treat SENSEX's OI band as a binary trigger with outsized momentum once either 74,300 or 74,500 is decisively broken.
Disclaimer: KRV Prime provides educational and informational content relating to financial markets. Articles, research, examples, charts, strategies and tools are provided for educational purposes and should not be interpreted as personalised investment advice or a guarantee of financial performance. Markets involve risk, including possible loss of capital. Past performance does not guarantee future results. KRV Prime is not a SEBI Registered Investment Adviser or Research Analyst.