
Index Research
Intraday Analysis for 19 Aug 2026
KRVFinMart18 August 202659 min
Educational/Derived AnalysisSource: KRVFinMart Research Desk (End-of-Day)As of 18 Aug 2026, 04:25 PM IST
Intraday Analysis for 19 Aug 2026
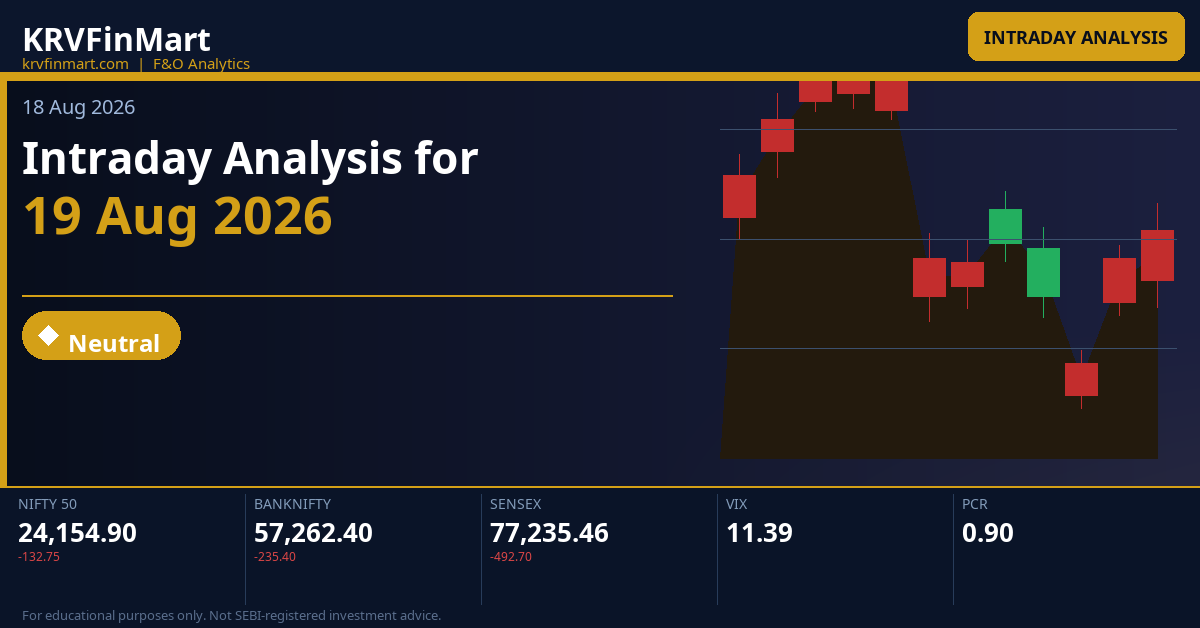
Markets closed lower on 18 Aug 2026 with Nifty shedding 0.55% to 24,154.90, BankNifty falling 0.41% to 57,262.40, and Sensex declining 0.63% to 77,235.46, leaving all three indices at or near their session lows. India VIX data is unavailable for this session, making it critical to rely on OI structure, straddle premiums, and CPR positioning to gauge implied volatility and directional conviction for 19 Aug 2026. All three day-CPRs are Descending-Medium, confirming that the CPR bands for 19 Aug sit below yesterday's price structure, which means a flat-to-lower open places the market at or near the TC — the first battleground — while a gap-down drives price directly into or below the CPR, reinforcing the bearish structural tilt heading into the session.
Key Market Signals — Intraday Setup
All three indices — Nifty, BankNifty, and Sensex — closed at or near their respective PDLs on 18 Aug 2026, and all three carry Descending-Medium day-CPRs for 19 Aug, meaning the entire CPR band sits below yesterday's close, creating a structurally bearish opening framework where the TC becomes the first overhead resistance to overcome before any sustainable recovery can be established.
Deep Technical Analysis & Levels

NIFTY
Descending — Medium (Width 0.16%)
▼ Bearish
Market Structure Balanced or transitional | Straddle Weekly ATM 24150 straddle (Call 4.85 + Put 0.05) = **4.90 pts** — this negligible straddle premium implies the weekly expiry is effectively pricing near-zero expected move for the remaining life of this week's contract, confirming that the weekly series is expiring very soon and intraday moves will be dominated by monthly straddle dynamics. The Monthly ATM 24150 straddle (Call 162.80 + Put 106.45) = **269.25 pts**, implying a one-standard-deviation expected move of roughly ±269 pts from 24,150 — placing the monthly range roughly between 23,881 and 24,419, which brackets the CPR band (BC 24,174.02 to TC 24,212.28) tightly within the expected zone and confirms that 19 Aug is likely to be a high-decision day within a compressed range. | Max Pain Weekly Max Pain = **24,200** and Monthly Max Pain = **24,300** — the weekly max pain at 24,200 is significant because it sits just above the day's TC (24,212.28) and directly at the OI-Resistance (CE wall at 24,200), suggesting option sellers are structurally incentivised to pin Nifty near 24,200 for the weekly expiry, creating a gravitational pull toward that level that traders must account for when planning upside targets. |
Tomorrow's Complete Level Map
OI-R: 24,200 R3: 24,346.15 H6: 24,269.65 H5: 24,254.86 R2: 24,307.90 H4 ▶: 24,218.01 R1: 24,231.40 PDH: 24,269.65 H3 ↩: 24,186.46
TC: 24,212.28 P: 24,193.15 BC: 24,174.02
L3 ↩: 24,123.34 PDL: 24,154.90 S1: 24,116.65 L4 ▶: 24,091.79 S2: 24,078.40 L5: 24,054.94 L6: 24,040.15 S3: 24,001.90 OI-S: 24,150
↩ = Camarilla reversal point | ▶ = Camarilla breakout/breakdown trigger | OI-R/OI-S = Options wall (CE/PE max OI)
▲ Higher Open (Gap Up) — Open > Prev Close
▲ Bullish
Open lands: For a Descending CPR, a gap-up places the open above the TC at 24,212.28. Since the entire CPR band (BC 24,174.02 to TC 24,212.28) is below yesterday's close of 24,154.90, a gap-up above prev close means the market opens above the TC, which is directly above the entire descending CPR band, thereby shifting the CPR band from overhead resistance into potential support below the open.
CPR role: Launch pad / Support below — in a gap-up scenario on a Descending CPR, the TC (24,212.28) immediately becomes first support, and the entire CPR band (BC 24,174.02–TC 24,212.28) transitions into a demand zone that bulls must defend to sustain the gap.
Minor Gap (0.05–0.25%) — Structure Dominant
A minor gap-up of 0.05–0.25% would place the Nifty open in the range of approximately 24,166–24,215, which is inside the CPR band or just marginally above TC 24,212.28 — a zone where the descending CPR structure creates immediate friction. In this gap zone, the Camarilla H3 at 24,186.46 and the OI-Resistance at 24,200 both sit within the CPR band itself, meaning the open is into a dense cluster of mean-reversion levels and the CE wall, reducing the probability of a clean upside breakout. The first 30-minute candle's close relative to TC 24,212.28 is the critical confirmation: a sustained hold above TC confirms the CPR as support and targets R1 at 24,231.40 and then H4 at 24,218.01 as the next intraday hurdles, while failure to hold TC re-engages the bearish CPR thesis with BC at 24,174.02 as the next test.
Significant Gap (0.25–0.5%) — Balanced
A significant gap-up of 0.25–0.50% places the open between approximately 24,215 and 24,275, which is clearly above TC 24,212.28 and directly into the H4 Camarilla level at 24,218.01 and the PDH zone at 24,269.65 — this is a gap into meaningful resistance confluence. The gap-fill risk is substantial here because the OI-Resistance CE wall at 24,200 and weekly max pain at 24,200 both lie below the open, creating a natural magnet for gap-fill as option sellers defend the 24,200 strike; delta-hedging flows from expiring weekly options will amplify selling pressure at the open if the market cannot sustain momentum above 24,218.01 within the first 30 minutes. If sustained above H4 24,218.01, the upside path opens toward H5 24,254.86 and H6 24,269.65 (matching PDH), but traders should book partial profits at R1 24,231.40 given the Medium CPR width confirmation rule requiring a 30-minute close.
Large Gap (>0.5%) — Gap Direction Dominant
A large gap-up of more than 0.50% would place the open above approximately 24,275, clearing the PDH at 24,269.65 and entering entirely uncharted territory for the recent session range — this is a gap-dominant scenario where CPR structure takes a back seat to momentum. The probability of a clean gap-fill back to PDH 24,269.65 is moderate but not immediate; however, because the weekly straddle at 24,150 shows near-zero put premium (0.05 pts) indicating options have decayed completely, and the monthly straddle implies only ±269 pts of expected move, any opening above 24,424 would be statistically extreme and would invite aggressive short-selling from institutional desks. The abort level for the large-gap bull thesis is a break back below PDH 24,269.65 within the first 30 minutes, while the target if momentum holds is R2 at 24,307.90 and R3 at 24,346.15, with OI-Resistance at 24,200 now acting as a former ceiling turned support floor.
|
▲ Upside Path → OI-R From a confirmed close above TC 24,212.28, the upside path progresses to H3 24,186.46 (already below the open in gap-up, so irrelevant as resistance), H4 24,218.01 (first Camarilla breakout trigger), R1 24,231.40 (first Traditional target — take partial profits here per Medium CPR rules), H5 24,254.86 (second Camarilla extension), and H6 24,269.65 matching PDH (third partial exit), with OI-Resistance at 24,200 now serving as support below, not a ceiling above. Genuine momentum in the upside path is confirmed by each successive 30-minute candle closing above the previous high with volume expansion, particularly above H4 24,218.01 and R1 24,231.40, as these are the levels where short-covering from overnight positioned bears accelerates the move. |
▼ Downside Path → OI-S If the gap-up open fails to hold TC 24,212.28 on the first 30-minute close, the CPR band re-engages as overhead resistance and the failure path runs through P 24,193.15, then BC 24,174.02 (loss of BC confirms full CPR rejection), then L3 24,123.34 (Camarilla mean-reversion support — expect a bounce attempt here), and ultimately toward OI-S at 24,150 which also coincides with PDL 24,154.90 and the ATM strike for both weekly and monthly options. Loss of TC in a gap-up scenario is a high-probability reversal signal because it transforms a bullish gap into a bull trap, triggering stop-losses from early long positions and accelerating the decline toward the OI-S at 24,150. |
| 🔴 OI-R: The OI-Resistance at 24,200 (weekly CE max OI) is a critical structural ceiling that will dominate price action on 19 Aug given the weekly expiry proximity — CE writers at 24,200 will aggressively defend this level through delta-hedging by selling Nifty futures whenever price approaches or touches 24,200 from below, effectively capping the upside. In a gap-up scenario where the open is above 24,212.28 (i.e., already above OI-R 24,200), this level flips to a support reference where any pullback toward 24,200 will attract short-covering from CE buyers unwinding positions, creating a floor dynamic that supports the bull thesis as long as 24,200 holds. | 🟢 OI-S: The OI-Support at 24,150 (weekly PE max OI) aligns almost exactly with PDL 24,154.90 and the ATM strike for weekly options, making it a critical abort level for gap-up bulls — if the gap fails and price slides back to 24,150, it signals that the weekly option structure is fully reversing and PE writers at 24,150 face losses, which could trigger unwinding of put shorts and push Nifty below this floor. In a gap-up scenario, OI-S at 24,150 is primarily the last line of defense for bulls; a closing break below 24,150 on a 30-minute candle confirms the gap was a fakeout and pivots the intraday bias fully bearish with L3 24,123.34 as the next meaningful target. |
⚡ Key Trigger: The primary trigger in the gap-up scenario is a **first 30-minute candle close above TC 24,212.28** with above-average volume — this confirms that the Descending CPR has been definitively reclaimed and the CPR band has transitioned from resistance to support, opening the path toward R1 24,231.40 and the OI wall at 24,200 (already below the open in this scenario). If the open gaps above TC but the 30-minute candle fails to hold above TC 24,212.28, it signals a trap-door reversal where the descending CPR reasserts overhead pressure and the OI-S at 24,150 (which aligns closely with PDL 24,154.90) becomes the immediate bear target.
▼ Lower Open (Gap Down) — Open < Prev Close
▼ Bearish
Open lands: For a Descending CPR, a gap-down places the open below the TC at 24,212.28, and since the entire CPR band already sits below yesterday's close of 24,154.90, a gap-down below prev close means the open is directly inside the CPR band (between BC 24,174.02 and TC 24,212.28) for a minor/moderate gap-down, or below BC 24,174.02 for a significant/large gap-down — in either case, the CPR band looms above as overhead resistance.
CPR role: Overhead resistance / Bearish control zone — the entire CPR band (BC 24,174.02 to TC 24,212.28) acts as a supply zone in the gap-down scenario, and any recovery attempt into this band will face selling pressure from bears who shorted at yesterday's close and will use the CPR as their cover-and-reload zone.
Minor Gap (0.05–0.25%) — Structure Dominant
A minor gap-down of 0.05–0.25% places the open between approximately 24,094 and 24,143, which is below BC 24,174.02 and in the vicinity of L3 24,123.34 and L4 24,091.79 — a zone where the Camarilla framework expects mean-reversion buying attempts. The CPR band (BC 24,174.02 to TC 24,212.28) now sits as a full overhead resistance block above the open, and because this is a Descending-Medium CPR, the structure inherently favours sellers using the CPR band as a reload zone. The first 30-minute candle's behaviour is decisive: a reclaim of BC 24,174.02 within 30 minutes suggests gap-fill momentum toward P 24,193.15 and TC 24,212.28, but failure to reclaim BC confirms the bear thesis with targets at L3 24,123.34 and S1 24,116.65, followed by L4 24,091.79.
Significant Gap (0.25–0.5%) — Balanced
A significant gap-down of 0.25–0.50% places the open between approximately 24,034 and 24,094, which breaks below L4 24,091.79 and approaches L5 24,054.94 — this is a meaningful technical break that signals institutional selling pressure rather than mere gap noise. The OI-Support at 24,150 lies above the open in this scenario, confirming that PE writers at 24,150 are under stress; PUT writing conviction depends on whether the open stabilises near L5 24,054.94 where PE buying demand typically emerges for overnight positioned traders. The 30-minute reclaim rule applies: if Nifty can reclaim OI-S 24,150 and then BC 24,174.02 within 30–60 minutes, it is a failure-and-resume recovery signal; failure to reclaim 24,150 within the first hour targets L5 24,054.94 and L6 24,040.15 as the next downside stations.
Large Gap (>0.5%) — Gap Direction Dominant
A large gap-down of more than 0.50% places the open below approximately 24,034, which is below L5 24,054.94 and approaching L6 24,040.15 and S3 24,001.90 — a panic-level opening that requires VIX context for full assessment, which is unavailable today, making the monthly straddle of 269.25 pts the primary gauge of expected extremity. At these levels, the market will initially test L6 24,040.15 and S3 24,001.90 as the immediate downside anchors, while aggressive recovery traders will watch for a sharp reversal candlestick pattern within the first 15 minutes that signals straddle monetisation by option sellers closing profitable puts. The abort level for any recovery trade is a sustained close below L6 24,040.15 on two consecutive 30-minute candles, which shifts the target to S3 24,001.90 and below; the upside recovery level to watch is OI-S 24,150, which must be reclaimed before any meaningful bull thesis is reinstated.
|
▲ Upside Path → OI-R The recovery path in the gap-down scenario runs from the open → BC 24,174.02 (first resistance — must close above on 30-min candle) → P 24,193.15 (pivot reclaim signals balanced recovery) → TC 24,212.28 (full CPR reclaim — bull control restored) → OI-Resistance 24,200 (CE wall — the ultimate ceiling for any recovery, which is effectively coincident with TC in this case). Each step of this recovery path requires a 30-minute close confirmation per the Medium CPR width rule, and partial long profits should be taken at P 24,193.15 and TC 24,212.28 given the structural overhead pressure from the CE OI wall at 24,200. |
▼ Downside Path → OI-S The bear continuation path runs from the open → L3 24,123.34 (Camarilla mean-reversion zone — expect a bounce attempt, scalp longs here with tight stops) → S1 24,116.65 (Traditional first support — partial short profit booking zone) → L4 24,091.79 (Camarilla breakdown trigger — loss of this level signals institutional distribution) → L5 24,054.94 → L6 24,040.15 → S3 24,001.90 → OI-S 24,150 (note: OI-S at 24,150 lies above L3 in this scenario and acts as a pre-gap resistance once breached on the way down). Retail stop-losses clustered just below L3 24,123.34 and L4 24,091.79 will be systematically triggered if Nifty closes below these Camarilla levels on 30-minute candles, accelerating the decline toward S2 24,078.40 and L5 24,054.94. |
| 🔴 OI-R: The OI-Resistance at 24,200 (CE max OI wall) acts as a distant overhead ceiling in the gap-down scenario — institutional CE writers at 24,200 have no immediate threat to their positions and will therefore not engage in panic covering, which means there is no natural short-covering fuel from that direction to power a recovery. The CE wall at 24,200 will only become relevant if Nifty stages a surprising recovery all the way back to TC 24,212.28 and above, at which point CE writers will begin delta-hedging by buying Nifty futures, which paradoxically adds fuel to the recovery and could create a squeeze above 24,212.28 toward R1 24,231.40. | 🟢 OI-S: The OI-Support at 24,150 (PE max OI) is the primary target and bear confirmation level in the gap-down scenario — PE writers who sold puts at 24,150 will face mounting losses as Nifty approaches this strike, and their unwinding (buying back puts) combined with fresh PE buying from panicking longs creates explosive downside momentum at and below 24,150. Once OI-S 24,150 is broken on a 30-minute close, PUT writing conviction collapses and the next meaningful support shifts to L3 24,123.34 and S1 24,116.65, where new PE support writing may emerge and cause a temporary stabilisation before the broader trend resumes. |
⚡ Key Trigger: The critical trigger in the gap-down scenario is **failure or success in reclaiming BC 24,174.02 within the first 30 minutes** — a 30-minute candle close above BC 24,174.02 is the bull trigger confirming gap-fill momentum toward P 24,193.15 and TC 24,212.28, while failure to reclaim BC within 30 minutes is the bear confirmation that activates the full downside path toward L3 24,123.34 and S1 24,116.65. For traders entering short on the gap-down, the stop-loss must be placed above TC 24,212.28 (above the entire CPR band), because any close above TC on the Descending CPR signals a complete structural reversal and invalidates the bearish setup.
◆ Near Flat Open — Open ≈ Prev Close (±0.05%)
◆ Neutral
Open lands: A flat open of ±0.05% on yesterday's close of 24,154.90 places the open between approximately 24,143 and 24,167. Since TC is 24,212.28 and BC is 24,174.02, a flat open on a Descending CPR places the market at or near yesterday's close — which is BELOW BC 24,174.02 — meaning the open is below the entire descending CPR band, and the CPR sits as a full overhead resistance structure above the open price.
CPR role: Decision zone with overhead pressure — the flat open below the entire CPR band (BC 24,174.02 to TC 24,212.28) creates a classic 'below-CPR-bear-until-reclaimed' setup; the CPR band is neither support nor neutral here, it is a defined resistance block that separates bear continuation from any bull recovery.
Near Flat (±0.05%)
A flat open on a Descending-Medium CPR is a high-information setup because price opening below the entire CPR band (BC 24,174.02 to TC 24,212.28) with zero gap noise means the first 30-minute candle IS the trade — there is no gap bias to filter, only pure structural positioning. The critical reference levels are BC 24,174.02 as the lower edge of overhead resistance and TC 24,212.28 as the upper edge; if Nifty's first 30-minute candle closes above BC 24,174.02, it signals aggressive recovery momentum entering the CPR band and targets TC 24,212.28 and the OI-R at 24,200 as the immediate test zone. The CPR Width of 0.16% (Medium) means the band itself spans only about 38 points (24,174.02 to 24,212.28), which is tight enough to be a single-candle penetration zone — if bulls clear TC 24,212.28 on a 30-minute close, the Descending CPR is fully negated and the session flips to a Medium-confirmed bull setup targeting R1 24,231.40 and H4 24,218.01. Conversely, if the flat open is followed by a 30-minute candle closing below OI-S 24,150 (which coincides with PDL 24,154.90 and the flat open zone), the bear thesis is confirmed with no need to test the CPR band, and the downside path to L3 24,123.34 and S1 24,116.65 opens immediately — this dual-trigger clarity makes the flat open the most tradeable scenario of the three.
|
▲ Upside Path → OI-R From a 30-minute close above BC 24,174.02, the upside path progresses to P 24,193.15 (pivot — first partial profit for aggressive longs), then TC 24,212.28 and H4 24,218.01 (CPR top and Camarilla breakout trigger — second partial), then R1 24,231.40 (Traditional first target — final exit for intraday Medium CPR confirmation), with OI-Resistance at 24,200 acting as the primary ceiling that must be absorbed before sustained upside to H5 24,254.86 becomes viable. The key confirmation for genuine upside momentum is that each 30-minute candle above BC 24,174.02 must show expanding volume and no bearish reversal candle forming at H3 24,186.46, which is the Camarilla mean-reversion zone where first stall or reversal is expected. |
▼ Downside Path → OI-S From a failure to reclaim BC 24,174.02 or a close below OI-S 24,150, the downside path runs through L3 24,123.34 (Camarilla mean-reversion zone — first stall and possible bounce, take partial short profits here), then S1 24,116.65 (Traditional first support — second partial profit for shorts), then L4 24,091.79 (Camarilla breakdown trigger — loss confirms institutional distribution with stop-losses from longs accelerating the fall), then L5 24,054.94 and L6 24,040.15 (Camarilla extension zone — take full short profits per Medium CPR rules and do NOT trail beyond), ultimately approaching S3 24,001.90 only if volume remains elevated and no recovery candle appears at L4. The OI-S at 24,150 converting from support to resistance is the key signal that the downside path is fully active, and traders should watch for any bounce into 24,150–24,174.02 as a short re-entry zone rather than a reversal. |
| 🔴 OI-R: The OI-Resistance at 24,200 (CE max OI) is the dominant overhead ceiling in the flat-open scenario because it sits within the CPR band itself (between BC 24,174.02 and TC 24,212.28), meaning any attempt to reclaim the CPR band must simultaneously fight through the CE writing wall at 24,200 — a double resistance that makes the bull trigger significantly harder to sustain. CE writers at 24,200, with the weekly expiry imminent and weekly max pain at 24,200, are fully incentivised to defend this level aggressively by selling Nifty futures every time price approaches 24,200 from below, creating a feedback loop that suppresses price action and reinforces the descending CPR's overhead character. | 🟢 OI-S: The OI-Support at 24,150 (PE max OI) coincides almost exactly with the flat-open zone (yesterday's close 24,154.90) and PDL 24,154.90, making it the most critical intraday reference level on 19 Aug — it is simultaneously the opening price, the session low from 18 Aug, and the strike where PE writers are maximally positioned. In the flat-open scenario, a break below OI-S 24,150 is a high-conviction bear signal because it triggers PE writer stop-losses (closing protective sell positions), attracts fresh PUT buyers, and removes the only meaningful support below the CPR band, leaving L3 24,123.34 as the next structural anchor approximately 27 points below. |
⚡ Key Trigger: **First 30-minute candle close above BC 24,174.02** = bull trigger initiating recovery toward P 24,193.15, TC 24,212.28, and OI-R 24,200; **first 30-minute candle close below OI-S 24,150** = bear trigger confirming downside continuation toward L3 24,123.34 and S1 24,116.65. The structural fulcrum is BC 24,174.02 because it is the lower boundary of the descending CPR — above it, bulls begin challenging the overhead supply; below it (and below OI-S 24,150), the market has two clear bearish reference points confirming institutional sellers are in full control, and the psychology shifts from 'wait and watch' to 'sell every bounce into BC.'
BANKNIFTY
Descending — Medium (Width 0.16%)
▼ Bearish
Market Structure Balanced or transitional | Straddle Monthly ATM 57300 straddle (Call 430.00 + Put 347.05) = **777.05 pts** — this implies a one-standard-deviation expected intraday-to-expiry move of approximately ±777 pts from 57,300, placing the monthly range between 56,523 and 58,077. This straddle range almost perfectly brackets the OI walls (OI-S 57,000 and OI-R 58,000), confirming that the options market is efficiently pricing the boundaries set by the major put and call writers, and 19 Aug is expected to trade within a 777-point band unless a significant macro catalyst breaks the structure. | Max Pain Monthly Max Pain = **57,600** — this strike is significantly above yesterday's close of 57,262.40 and above the day's entire CPR band (BC 57,308.65 to TC 57,401.15), suggesting that option sellers (primarily CE writers at 58,000 and PE writers at 57,000) are positioned for a recovery back toward 57,600 by monthly expiry on 25 Aug 2026, and this max-pain pull creates a structural bias for BankNifty to gradually recover toward 57,400–57,600 over the coming sessions unless strong selling emerges. |
Tomorrow's Complete Level Map
OI-R: 58,000 R3: 57,859.30 H6: 57,629.79 H5: 57,582.23 R2: 57,722.00 H4 ▶: 57,464.31 R1: 57,492.20 PDH: 57,584.70 H3 ↩: 57,363.35
TC: 57,401.15 P: 57,354.90 BC: 57,308.65
L3 ↩: 57,161.45 PDL: 57,217.60 S1: 57,125.10 L4 ▶: 57,060.50 S2: 56,987.80 L5: 56,942.59 L6: 56,895.01 S3: 56,758.00 OI-S: 57,000
↩ = Camarilla reversal point | ▶ = Camarilla breakout/breakdown trigger | OI-R/OI-S = Options wall (CE/PE max OI)
▲ Higher Open (Gap Up) — Open > Prev Close
▲ Bullish
Open lands: For a Descending CPR on BankNifty, a gap-up places the open above yesterday's close of 57,262.40 and potentially above TC 57,401.15. Since the entire CPR band (BC 57,308.65 to TC 57,401.15) sits below yesterday's close, a minor gap-up opens inside the CPR band, a significant gap-up opens above TC 57,401.15, and a large gap-up opens above H4 57,464.31 and potentially toward PDH 57,584.70.
CPR role: Launch pad / Support below — in the gap-up scenario, the CPR band (BC 57,308.65–TC 57,401.15) transitions from overhead resistance to support below the open, and bulls must defend BC 57,308.65 on any pullback to maintain the gap-up thesis.
Minor Gap (0.05–0.25%) — Structure Dominant
A minor gap-up of 0.05–0.25% places the BankNifty open between approximately 57,291 and 57,405, which means the open sits inside the CPR band (BC 57,308.65 to TC 57,401.15) or just marginally above TC 57,401.15 — a zone where the descending CPR creates structural compression and mean-reversion forces from H3 57,363.35 dominate price action. In this scenario, the CPR band acts as a compression spring: if bulls can secure a 30-minute close above TC 57,401.15 with volume confirmation, the Descending CPR is negated and the upside path toward R1 57,492.20 and H4 57,464.31 opens cleanly. Failure to hold TC 57,401.15 on the first 30-minute close sends BankNifty back into the CPR band and then toward BC 57,308.65, with the OI-S at 57,000 remaining the ultimate downside anchor if BC fails — traders should use P 57,354.90 as the intra-CPR decision pivot.
Significant Gap (0.25–0.5%) — Balanced
A significant gap-up of 0.25–0.50% places the open between approximately 57,405 and 57,549, which is above TC 57,401.15 and approaching H4 57,464.31 — an area where the CPR is fully reclaimed and Camarilla breakout dynamics take over. The gap-fill risk is moderate but concentrated: the entire CPR band (57,308.65–57,401.15) lies significantly below, and any intraday weakness must hold TC 57,401.15 to prevent a complete gap-fill back into the compression zone; the monthly max pain at 57,600 and H5 57,582.23 create a gravitational pull for the significant gap-up to resolve toward these targets. Delta-hedging from CE writers at 58,000 is not yet significant at this level, giving bulls room to run toward H5 57,582.23 and PDH 57,584.70 if the 30-minute candle closes above H4 57,464.31 with expanding volume.
Large Gap (>0.5%) — Gap Direction Dominant
A large gap-up of more than 0.50% places the open above approximately 57,549, potentially at or above PDH 57,584.70 and approaching H6 57,629.79 — a level at which BankNifty would be testing the upper Camarilla extension and entering the zone where the OI-Resistance at 58,000 becomes the primary target for momentum traders but also a significant supply wall from CE writers. At these extreme gap levels, the monthly straddle context (777 pts) suggests that a gap above PDH 57,584.70 is within the expected range but approaching the upper bound, meaning aggressive short-selling from CE writers and delta-hedgers at 58,000 will intensify above 57,600, and the probability of a gap-fill back to H4 57,464.31 within the session increases substantially. The large gap-up trade requires a 30-minute candle close above PDH 57,584.70 to confirm H6 57,629.79 as the next target and OI-R 58,000 as the session ceiling, with the abort level being a close back below H5 57,582.23 on any 30-minute candle.
|
▲ Upside Path → OI-R From a confirmed 30-minute close above TC 57,401.15, the upside path progresses to H3 57,363.35 (below TC — already cleared in gap-up, irrelevant as resistance), H4 57,464.31 (Camarilla breakout trigger — first partial profit per Medium CPR rules), R1 57,492.20 (Traditional first target — second partial exit), H5 57,582.23 and PDH 57,584.70 (third partial, aligned with monthly max pain 57,600), H6 57,629.79 (final Camarilla extension — full exit for intraday longs), with OI-R 58,000 as the session ceiling where CE writing pressure will cap any further extension. Volume confirmation at each step — particularly above H4 57,464.31 and R1 57,492.20 — is mandatory for the Medium CPR confirmation rule; low volume above these levels signals a fading rally rather than genuine institutional buying. |
▼ Downside Path → OI-S In the gap-up failure scenario, the path runs from TC 57,401.15 → P 57,354.90 → BC 57,308.65 (CPR base — critical 30-minute close required to confirm CPR rejection) → L3 57,161.45 (Camarilla mean-reversion zone — first stall) → PDL 57,217.60 (previous session low — psychological support) → S1 57,125.10 (Traditional first support — partial short profit) → L4 57,060.50 (Camarilla breakdown trigger) → OI-S 57,000 (PE max OI wall — primary downside target and PUT monetisation zone). The failure pattern is accelerated by the fact that a gap-up reversal below BC 57,308.65 triggers retail stop-losses from long positions entered on the gap, creating momentum that carries price directly toward L3 57,161.45 without significant pause. |
| 🔴 OI-R: The OI-Resistance at 58,000 (monthly CE max OI) is the ultimate session ceiling for any gap-up extension in BankNifty — institutional CE writers at 58,000 hold massive notional positions that they will defend through systematic futures selling as price approaches this strike, creating a hard resistance wall that is unlikely to be breached intraday without an extraordinary macro catalyst. The CE wall at 58,000 also means that any delta-hedging flow above 57,700 will be directionally suppressive, as CE writers increase their short-futures hedges exponentially as the 58,000 strike is approached, making the OI-R a 'fade zone' rather than a momentum target for intraday positions. | 🟢 OI-S: The OI-Support at 57,000 (PE max OI) is a distant but structurally important floor in the gap-up scenario — it is approximately 262 points below yesterday's close and well outside the expected daily range for a gap-up session, making it irrelevant as an immediate target but critical as the anchor that prevents catastrophic downside. PE writers at 57,000 provide a natural buying floor because they are incentivised to protect their written puts by hedging long below 57,000, ensuring that any gap-up scenario that subsequently reverses will find significant PE writer-induced buying support at and above 57,000. |
⚡ Key Trigger: The primary trigger in BankNifty's gap-up scenario is a **first 30-minute candle close above TC 57,401.15** (for minor gap) or above **H4 57,464.31** (for significant/large gap), confirming the Descending CPR has been reclaimed and momentum is aligned with the monthly max-pain pull toward 57,600. If the gap-up open fails to produce a 30-minute close above TC 57,401.15, the trap-door dynamic activates and the CPR band flips back to overhead resistance, targeting BC 57,308.65 and then L3 57,161.45 as the bear path — the gap becomes a classic bull trap in a Descending CPR structure.
▼ Lower Open (Gap Down) — Open < Prev Close
▼ Bearish
Open lands: For a Descending CPR on BankNifty, a gap-down below yesterday's close of 57,262.40 places the open below the entire CPR band (BC 57,308.65 to TC 57,401.15), since the CPR already sits above yesterday's close. A minor gap-down opens near PDL 57,217.60 or between 57,200–57,250; a significant gap-down opens near L3 57,161.45 to L4 57,060.50; a large gap-down opens at or below L4 57,060.50 and threatens the OI-S at 57,000.
CPR role: Overhead resistance / Bearish control zone — the entire CPR band (BC 57,308.65 to TC 57,401.15) sits approximately 50–140 points above any gap-down open, creating a significant overhead supply block that bears will use as a reload zone and recovery traders must target as the first hurdle to establish intraday recovery.
Minor Gap (0.05–0.25%) — Structure Dominant
A minor gap-down of 0.05–0.25% places the BankNifty open between approximately 57,119 and 57,233, which is below PDL 57,217.60 in the lower portion of this range and around L3 57,161.45 in the deeper portion — both are Camarilla mean-reversion zones where short-covering bounce attempts are expected. The CPR band (BC 57,308.65 to TC 57,401.15) now sits 76–240 points above, acting as a multi-layered overhead resistance, and the first 30-minute candle test is whether BankNifty can recover above PDL 57,217.60 and then attempt BC 57,308.65. If BC 57,308.65 is not reclaimed within 30–45 minutes, the bearish structure solidifies and the downside path targets L3 57,161.45, S1 57,125.10, and L4 57,060.50, with OI-S at 57,000 as the ultimate bear target where PUT monetisation occurs.
Significant Gap (0.25–0.5%) — Balanced
A significant gap-down of 0.25–0.50% places the open between approximately 56,977 and 57,119, which breaks below the critical OI-Support at 57,000 (for the lower end of this range) or sits just above OI-S at 57,000 (for the upper end) — this is the most dangerous gap zone for BankNifty as it directly tests the primary PE max OI wall at 57,000. Opening near or below OI-S 57,000 triggers immediate PE writer stop-loss buying (buying back written puts at a loss) combined with fresh panic PUT buying from retail, creating a violent but potentially short-lived spike below 57,000 that attracts significant contrarian buying — the recovery-and-resume pattern is high probability if the 30-minute candle closes back above 57,000 and reclaims L4 57,060.50. The 30-minute reclaim rule for recovery: close above L4 57,060.50 targets BC 57,308.65; failure to reclaim L4 within 60 minutes confirms bear momentum toward L5 56,942.59 and S2 56,987.80.
Large Gap (>0.5%) — Gap Direction Dominant
A large gap-down of more than 0.50% places the open below approximately 56,977 and into L5 56,942.59 territory or below, which would represent a significant structural breach of the OI-S 57,000 and entry into Camarilla downside extension territory that implies institutional distribution. At these levels, the monthly straddle context (777 pts from 57,300) suggests the move is within the expected extreme range, and straddle sellers will begin aggressively monetising profitable puts, which creates natural selling exhaustion near L5 56,942.59 and L6 56,895.01. The abort level for any recovery in the large-gap scenario is a 30-minute close below L6 56,895.01, which targets S2 56,987.80 (note: S2 lies above L5/L6, indicating the Traditional pivot system converges differently from Camarilla here) and ultimately S3 56,758.00; recovery above OI-S 57,000 on a 30-minute close is the only genuine bull signal.
|
▲ Upside Path → OI-R The recovery path in the gap-down scenario runs from the open → OI-S 57,000 (reclaim — critical bull signal) → L4 57,060.50 (Camarilla reclaim — confirms recovery strength) → L3 57,161.45 (mean-reversion zone — first partial profit for recovery longs) → PDL 57,217.60 (previous session low — psychological resistance) → BC 57,308.65 (CPR base — full recovery signal, second partial profit) → P 57,354.90 and H3 57,363.35 (CPR mid and Camarilla mean-reversion — third partial) → TC 57,401.15 (full CPR reclaim — exit recovery positions, as the Descending CPR at this level signals strong supply from institutional sellers near monthly max pain 57,600). Each step of the recovery must be confirmed with 30-minute closes and increasing volume to validate genuine recovery rather than dead-cat bounce dynamics. |
▼ Downside Path → OI-S The bear continuation path runs from the open → L3 57,161.45 (Camarilla mean-reversion — first bounce attempt, partial short profit) → S1 57,125.10 (Traditional first support — second partial) → L4 57,060.50 (Camarilla breakdown trigger — loss signals institutional bear conviction) → OI-S 57,000 (PE max OI wall — primary PUT monetisation target and highest-probability reversal zone for intraday) → L5 56,942.59 and L6 56,895.01 (Camarilla downside extension — full short exit per Medium CPR rules, do NOT trail below here) → S2 56,987.80 and S3 56,758.00 (Traditional targets only if volume remains strongly bearish). The acceleration of selling below L4 57,060.50 is fuelled by stop-losses from PE writers at 57,000 and from intraday retail longs who entered on perceived support, creating a cascade that typically overshoots before reversing at OI-S 57,000. |
| 🔴 OI-R: The OI-Resistance at 58,000 (monthly CE max OI) is a distant and structurally irrelevant ceiling in the gap-down scenario — CE writers at 58,000 are deep out-of-the-money and have no immediate hedging requirement, meaning they add no incremental selling pressure to the market on this day. However, the existence of the 58,000 OI-R wall is a reminder to traders that even in a recovery scenario, there is a hard institutional supply ceiling approximately 735–750 points above a gap-down open, making any aggressive recovery target above 57,600 (monthly max pain) unrealistic for an intraday session. | 🟢 OI-S: The OI-Support at 57,000 (monthly PE max OI) is the single most important level for BankNifty in the gap-down scenario — it represents the strike where PUT writers have maximum exposure, and a test of this level will trigger either (a) massive PE writer stop-loss unwinding (buying back puts at a loss) plus fresh retail PUT buying, creating a downside overshoot and then a violent snap-back recovery, or (b) if PE writers capitulate and exit, a clean breakdown below 57,000 that signals a structural bearish shift in BankNifty's monthly options positioning. Traders should watch the first 5-minute candle after testing 57,000 carefully: a bullish reversal candle with high volume at 57,000 is the highest-probability long entry of the session, while a sustained break below 57,000 on two consecutive 5-minute candles signals full capitulation and targets L5 56,942.59. |
⚡ Key Trigger: The critical trigger in BankNifty's gap-down scenario is **failure or success in reclaiming BC 57,308.65 within the first 30 minutes** for minor gaps, or **reclaiming OI-S 57,000 and then L4 57,060.50** for significant/large gaps — these are the specific levels where the structural shift from bear continuation to bull recovery occurs. Bear confirmation is a 30-minute candle close below PDL 57,217.60 (for minor gap) or below OI-S 57,000 (for significant/large gap), which activates the full downside path and should prompt short entries with stop-losses above TC 57,401.15 for the full swing, or above BC 57,308.65 for more conservative risk management.
◆ Near Flat Open — Open ≈ Prev Close (±0.05%)
◆ Neutral
Open lands: A flat open of ±0.05% on yesterday's close of 57,262.40 places the open between approximately 57,234 and 57,291. Since BC is 57,308.65 and TC is 57,401.15, a flat open on this Descending CPR places the market approximately 18–75 points BELOW BC 57,308.65 — meaning the open is below the entire descending CPR band, and the CPR band (BC 57,308.65 to TC 57,401.15) represents a clear overhead supply block that must be reclaimed for any bull thesis to materialise.
CPR role: Decision zone with overhead pressure — flat open below the entire CPR band creates a 'prove it' structure where bears have default control and bulls must reclaim BC 57,308.65 before the day can turn constructive; the CPR acts as a resistance wall with H3 57,363.35 (Camarilla) embedded within the band adding further density to the supply zone.
Near Flat (±0.05%)
A flat open on BankNifty's Descending-Medium CPR is a precision-trading setup because the open price is below the entire CPR band (BC 57,308.65 to TC 57,401.15), meaning the first 30-minute candle direction is the sole determinant of whether the session is a CPR-reclaim bull day or a CPR-as-resistance bear day, with zero gap noise to confuse the signal. The critical levels are BC 57,308.65 as the lower boundary of overhead resistance (approximately 18–47 points above the flat open) and TC 57,401.15 as the upper boundary, while Camarilla H3 57,363.35 sits within the band and will cause a stall even if BC is initially reclaimed. The CPR Width of 0.16% (Medium) spans approximately 92 points (57,308.65 to 57,401.15), which means clearing the full CPR band requires two separate 30-minute confirmations — first above BC 57,308.65 and then above TC 57,401.15 — before the bull thesis is fully validated and targets H4 57,464.31 and R1 57,492.20. The monthly max pain at 57,600 creates a gravitational pull that slightly favours the bull reclaim thesis in the flat-open scenario, but the Descending CPR structure means that failure to reclaim BC 57,308.65 within 30 minutes confirms the bear path toward L3 57,161.45 and OI-S 57,000, where the primary intraday short trade should be executed with a stop above TC 57,401.15.
|
▲ Upside Path → OI-R From a 30-minute close above BC 57,308.65, the upside path runs through P 57,354.90 (pivot — first partial profit), H3 57,363.35 (Camarilla mean-reversion zone — expect a stall, watch for rejection candle), TC 57,401.15 (full CPR top — second partial profit and key confirmation level for aggressive bulls), H4 57,464.31 (Camarilla breakout trigger — third partial, confirms institutional buying), R1 57,492.20 (Traditional first target — final exit for Medium CPR intraday), with H5 57,582.23 and monthly max pain 57,600 as the ultimate targets for swing bulls who hold through the session. Volume at each level is the quality filter: thin volume above BC 57,308.65 signals a fakeout recovery that will reverse at H3 57,363.35, while strong volume above TC 57,401.15 confirms genuine institutional participation aligned with the max-pain pull. |
▼ Downside Path → OI-S From a failure to reclaim BC 57,308.65 or a close below PDL 57,217.60, the downside path runs through L3 57,161.45 (Camarilla mean-reversion — first partial short profit, expect bounce attempt), S1 57,125.10 (Traditional first support — second partial), L4 57,060.50 (Camarilla breakdown trigger — third partial, confirms institutional distribution and triggers retail stop-losses below PDL), L5 56,942.59 (Camarilla extension — fourth partial), and ultimately OI-S 57,000 (PE max OI wall — primary downside target for the flat-open bear scenario and the zone where the intraday short should be fully covered per Medium CPR rules). The bear thesis is reinforced by the monthly Descending-Narrow CPR (0.05% width) that signals a trending market structure, suggesting that daily bear momentum may have multi-session implications beyond just 19 Aug. |
| 🔴 OI-R: The OI-Resistance at 58,000 (monthly CE max OI) is structurally distant from the flat-open zone and acts as an invisible ceiling for bull extension — CE writers at 58,000 do not need to actively hedge in the flat-open scenario unless price approaches 57,700+, making OI-R 58,000 a session boundary marker rather than an active intraday resistance level. However, awareness of the OI-R at 58,000 is important for flat-open bull traders because it defines the theoretical maximum upside for the session (approximately 738 points from the open), confirming that any position beyond R1 57,492.20 and H5 57,582.23 is trading in low-probability territory and should use smaller position sizes. | 🟢 OI-S: The OI-Support at 57,000 (monthly PE max OI) is approximately 262–291 points below the flat-open zone and is the primary downside target for the bear scenario — in the flat-open context, OI-S 57,000 is the level where intraday short positions should be fully covered and reversed to long, because PE writers at 57,000 will provide maximum buying support through stop-loss triggered hedging and fresh PE buying from retail longs. The proximity of OI-S 57,000 to the monthly max-pain anchor of 57,600 (with OI-S significantly below max pain) suggests that option sellers are collectively positioned for a recovery during this week, and any test of OI-S 57,000 in the flat-open scenario represents a maximum-dislocation event that historically reverses sharply before the next daily session. |
⚡ Key Trigger: **First 30-minute candle close above BC 57,308.65** = bull trigger initiating the CPR-reclaim thesis toward P 57,354.90, H3 57,363.35, and TC 57,401.15; **first 30-minute candle close below PDL 57,217.60 or L3 57,161.45** = bear trigger confirming the descending CPR's overhead pressure is dominant and activating the downside path toward S1 57,125.10, L4 57,060.50, and OI-S 57,000. The structural importance of BC 57,308.65 as the bull trigger (and not TC) is that it is the minimum threshold for engaging with the CPR band — a close above BC tells traders that buyers are willing to enter the supply zone and fight for control, while failure confirms that sellers are absorbing every attempt and the natural gravity pulls price toward OI-S 57,000.
SENSEX
Descending — Medium (Width 0.15%)
▼ Bearish
Market Structure Balanced or transitional | Straddle Weekly ATM 77200 straddle (Call 360.00 + Put 196.10) = **556.10 pts** — this implies a one-standard-deviation expected move of approximately ±556 pts from 77,200, placing the weekly range between 76,644 and 77,756. The monthly ATM 77200 straddle (Call 665.00 + Put 385.80) = **1050.80 pts**, implying a monthly expected range of ±1,051 pts, which brackets OI-S 76,000 (within the downside range) and OI-R 78,000 (within the upside range) — confirming that both OI walls are within the statistically expected range for the session and that both levels will be actively contested by option writers this week. | Max Pain Weekly Max Pain = **77,500** and Monthly Max Pain = **77,800** — both max pain levels lie significantly above yesterday's close of 77,235.46 and above the full CPR band (BC 77,291.89 to TC 77,404.79), creating a strong gravitational pull from option sellers toward the 77,500–77,800 zone that supports a bullish intraday bias for any recovery scenario, while simultaneously highlighting that the current price below CPR is a temporary dislocation from the max-pain equilibrium. |
Tomorrow's Complete Level Map
OI-R: 78,000 R3: 77,803.17 H6: 77,576.31 H5: 77,532.42 R2: 77,689.19 H4 ▶: 77,422.93 R1: 77,462.32 PDH: 77,575.21 H3 ↩: 77,329.19
TC: 77,404.79 P: 77,348.34 BC: 77,291.89
L3 ↩: 77,141.73 PDL: 77,234.36 S1: 77,121.47 L4 ▶: 77,047.99 S2: 77,007.49 L5: 76,938.50 L6: 76,894.61 S3: 76,780.62 OI-S: 76,000
↩ = Camarilla reversal point | ▶ = Camarilla breakout/breakdown trigger | OI-R/OI-S = Options wall (CE/PE max OI)
▲ Higher Open (Gap Up) — Open > Prev Close
▲ Bullish
Open lands: For a Descending CPR on Sensex, a gap-up places the open above yesterday's close of 77,235.46. Since the entire CPR band (BC 77,291.89 to TC 77,404.79) sits above yesterday's close, a minor gap-up opens inside the CPR band (between BC 77,291.89 and TC 77,404.79), a significant gap-up opens above TC 77,404.79 and into H4 77,422.93 territory, and a large gap-up opens above PDH 77,575.21 and into H5 77,532.42 or H6 77,576.31.
CPR role: Launch pad / Active battleground — in the gap-up scenario, the CPR band (BC 77,291.89 to TC 77,404.79) transitions from an overhead supply wall to an active battleground where bulls attempt to establish the band as support and bears attempt to reject price back below BC 77,291.89; the dual max-pain pull (weekly 77,500, monthly 77,800) favours bulls sustaining the gap.
Minor Gap (0.05–0.25%) — Structure Dominant
A minor gap-up of 0.05–0.25% places the Sensex open between approximately 77,274 and 77,428, which positions the open inside the CPR band (BC 77,291.89 to TC 77,404.79) or marginally above TC 77,404.79, creating a CPR-compression scenario where Camarilla H3 77,329.19 sits within the band and immediately provides a first stall reference. The Descending-Medium CPR structure means the CPR band is the key battleground: a 30-minute close above TC 77,404.79 confirms CPR reclaim and targets H4 77,422.93 (Camarilla breakout trigger), R1 77,462.32 (Traditional first target), and weekly max pain at 77,500 — which collectively form a powerful confluence resistance cluster in the 77,420–77,500 range. Failure to produce a 30-minute close above TC 77,404.79 signals CPR rejection and initiates the bear path toward BC 77,291.89 (CPR base — 30-minute close required for confirmation), then L3 77,141.73 and S1 77,121.47 as the downside targets, with OI-S 76,000 as the distant weekly bear floor.
Significant Gap (0.25–0.5%) — Balanced
A significant gap-up of 0.25–0.50% places the Sensex open between approximately 77,428 and 77,622, which is above TC 77,404.79 and directly in the H4 77,422.93 to H6 77,576.31 Camarilla zone — an area where Camarilla breakout traders are most active and where the PDH at 77,575.21 provides a natural reference for session high targets. The gap-fill risk is relatively low in this range because the weekly max pain at 77,500 provides structural support for the gap, and the monthly straddle of 1,050.80 pts implies this level is well within the expected range — however, CE writers at 78,000 are still approximately 378–572 points away and are not yet actively delta-hedging, so there is no immediate institutional selling pressure to cap the move. The 30-minute confirmation rule for the significant gap: close above H4 77,422.93 targets R1 77,462.32 and weekly max pain 77,500 as intraday targets, while close below TC 77,404.79 on the first 30-minute candle is a gap-fade bear signal targeting P 77,348.34 and BC 77,291.89.
Large Gap (>0.5%) — Gap Direction Dominant
A large gap-up of more than 0.50% places the Sensex open above approximately 77,622, which clears H5 77,532.42, H6 77,576.31, PDH 77,575.21, and approaches the OI-R at 78,000 — a powerful but potentially exhaustion-level opening for an index that has been declining for two consecutive sessions. In this scenario, the gap-dominant rule applies and CPR structure becomes secondary; however, the extreme gap above PDH 77,575.21 creates an immediate gap-fill risk back to PDH level, and the two-30-minute-close rule for Medium CPR width means that two consecutive 30-minute candles above PDH 77,575.21 are required before targeting R2 77,689.19 and R3 77,803.17 (which aligns with monthly max pain 77,800). The abort level for large-gap bulls is a 30-minute close below H5 77,532.42, which would signal a gap failure and pivot toward H4 77,422.93 as a gap-fill target, with OI-S 76,000 serving as the ultimate bear floor that would only be relevant if the large gap is completely reversed through a catastrophic session.
|
▲ Upside Path → OI-R From a confirmed 30-minute close above TC 77,404.79, the upside path progresses to H4 77,422.93 (Camarilla breakout trigger — first partial profit per Medium CPR rules), R1 77,462.32 (Traditional first target — second partial profit), weekly max pain 77,500 (gravitational pull zone — third partial, as option sellers defend this level), H5 77,532.42 (Camarilla extension — fourth partial for aggressive bulls), H6 77,576.31 matching PDH 77,575.21 (final intraday exit), and R2 77,689.19 only if two consecutive 30-minute candles close above H6, with OI-R 78,000 as the session ceiling where CE writing pressure will definitively cap intraday extension. Each level between TC 77,404.79 and R1 77,462.32 must show at least two 30-minute candle closes above (per Medium CPR width rule) to confirm genuine institutional buying versus a mechanical gap-fill bounce. |
▼ Downside Path → OI-S The gap-up failure path runs from TC 77,404.79 → P 77,348.34 → BC 77,291.89 (CPR base — 30-minute close below activates full bear mode) → PDL 77,234.36 (previous session low — psychological support) → L3 77,141.73 (Camarilla mean-reversion — first stall and partial short profit) → S1 77,121.47 (Traditional first support — second partial) → L4 77,047.99 (Camarilla breakdown trigger — third partial) → L5 76,938.50 and L6 76,894.61 (Camarilla downside extension — full exit for Medium CPR, do NOT trail beyond) → S2 77,007.49 → OI-S 76,000 as the distant weekly PE wall that would be tested only in an extreme bear session. The gap-up failure is particularly dangerous because retail longs who entered on the gap are all stopped out below TC 77,404.79 or BC 77,291.89, and their systematic stop-loss selling accelerates the decline toward L3 77,141.73 without a meaningful pause. |
| 🔴 OI-R: The OI-Resistance at 78,000 (weekly and monthly CE max OI) is the ultimate overhead ceiling for Sensex on 19 Aug — CE writers who have written calls at 78,000 will face mounting delta-hedging requirements as Sensex approaches this level, forcing them to sell Sensex futures in increasing quantities to remain delta-neutral, which creates a self-reinforcing resistance wall that effectively caps intraday momentum. In the gap-up scenario, OI-R 78,000 is approximately 425–765 points above the gap zone depending on gap size, making it a session boundary reference rather than an immediate intraday target — however, awareness of this wall means traders should not chase longs above R2 77,689.19 without exceptional volume and momentum confirmation. | 🟢 OI-S: The OI-Support at 76,000 (weekly PE max OI) is approximately 1,235 points below yesterday's close, making it a distant floor that is outside the weekly straddle's expected range (±556 pts from 77,200) — this means that in a gap-up scenario, OI-S 76,000 is completely irrelevant as an intraday target and only serves as the theoretical maximum bearish scenario for the weekly option structure. PE writers at 76,000 are deeply profitable in any gap-up scenario and add no systematic hedging pressure to the market on 19 Aug, confirming that the OI-S 76,000 is a structural anchor for the weekly expiry rather than an active intraday reference level. |
⚡ Key Trigger: The primary trigger in Sensex's gap-up scenario is a **first 30-minute candle close above TC 77,404.79** (for minor gap) or above **H4 77,422.93** (for significant/large gap) — these are the levels where the Descending CPR is definitively reclaimed and the session-day structure flips from bearish to bullish control, targeting R1 77,462.32 and weekly max pain 77,500 as the primary intraday objectives. If the gap-up open fails with a 30-minute close below TC 77,404.79 (minor gap) or below H5 77,532.42 (large gap), the CPR becomes a trap-door overhead resistance and the bear path activates toward BC 77,291.89 and L3 77,141.73.
▼ Lower Open (Gap Down) — Open < Prev Close
▼ Bearish
Open lands: For a Descending CPR on Sensex, a gap-down below yesterday's close of 77,235.46 places the open further below the entire CPR band (BC 77,291.89 to TC 77,404.79). A minor gap-down opens between approximately 77,158 and 77,196, which is near PDL 77,234.36 and L3 77,141.73; a significant gap-down opens between 76,812 and 77,158, approaching L4 77,047.99 and S1 77,121.47; a large gap-down opens below approximately 76,812, threatening S3 76,780.62 and potentially L5 76,938.50.
CPR role: Overhead resistance / Bearish supply wall — the CPR band (BC 77,291.89 to TC 77,404.79) is 56–170 points above any gap-down open and acts as a significant overhead supply wall that bears will use as a reload zone, while recovery traders must fight through the entire band — including H3 77,329.19 embedded within it — before establishing bullish control.
Minor Gap (0.05–0.25%) — Structure Dominant
A minor gap-down of 0.05–0.25% places the Sensex open between approximately 77,042 and 77,196, which is below PDL 77,234.36 and in the vicinity of L3 77,141.73 and S1 77,121.47 — both Camarilla and Traditional support levels where mean-reversion buying is expected in the first 15–30 minutes. The CPR band (BC 77,291.89 to TC 77,404.79) sits approximately 95–253 points above the minor-gap open, and the 30-minute reclaim rule for BC 77,291.89 is the key test for recovery bulls: a close above BC within 30 minutes signals aggressive recovery toward P 77,348.34 and TC 77,404.79, while failure to reclaim BC confirms the descending CPR's overhead dominance and targets L3 77,141.73, S1 77,121.47, and L4 77,047.99. The weekly max pain at 77,500 and monthly max pain at 77,800 create a meaningful gravitational pull for recovery in the minor-gap scenario, as option sellers at both these strikes are incentivised to stabilise price and push it higher toward max pain levels.
Significant Gap (0.25–0.5%) — Balanced
A significant gap-down of 0.25–0.50% places the Sensex open between approximately 76,851 and 77,042, which is below L4 77,047.99 and approaching L5 76,938.50 and L6 76,894.61 — a zone where Camarilla extension targets are being tested and institutional selling is clearly dominant. The OI-Support at 76,000 is now approximately 851–1,042 points below the open, confirming it is not an immediate target in this gap range, but the weekly straddle of 556 pts from 77,200 implies the significant gap-down is pushing to the boundary of the expected range and straddle sellers will begin covering profitable puts near L5 76,938.50 and L6 76,894.61. The 30-minute recovery rule: reclaim of L4 77,047.99 targets BC 77,291.89 as the recovery target; failure to hold L5 76,938.50 on two consecutive 30-minute candles signals bear momentum toward S3 76,780.62 and L6 76,894.61 as the next stations.
Large Gap (>0.5%) — Gap Direction Dominant
A large gap-down of more than 0.50% places the Sensex open below approximately 76,851, which approaches S3 76,780.62 and potentially tests L6 76,894.61 — this is a panic-level opening that exceeds the weekly straddle's implied move of ±556 pts and would be a historically significant session for Sensex. At these extreme levels, the monthly straddle of 1,050.80 pts is the relevant gauge: the large gap-down is within the monthly expected range but represents a significant intraday dislocation, and aggressive counter-trend buyers (typically FII desks and arbitrage funds) will initiate buying at and below S3 76,780.62 and L5 76,938.50. The recovery abort level is a 30-minute close below L6 76,894.61, which confirms bear continuation toward S3 76,780.62 and eventually OI-S 76,000 as the maximum downside scenario; any recovery must first reclaim L5 76,938.50 and then S2 77,007.49 before BC 77,291.89 and the CPR band become meaningful targets.
|
▲ Upside Path → OI-R The recovery path in Sensex's gap-down scenario runs from the open → L3 77,141.73 (Camarilla mean-reversion — first bounce zone, partial profit on short cover) → S1 77,121.47 (Traditional first support — second short cover) → PDL 77,234.36 (previous session low — psychological resistance for recovery) → BC 77,291.89 (CPR base — critical 30-minute close required, this is the first genuine bull signal) → H3 77,329.19 (Camarilla mean-reversion within CPR band — stall expected) → P 77,348.34 (pivot — second partial long profit) → TC 77,404.79 (full CPR reclaim — third partial) → R1 77,462.32 and weekly max pain 77,500 as the session targets for recovery bulls. The gravitational pull of weekly max pain 77,500 and monthly max pain 77,800 means that any recovery that successfully reclaims BC 77,291.89 has strong structural support from option sellers defending these higher strikes. |
▼ Downside Path → OI-S The bear continuation path from the gap-down open runs through L3 77,141.73 (mean-reversion zone — first partial short profit, watch for reversal candle) → S1 77,121.47 (Traditional first support — second partial) → L4 77,047.99 (Camarilla breakdown trigger — third partial, retail stops activated) → S2 77,007.49 (Traditional second support — fourth partial) → L5 76,938.50 (Camarilla extension — full short exit per Medium CPR rules, do NOT trail below) → L6 76,894.61 (maximum Camarilla downside — exit all positions) → S3 76,780.62 and ultimately OI-S 76,000 (PE max OI weekly wall — the ultimate intraday bear floor where PUT monetisation is maximum and counter-trend buying emerges). The acceleration of selling below L4 77,047.99 is driven by weekly option sellers (PE writers) beginning to unwind their positions and retail longs hitting stop-losses, creating a cascade that typically overshoots the Camarilla extension levels before finding equilibrium. |
| 🔴 OI-R: The OI-Resistance at 78,000 (weekly and monthly CE max OI) is a highly irrelevant level in the gap-down scenario for Sensex — it sits approximately 765–1,142 points above any gap-down open, and CE writers at 78,000 are deeply profitable, requiring no hedging activity that could impact intraday price action. The OI-R at 78,000 is mentioned only to inform recovery traders of the absolute upside ceiling: even in the most optimistic recovery scenario from a gap-down, the session is unlikely to reach 78,000, making any position above R3 77,803.17 in a gap-down recovery session extremely low-probability. | 🟢 OI-S: The OI-Support at 76,000 (weekly PE max OI) is the primary downside target and ultimate bear floor for Sensex in the gap-down scenario — PE writers who sold puts at 76,000 will face their maximum stress if Sensex approaches this level, and their defensive buying (covering PE short positions) plus fresh retail PE buying creates a powerful support dynamic at 76,000 that makes it the highest-probability reversal zone of the entire downside range. The importance of OI-S 76,000 in the gap-down scenario is amplified by the weekly straddle (556.10 pts from 77,200) which places 76,000 OUTSIDE the expected weekly range, confirming that a test of 76,000 would be a statistical extreme and historically the type of overshoot that reverses sharply within the same session, making it the ideal full-exit zone for shorts and an aggressive long entry for mean-reversion traders. |
⚡ Key Trigger: The critical trigger in Sensex's gap-down scenario is **failure or success to reclaim BC 77,291.89 within the first 30 minutes** for minor gaps, or **reclaiming L4 77,047.99 and then PDL 77,234.36** for significant/large gaps — these are the specific structural levels where the session narrative shifts from bear continuation to recovery attempt, and traders who miss the trigger should wait for the next 30-minute confirmation rather than chasing in a gap-down environment. Bear confirmation signals are a 30-minute close below L3 77,141.73 (for minor gap) or below L5 76,938.50 (for significant/large gap), which activates full short positions with stops above BC 77,291.89 and targets at L4 77,047.99, S2 77,007.49, and OI-S 76,000.
◆ Near Flat Open — Open ≈ Prev Close (±0.05%)
◆ Neutral
Open lands: A flat open of ±0.05% on yesterday's close of 77,235.46 places the open between approximately 77,196 and 77,274. Since BC is 77,291.89 and TC is 77,404.79, a flat open on this Descending CPR places the market approximately 18–96 points BELOW BC 77,291.89 — the open is entirely below the descending CPR band, and the CPR band (BC 77,291.89 to TC 77,404.79) represents a clear overhead supply block sitting above the flat-open zone.
CPR role: Overhead resistance / Dual max-pain pull zone — the flat open below the CPR band on Descending-Medium Sensex creates a 'below-CPR-bear-bias-but-max-pain-above' dynamic; bears control until BC 77,291.89 is reclaimed, but the weekly (77,500) and monthly (77,800) max pain levels provide a structural gravitational pull upward that gives recovery attempts a fundamental backdrop.
Near Flat (±0.05%)
A flat open on Sensex's Descending-Medium CPR is the most analytically rich scenario for 19 Aug because the open below the entire CPR band (BC 77,291.89 to TC 77,404.79) eliminates gap noise and forces a pure structural read: either the market recovers above BC 77,291.89 (attracted by weekly max pain 77,500 and monthly max pain 77,800 above) or it fails and continues the bearish drift that characterised 18 Aug's session. The key reference levels are BC 77,291.89 (approximately 18–96 points above the flat open — accessible within the first few minutes of trading) and TC 77,404.79 (approximately 130–209 points above — requires a full CPR-reclaim session to reach), while Camarilla H3 77,329.19 sits embedded within the band and will cause a mean-reversion stall even if BC is initially cleared. The CPR Width of 0.15% (Medium, spanning approximately 113 points from BC 77,291.89 to TC 77,404.79) means the first 30-minute candle's relationship to BC 77,291.89 is the single most important data point of the day: a close above BC confirms recovery momentum and initiates the path toward P 77,348.34, H3 77,329.19, TC 77,404.79, H4 77,422.93, R1 77,462.32, and weekly max pain 77,500. A first 30-minute close below PDL 77,234.36 (the flat-open floor for the lower end of the ±0.05% range) confirms the bear thesis, with L3 77,141.73 as the immediate target, followed by S1 77,121.47 and L4 77,047.99 — the dual max-pain pull (77,500 and 77,800 above) makes this the highest-probability recovery scenario among all three indices in the flat-open situation, as Sensex has the strongest option-seller incentive to push price upward during this week.
|
▲ Upside Path → OI-R From a 30-minute close above BC 77,291.89, the upside path runs through H3 77,329.19 (Camarilla mean-reversion within the CPR band — first stall, watch for rejection candle before adding long positions), P 77,348.34 (pivot reclaim — first partial profit), TC 77,404.79 (full CPR top — second partial profit and the critical confirmation that the Descending CPR has been fully negated for the session), H4 77,422.93 (Camarilla breakout trigger — third partial, confirms institutional buy flow), R1 77,462.32 (Traditional first target — fourth partial, this is the maximum exit level for conservative Medium CPR traders), with H5 77,532.42 and weekly max pain 77,500 as aggressive bull targets for those willing to hold through the full session with stops trailed to TC 77,404.79. The dual max-pain gravitational pull toward 77,500 (weekly) and 77,800 (monthly) means that Sensex has the strongest structural incentive of the three indices to trade higher in the flat-open recovery scenario. |
▼ Downside Path → OI-S From a failure to reclaim BC 77,291.89 or a close below PDL 77,234.36, the downside path runs through L3 77,141.73 (Camarilla mean-reversion — first short partial, expect bounce here as counter-trend buyers appear), S1 77,121.47 (Traditional first support — second short partial), L4 77,047.99 (Camarilla breakdown trigger — loss signals institutional distribution and activates retail stop-losses), S2 77,007.49 (Traditional second support — third short partial), L5 76,938.50 (Camarilla extension — fourth partial, this is the maximum trail point per Medium CPR rules), L6 76,894.61 (full downside Camarilla extension — exit all short positions), and ultimately OI-S 76,000 as the PE max OI weekly wall where the bear thesis is fully monetised and the position must be reversed. The bear momentum below PDL 77,234.36 is reinforced by the fact that Sensex closed at the session low on 18 Aug (77,235.46 ≈ PDL 77,234.36), signalling that sellers had complete control into the close and will likely continue testing lower levels until a meaningful support is found. |
| 🔴 OI-R: The OI-Resistance at 78,000 (weekly and monthly CE max OI) is approximately 726–804 points above the flat-open zone and serves as the session's theoretical ceiling rather than an active intraday resistance — CE writers at 78,000 are deeply out-of-the-money and have no delta-hedging requirement at current prices, meaning they contribute no selling pressure to the market on 19 Aug unless a massive gap-up is triggered. In the flat-open scenario, the relevance of OI-R 78,000 is primarily educational: it defines the outer boundary of the monthly CPR band and confirms that any intraday move toward 78,000 would require an extraordinary macro catalyst and would be fully met with CE writer delta-selling that creates a 'glass ceiling' effect — for flat-open traders, positions above R2 77,689.19 should be treated with extreme caution as the OI-R ceiling approaches. | 🟢 OI-S: The OI-Support at 76,000 (weekly PE max OI) is approximately 1,196–1,274 points below the flat-open zone and represents the weekly option structure's maximum downside floor — PE writers at 76,000 are deeply profitable in the flat-open scenario and are not under any stress, meaning they are not adding incremental buying support near the flat-open zone but they have established a structural floor that prevents catastrophic downside below 76,000 for the weekly expiry. In the flat-open context, OI-S 76,000 is the abort level for all intraday bear positions — any short entered near the flat open should be covered no later than OI-S 76,000, as PE writers at this level will engage in aggressive defensive buying (covering written puts) that creates a powerful intraday reversal, making positions held short below 76,000 extremely high-risk for a snap-back squeeze. |
⚡ Key Trigger: **First 30-minute candle close above BC 77,291.89** = bull trigger confirming the CPR-reclaim attempt is live and targeting P 77,348.34, H3 77,329.19, and TC 77,404.79 in succession, with weekly max pain 77,500 as the session target; **first 30-minute candle close below PDL 77,234.36** = bear trigger confirming the descending CPR's overhead pressure is unbroken and activating the downside path toward L3 77,141.73, S1 77,121.47, and L4 77,047.99 as the intraday bear sequence. The structural significance of BC 77,291.89 as the fulcrum is amplified by the fact that it is the first level where the CPR supply zone begins — traders watching level-by-level can see in real time whether buyers are absorbing the supply at BC or being repelled, and the volume on the first 30-minute candle that tests BC 77,291.89 will determine whether the session is a 'max-pain pull' recovery day or a 'descending CPR extension' bear day.
📊 VIX Insight: India VIX data is unavailable for 18 Aug 2026 (shown as — with — % change), which limits the volatility-regime assessment for 19 Aug 2026. In the absence of VIX data, traders must rely on the monthly straddle premiums as the primary implied volatility gauge: Nifty monthly straddle at 269.25 pts (approximately 1.11% of spot), BankNifty monthly straddle at 777.05 pts (approximately 1.36% of spot), and Sensex monthly straddle at 1,050.80 pts (approximately 1.36% of spot) — all of which suggest moderate implied volatility consistent with a 'balanced-to-transitional' market structure, meaning 19 Aug is not expected to be a high-VIX panic session, and CPR structure confirmation rules (Medium — first 30-minute candle) are the appropriate tool rather than VIX-adjusted wide-stop strategies.
Overall View:
All three indices — Nifty, BankNifty, and Sensex — closed at or near their respective session lows on 18 Aug 2026 and carry identically structured Descending-Medium day-CPRs for 19 Aug 2026, creating a uniformly bearish opening framework where the TC levels (Nifty TC 24,212.28, BankNifty TC 57,401.15, Sensex TC 77,404.79) represent the first and most important overhead resistance zones that bulls must reclaim in the first 30 minutes to change the session's directional narrative. The OI structure provides critical nuance: Nifty's OI-R at 24,200 aligns with weekly max pain (24,200) and sits within the CPR band itself (creating a uniquely dense resistance cluster), BankNifty's monthly max pain at 57,600 provides a gravitational recovery pull above the current price, and Sensex's dual max-pain setup (weekly 77,500, monthly 77,800) creates the strongest structural upside pull of the three indices, suggesting that if a recovery materialises, Sensex may lead the reversal relative to Nifty and BankNifty. For 19 Aug, the primary trading thesis across all three indices is: **sell any failure below BC** (Nifty 24,174.02, BankNifty 57,308.65, Sensex 77,291.89) on 30-minute confirmation targeting the respective OI-S floors, and **buy any 30-minute close above TC** (Nifty 24,212.28, BankNifty 57,401.15, Sensex 77,404.79) targeting the first Traditional resistance and max-pain zones.
All three indices — Nifty, BankNifty, and Sensex — closed at or near their respective session lows on 18 Aug 2026 and carry identically structured Descending-Medium day-CPRs for 19 Aug 2026, creating a uniformly bearish opening framework where the TC levels (Nifty TC 24,212.28, BankNifty TC 57,401.15, Sensex TC 77,404.79) represent the first and most important overhead resistance zones that bulls must reclaim in the first 30 minutes to change the session's directional narrative. The OI structure provides critical nuance: Nifty's OI-R at 24,200 aligns with weekly max pain (24,200) and sits within the CPR band itself (creating a uniquely dense resistance cluster), BankNifty's monthly max pain at 57,600 provides a gravitational recovery pull above the current price, and Sensex's dual max-pain setup (weekly 77,500, monthly 77,800) creates the strongest structural upside pull of the three indices, suggesting that if a recovery materialises, Sensex may lead the reversal relative to Nifty and BankNifty. For 19 Aug, the primary trading thesis across all three indices is: **sell any failure below BC** (Nifty 24,174.02, BankNifty 57,308.65, Sensex 77,291.89) on 30-minute confirmation targeting the respective OI-S floors, and **buy any 30-minute close above TC** (Nifty 24,212.28, BankNifty 57,401.15, Sensex 77,404.79) targeting the first Traditional resistance and max-pain zones.
Disclaimer: KRV Prime provides educational and informational content relating to financial markets. Articles, research, examples, charts, strategies and tools are provided for educational purposes and should not be interpreted as personalised investment advice or a guarantee of financial performance. Markets involve risk, including possible loss of capital. Past performance does not guarantee future results. KRV Prime is not a SEBI Registered Investment Adviser or Research Analyst.