
Index Analysis
Intraday Analysis for 28 Sep 2026
KRV Prime27 September 202648 min
Educational/Derived AnalysisSource: KRV Prime Market Insights (End-of-Day)As of 27 Sep 2026, 05:04 AM IST
Intraday Analysis for 28 Sep 2026
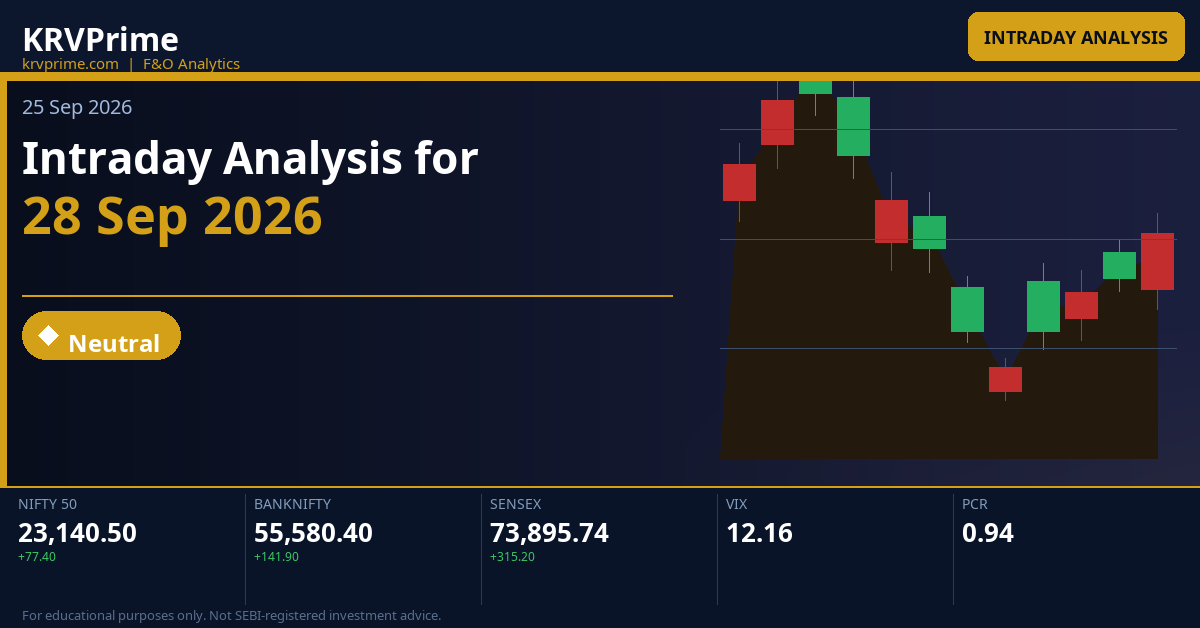
Markets closed Friday 25 Sep 2026 on a constructive note with NIFTY adding 0.34% to 23,140.50, BANKNIFTY up 0.26% to 55,580.40, and SENSEX gaining 0.43% to 73,895.74, setting up a technically interesting Monday open for 28 Sep 2026. India VIX data is unavailable for this session, which limits precise options-premium decay forecasting, but the straddle pricing — NIFTY weekly at 196 points and SENSEX weekly at 885 points — implies moderate expected moves that are consistent with a transitional, non-trending tape. Traders should note that all three indices are trading well below their respective weekly and monthly CPR bands, a structural headwind that places the burden of proof firmly on the bulls to reclaim higher pivots before any sustained directional move can be confirmed.
Key Market Signals — Intraday Setup
All three indices — NIFTY, BANKNIFTY, and SENSEX — are positioned below their weekly CPR pivot bands (NIFTY weekly P=23,351.78; BANKNIFTY weekly P=56,383.27; SENSEX weekly P=74,570.91), which collectively signals persistent intermediate-term weakness and places intraday bulls in a counter-trend recovery role rather than a trend-following one. The SENSEX monthly OI resistance at 74,000 and NIFTY OI ceiling at 24,000 create well-defined option-writer supply zones that will cap any gap-up extension attempts on Monday.
Deep Technical Analysis & Levels
NIFTY
Overlapping — Medium
◆ Neutral
Market Structure Balanced or transitional | Straddle ATM 23150 straddle = Call 119.25 + Put 76.75 = **196 points** total expected move, implying a range of approximately **22,944 to 23,346** for the weekly expiry on 29 Sep 2026. This is a relatively contained premium given the proximity of weekly expiry, suggesting option writers expect the index to remain inside this band through expiry. | Max Pain Max Pain for both Week (29-Sep-2026) and Month (29-Sep-2026) = **23,250**, which is approximately **109.5 points above** Friday's close of 23,140.50. This implies a gravitational pull toward 23,250 through expiry, meaning option sellers benefit most if NIFTY drifts up modestly — a mild bullish expiry bias is embedded in the positioning. |
Tomorrow's Complete Level Map
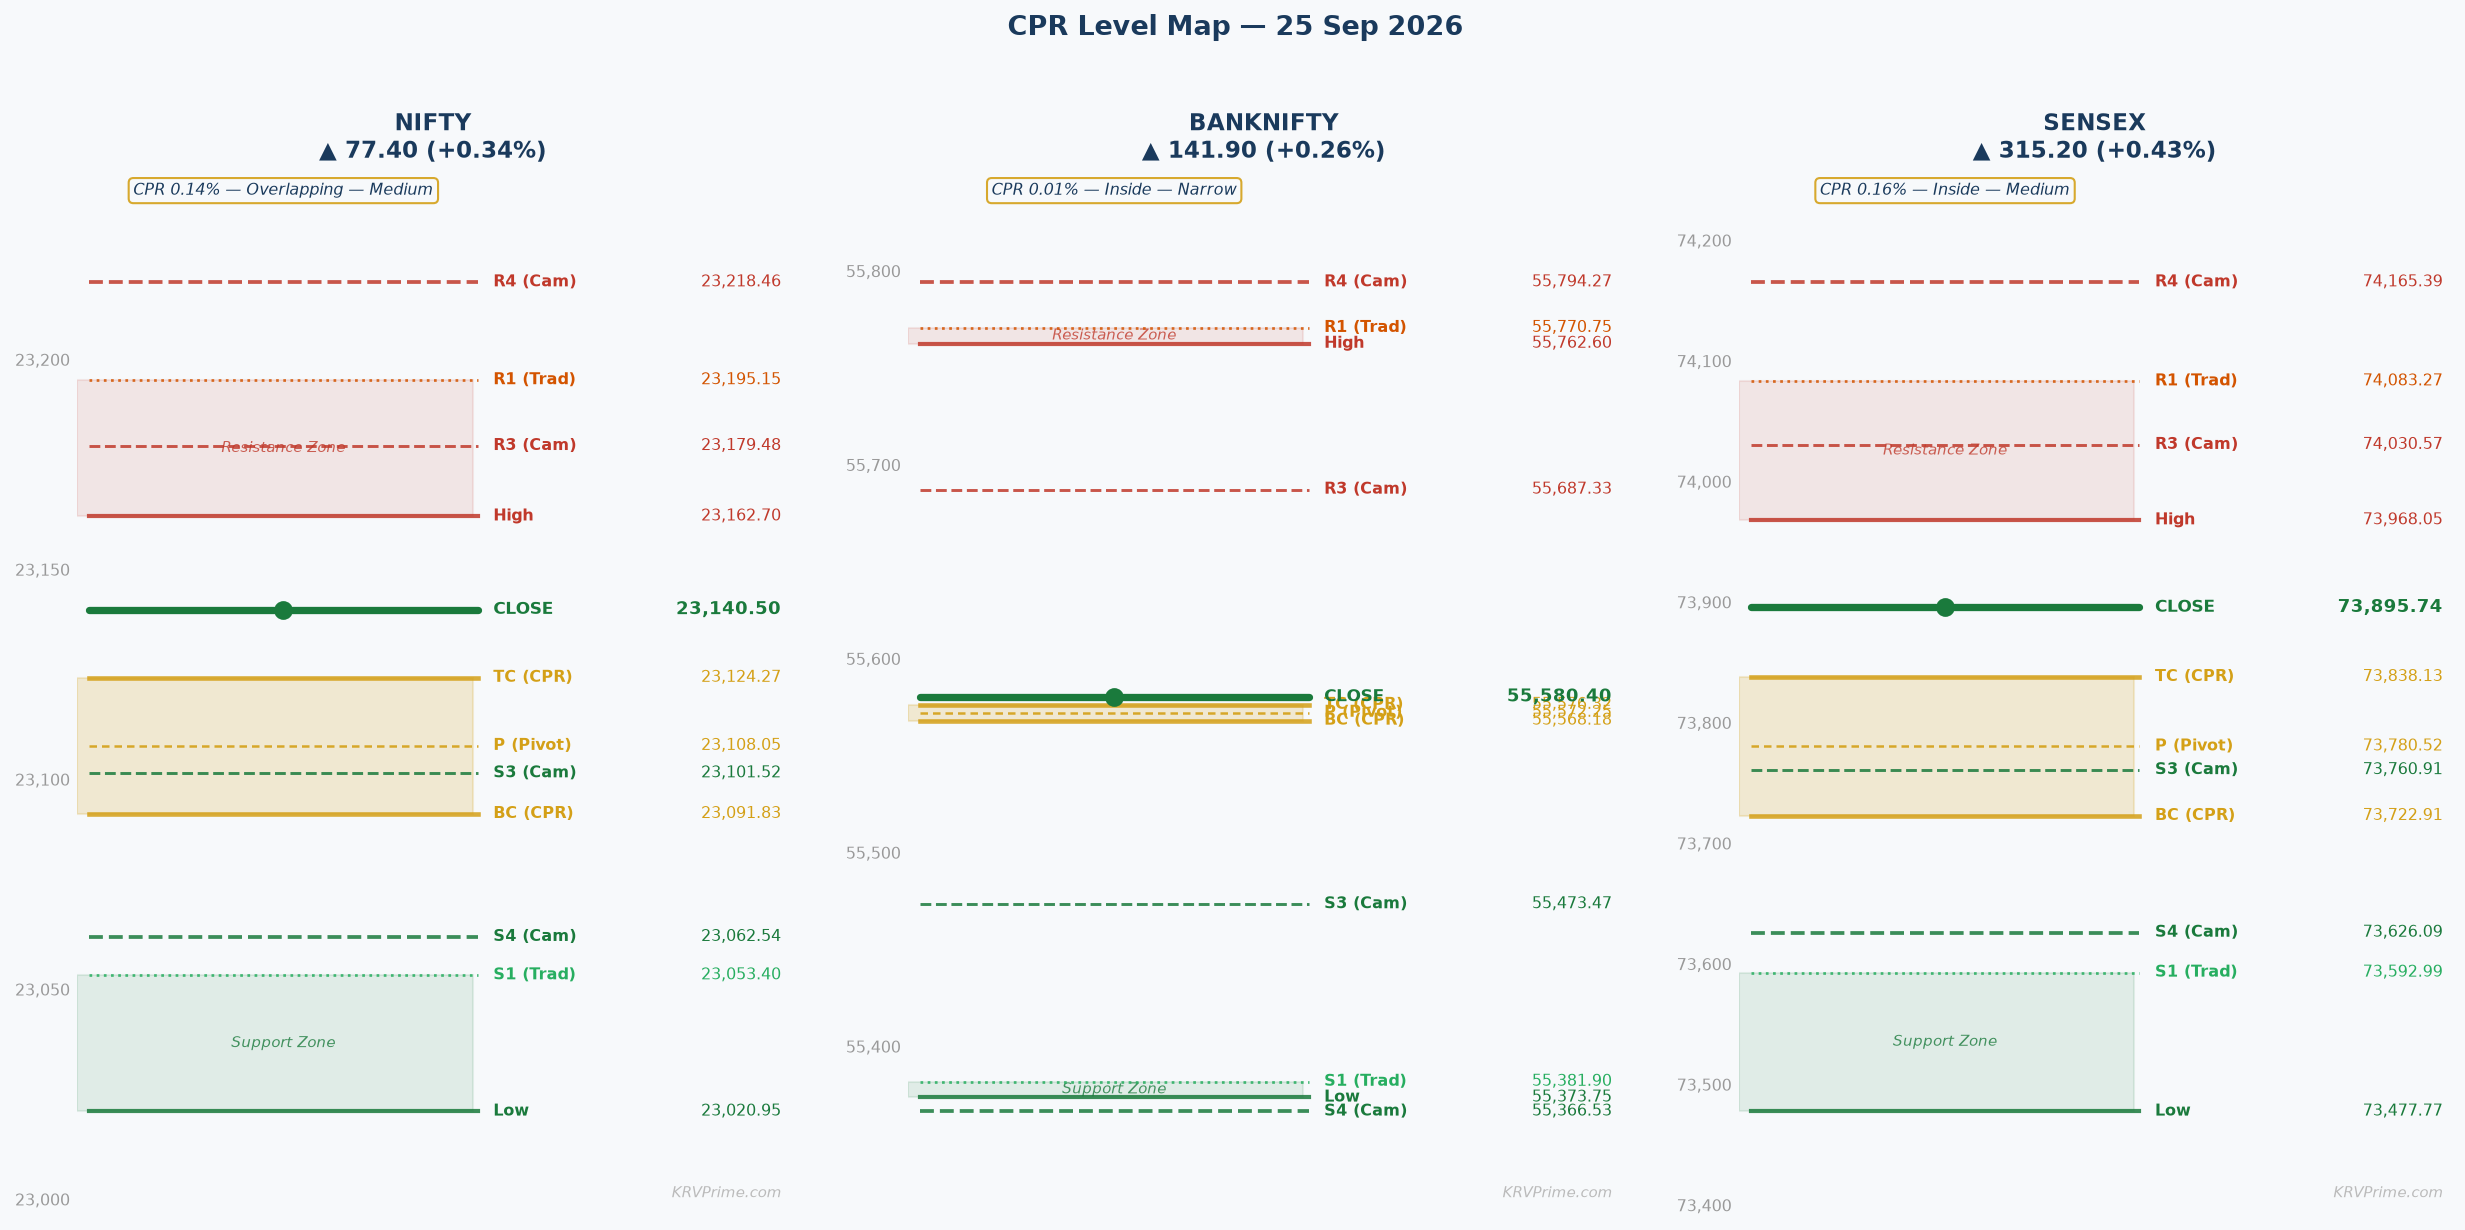
OI-R: 24,000 R3: 23,336.90 H6: 23,282.99 H5: 23,263.99 R2: 23,249.80 H4 ▶: 23,218.46 R1: 23,195.15 PDH: 23,162.70 H3 ↩: 23,179.48
TC: 23,124.27 P: 23,108.05 BC: 23,091.83
L3 ↩: 23,101.52 PDL: 23,020.95 S1: 23,053.40 L4 ▶: 23,062.54 S2: 22,966.30 L5: 23,017.01 L6: 22,998.01 S3: 22,911.65 OI-S: 23,000
↩ = Camarilla reversal point | ▶ = Camarilla breakout/breakdown trigger | OI-R/OI-S = Options wall (CE/PE max OI)
▲ Higher Open (Gap Up) — Open > Prev Close
▲ Bullish
Open lands: For an Overlapping Medium CPR with BC=23,091.83 and TC=23,124.27, the previous close of 23,140.50 already sits ABOVE TC. A gap-up open would place price even further above TC=23,124.27, extending the bullish position relative to the CPR band. The entire CPR band (BC=23,091.83 to TC=23,124.27) therefore transforms into a support structure below the opening price, meaning the CPR band acts as a bullish launchpad rather than an overhead obstacle.
CPR role: Support / Launch Pad — the full CPR band (BC=23,091.83 to TC=23,124.27) sits below the gap-up open and provides a dual-layer cushion for any opening dip; as long as price holds above TC=23,124.27 the intraday structure is unambiguously bullish.
Minor Gap (0.05–0.25%) — Structure Dominant
A minor gap of 0.05–0.25% places NIFTY opening in the approximate range of 23,152 to 23,198, which is above TC=23,124.27 but still below or near PDH=23,162.70 and the Camarilla H3=23,179.48. The Overlapping Medium CPR structure adds a confirming lean to this gap because the entire CPR band sits comfortably below the opening print, meaning the CPR is already functioning as a support cushion and there is no overhead CPR resistance to navigate. The first actionable target is PDH=23,162.70 followed by Camarilla H3=23,179.48; a 30-minute candle close above H3=23,179.48 on above-average volume is the Medium-width confirmation rule that unlocks R1=23,195.15 and H4=23,218.46 as next targets.
Significant Gap (0.25–0.5%) — Balanced
A significant gap of 0.25–0.5% places NIFTY opening between approximately 23,198 and 23,256, a zone that already trades above R1=23,195.15 and is entering the Camarilla H4=23,218.46 and R2=23,249.80 cluster — an area of immediate overhead supply. There is a meaningful gap-fill risk here because opening directly into the H4=23,218.46 resistance band without intraday momentum building can trigger profit-taking and a pullback toward TC=23,124.27, the first structural support. If the 30-minute candle closes above H4=23,218.46 with conviction, the next targets are R2=23,249.80 and H5=23,263.99, both of which also align with the Max Pain strike of 23,250, creating a powerful confluence zone where option sellers will likely defend aggressively.
Large Gap (>0.5%) — Gap Direction Dominant
A large gap exceeding 0.5% places NIFTY opening above approximately 23,256, which is beyond H5=23,263.99 and H6=23,282.99 and approaching R3=23,336.90 — territory where short-covering exhaustion dynamics dominate. At this extreme opening level, the probability of a gap-fill back toward TC=23,124.27 increases significantly because option writers at higher strikes will delta-hedge by selling futures aggressively, creating supply that caps further extension. Straddle premium of 196 points must be factored: if the opening itself consumes a large portion of the expected move, the risk-reward for fresh long positions is poor, and experienced traders will wait for a retest of H4=23,218.46 or H3=23,179.48 before adding; the abort level for all longs is a two 30-minute close below TC=23,124.27.
|
▲ Upside Path → OI-R Above PDH=23,162.70, the sequence is Camarilla H3=23,179.48 → R1=23,195.15 → H4=23,218.46 → R2=23,249.80 → Max Pain=23,250 → H5=23,263.99 → H6=23,282.99 → R3=23,336.90, with each Camarilla level requiring a 30-minute close confirmation before treating it as broken; H4=23,218.46 is the key breakout trigger above which momentum trading setups become valid. The OI resistance at 24,000 is a distant ceiling that will not be tested intraday but represents where CE writers are positioned in mass, making any extended up-move run into accelerating supply well before that level. |
▼ Downside Path → OI-S Failure to hold above TC=23,124.27 after the gap-up open shifts the scenario to a bull-trap pattern where price falls back through P=23,108.05 toward BC=23,091.83, and a 30-minute close below BC=23,091.83 then targets L3=23,101.52 and accelerates toward S1=23,053.40 and L4=23,062.54. Loss of TC=23,124.27 is the structural reset signal because it converts the CPR band from support to overhead resistance, meaning every recovery attempt will now face selling pressure from trapped gap-up longs. |
| 🔴 OI-R: OI resistance at 24,000 CE is a far-term ceiling for this expiry session — with NIFTY at 23,140.50, reaching 24,000 intraday is essentially impossible, meaning CE writers at this strike face no immediate delta-hedging pressure and are not a factor in Monday's intraday price action; however, they represent the macro ceiling that will suppress any sustained multi-day rally. The real intraday resistance from options is the Max Pain at 23,250 where a cluster of CE strikes has been written, and option sellers will defend this zone by selling futures against any attempted breakout, effectively capping the day near R2=23,249.80. | 🟢 OI-S: OI support at 23,000 PE represents a massive put-writing base where market makers and institutional sellers have collected premium betting that NIFTY will not break below 23,000; in a gap-up scenario this level is irrelevant for intraday action and acts as an underlying confidence floor that prevents panic selling. The put base at 23,000 also means PDL=23,020.95 and L5=23,017.01 are well supported by gamma dynamics — any dip toward this zone would trigger aggressive PE unwinding and delta-hedge futures buying, creating a natural bounce. |
⚡ Key Trigger: The primary trigger for gap-up bulls is a sustained first 30-minute candle close above PDH=23,162.70, which confirms that Friday's high is being taken out with fresh buying rather than a false open; this is the structural fulcrum because PDH acts as the most recent resistance and clearing it with volume flips the short-term trend from Friday's high-rejection to a continuation sequence. If the 30-minute candle fails to close above PDH=23,162.70 and instead dips below TC=23,124.27, the gap-up becomes a bull trap and the day flips to bearish bias with immediate downside risk toward P=23,108.05 and then BC=23,091.83.
▼ Lower Open (Gap Down) — Open < Prev Close
▼ Bearish
Open lands: For the Overlapping Medium CPR with BC=23,091.83 and TC=23,124.27, a gap-down open from Friday's close of 23,140.50 initially drops price inside or below the CPR band. A minor gap-down places price inside the CPR band (between BC and TC), while a significant gap-down places price below BC=23,091.83, and a large gap-down moves price well below the entire CPR structure — in each case the CPR band transitions from the prior session's support to Monday's overhead resistance zone.
CPR role: Overhead Resistance / Battleground — the CPR band (BC=23,091.83 to TC=23,124.27) becomes a resistance ceiling that gap-down bulls must reclaim; failure to recover above TC=23,124.27 within the first 30 minutes confirms bearish intraday control for the session.
Minor Gap (0.05–0.25%) — Structure Dominant
A minor gap of 0.05–0.25% places NIFTY opening between approximately 23,082 and 23,128, which is inside or just below the CPR band (BC=23,091.83 to TC=23,124.27), meaning price is testing the structural decision zone from below on the open. Minor gaps inside the CPR band have a high probability of filling within the first 30–60 minutes because the band acts as a gravitational attractor, and Monday opens after a weekend often see early directional resolution. The critical test is whether buyers can push price back above TC=23,124.27 within the first 30 minutes: success targets PDH=23,162.70 and H3=23,179.48, while failure to reclaim TC=23,124.27 and a 30-minute close below BC=23,091.83 targets L3=23,101.52, L4=23,062.54, and S1=23,053.40.
Significant Gap (0.25–0.5%) — Balanced
A significant gap of 0.25–0.5% places NIFTY opening between approximately 23,082 and 23,083 to 23,025, well below BC=23,091.83 and approaching S1=23,053.40 and L4=23,062.54 territory, which are the first meaningful Camarilla supports below the CPR band. The 30-minute reclaim rule is critical here: if price can push back above BC=23,091.83 and hold for a full 30-minute candle close, the gap-down becomes a failed breakdown and a recovery toward P=23,108.05 and TC=23,124.27 is likely; this pattern of failure-and-resume is common at month-end when institutional rebalancing creates artificial gaps. If the 30-minute candle cannot reclaim BC=23,091.83, the bear path accelerates toward L3=23,101.52 which is actually ABOVE the opening in this scenario, so the downside continuation targets become S1=23,053.40, L4=23,062.54, S2=22,966.30, and eventually the critical OI support floor at 23,000.
Large Gap (>0.5%) — Gap Direction Dominant
A large gap exceeding 0.5% places NIFTY opening below approximately 23,025, which breaches PDL=23,020.95 and L5=23,017.01 — two critical structural levels that, once broken on the open, signal potential panic and momentum selling toward L6=22,998.01 and OI support at 23,000. In this scenario, the VIX (unavailable today) would presumably be elevated and straddle premiums would expand significantly beyond the 196-point baseline, meaning pure long positions are extremely risky at the open as premium decay accelerates once the initial move exhausts. The recovery level to watch is BC=23,091.83 which becomes the key reclaim target — two consecutive 30-minute closes above BC=23,091.83 are required to call a recovery, while any failed recovery attempt that rolls back below L5=23,017.01 targets the OI support at 23,000 as the next put-monetisation level where PE buyers take profits and the index stabilises.
|
▲ Upside Path → OI-R The recovery path runs BC=23,091.83 → P=23,108.05 → TC=23,124.27 → PDH=23,162.70 → H3=23,179.48, with each level requiring a confirmed 30-minute close before treating it as sustained; TC=23,124.27 reclaim is the key bull validation because it puts price back inside the upper portion of the CPR band and restores the bullish structure from Friday's close. A complete recovery above TC=23,124.27 with volume confirmation then opens R1=23,195.15 and H4=23,218.46 as intraday targets, while the OI ceiling at 24,000 remains too distant to be a same-session concern. |
▼ Downside Path → OI-S The bear path below BC=23,091.83 runs through L3=23,101.52 (first Camarilla mean-reversion reference), then S1=23,053.40 and L4=23,062.54 (first major support cluster), followed by S2=22,966.30 and L5=23,017.01 (pre-OI-support buffer), and ultimately targets the OI-S at 23,000 where retail stop-losses accumulate below PDL=23,020.95 and systematic selling from delta-hedging accelerates the drop through that psychological level. The 23,000 PE wall should act as a bounce zone because massive put-writers will buy futures to hedge, but if this level breaks, L6=22,998.01 and S3=22,911.65 become the next structural references. |
| 🔴 OI-R: In a gap-down scenario, OI resistance at 24,000 is completely irrelevant for intraday action — it is so far above the opening price that CE writers at that strike face zero delta pressure and have no incentive to hedge; the effective intraday overhead resistance is instead the CPR band at BC=23,091.83 to TC=23,124.27 and the Max Pain level at 23,250 where any recovery attempt faces institutional supply. CE writers at the 23,200 and 23,300 strikes will delta-hedge by selling futures into any early-session recovery rally, creating a layered supply ceiling between R1=23,195.15 and R3=23,336.90. | 🟢 OI-S: OI support at 23,000 PE is the single most important level in a gap-down scenario — it represents where the largest concentration of put open interest sits, and reaching this level triggers two competing dynamics: PE holders take profits (reducing put OI), while delta-hedging by put writers requires futures buying, both of which create a mechanical bounce. If the index approaches 23,000, expect high-volume two-sided action with large buyers stepping in systematically, making it an ideal zone for scalp long positions with stops below L6=22,998.01. |
⚡ Key Trigger: The key trigger for gap-down sessions is the 30-minute reclaim rule applied to BC=23,091.83: a 30-minute candle close above BC=23,091.83 on improving volume is the bull reclaim trigger, while failure to achieve this within the first 30 minutes confirms bearish dominance and activates the downside path. The reason BC=23,091.83 is the structural fulcrum is that it represents the bottom of the CPR band — the last line of institutional demand reference — and holding below it means the entire CPR band has flipped from support to resistance, changing every subsequent rally into a distribution opportunity for informed sellers.
◆ Near Flat Open — Open ≈ Prev Close (±0.05%)
◆ Neutral
Open lands: A ±0.05% flat open from 23,140.50 places NIFTY opening between approximately 23,129 and 23,152, which is just above TC=23,124.27 but well above BC=23,091.83 — meaning a flat open confirms price remains above the entire CPR band, maintaining the Friday close's bullish position. The 32-point CPR width (Medium at 0.14%) creates a meaningful decision zone, but the open above TC=23,124.27 gives a slight upside lean.
CPR role: Decision Zone with Bullish Lean — the CPR band (BC=23,091.83 to TC=23,124.27) sits below the flat open, acting as a cushion support; the key question is whether the session builds on Friday's close or retreats into the band for a directional resolution.
Near Flat (±0.05%)
A flat open in a Medium-width CPR (0.14%) that opens above TC=23,124.27 is a high-information setup precisely because the first 30-minute candle will define the entire day's directional structure — this is not a session for anticipatory positioning but for confirmed breakout or breakdown trading. The TC=23,124.27 is the bull-bear dividing line: as long as price remains above TC on 30-minute closes, bulls maintain control and the session is a buying-on-dips structure with PDH=23,162.70 and H3=23,179.48 as initial upside targets; a 30-minute close below TC=23,124.27 shifts control to bears and makes the CPR band an overhead resistance structure. Because the CPR width is 0.14% (Medium), the probability of a genuine trend day (versus a choppy range-bound session) is moderate — Medium-width CPRs with a Monday effect after a Friday close at the top of the band often see early momentum in the direction of the prior day's strength, which in this case is mildly bullish. The dual triggers are: bull — first 30-minute close above PDH=23,162.70 with volume expansion targeting H3=23,179.48, R1=23,195.15, and H4=23,218.46; bear — first 30-minute close below BC=23,091.83 targeting L3=23,101.52 (note: L3=23,101.52 is actually INSIDE the CPR band, meaning the real first downside target below BC is S1=23,053.40 and L4=23,062.54), with full bear confirmation on a second 30-minute close below L4=23,062.54.
|
▲ Upside Path → OI-R From above TC=23,124.27, the bull path runs TC=23,124.27 → PDH=23,162.70 → H3=23,179.48 → R1=23,195.15 → H4=23,218.46 → R2=23,249.80 → Max Pain=23,250, with each Camarilla level requiring a 30-minute close confirmation; H4=23,218.46 is the key breakout trigger that, once cleared with two 30-minute candle closes, signals a potential test of H5=23,263.99 and H6=23,282.99. The OI ceiling at 24,000 is 859 points above the opening and remains an expiry-week gravitational reference rather than an intraday target. |
▼ Downside Path → OI-S From below BC=23,091.83, the bear path runs BC=23,091.83 → S1=23,053.40 → L4=23,062.54 → S2=22,966.30 → L5=23,017.01 → L6=22,998.01 → OI-S=23,000, with S1=23,053.40 and L4=23,062.54 forming the first major demand cluster where put writers will defend; a sustained break below PDL=23,020.95 opens the OI support at 23,000 as the final downside reference for the session. Retail stop-losses cluster below PDL=23,020.95 which accelerates the move once that level is breached cleanly on a 30-minute close. |
| 🔴 OI-R: OI resistance at 24,000 in a flat-open scenario functions as the expiry-week macro ceiling — CE writers at this strike have collected substantial premium and will not face delta-pressure until price approaches 23,500+, meaning the 24,000 wall is a distant structural reference that caps any multi-day rally rather than a same-session intraday obstacle. The practical intraday CE-writing pressure manifests at R2=23,249.80 and Max Pain=23,250, where shorter-dated CE positions create a ceiling that institutional option sellers will defend with futures selling on any rally toward that zone. | 🟢 OI-S: OI support at 23,000 PE in a flat-open scenario is the ultimate downside anchor — with a flat open at approximately 23,140, reaching 23,000 would require a 140-point (0.6%) intraday decline which is possible but would require a clear catalyst; the PE base here means that every 30–50 point dip toward 23,050 will trigger gamma-driven futures buying from put writers adjusting their delta. This mechanical support from PE writers makes the 23,000–23,050 zone an excellent risk-reward area for scalp long positions if price reaches it intraday, with a stop below L6=22,998.01. |
⚡ Key Trigger: The structural fulcrum for the flat-open scenario is TC=23,124.27 on the upside and BC=23,091.83 on the downside — a 30-minute close above TC=23,124.27 with a simultaneous break above PDH=23,162.70 confirms bull trend day, while a 30-minute close below BC=23,091.83 confirms bear control and the CPR band transforms into resistance. The psychology driving this level is straightforward: the CPR band represents the equilibrium zone where Friday's buyers and sellers agreed on price, and Monday's first directional break from this zone is the market's verdict on whether to extend the prior session's strength or begin a corrective move.
BANKNIFTY
Inside — Narrow
▲ Bullish
Market Structure Trending (up or down trend) | Straddle ATM 55600 straddle = Call 312.00 + Put 243.90 = **555.90 points** total expected move, implying a range of approximately **55,024 to 56,156** for the monthly expiry on 29 Sep 2026. This is a relatively wide straddle for a near-expiry session, suggesting option markets are pricing meaningful uncertainty around the 55,600 zone and that a directional break of 555+ points is possible through expiry. | Max Pain Max Pain for BANKNIFTY Month (29-Sep-2026) = **56,500**, which is approximately **919.60 points above** Friday's close of 55,580.40. This massive gap between current price and Max Pain creates a significant gravitational pull toward 56,500 through monthly expiry, implying that option sellers would benefit enormously from a sharp BANKNIFTY recovery — the embedded max-pain bias is strongly bullish for the expiry week. |
Tomorrow's Complete Level Map
OI-R: 57,500 R3: 56,159.60 H6: 55,970.70 H5: 55,919.18 R2: 55,961.10 H4 ▶: 55,794.27 R1: 55,770.75 PDH: 55,762.60 H3 ↩: 55,687.33
TC: 55,576.32 P: 55,572.25 BC: 55,568.18
L3 ↩: 55,473.47 PDL: 55,373.75 S1: 55,381.90 L4 ▶: 55,366.53 S2: 55,183.40 L5: 55,241.62 L6: 55,190.10 S3: 54,993.05 OI-S: 54,000
↩ = Camarilla reversal point | ▶ = Camarilla breakout/breakdown trigger | OI-R/OI-S = Options wall (CE/PE max OI)
▲ Higher Open (Gap Up) — Open > Prev Close
▲ Bullish
Open lands: BANKNIFTY's Inside Narrow CPR (BC=55,568.18, TC=55,576.32, width just 8.14 points or 0.01%) is essentially a single-point CPR sitting precisely around Friday's close of 55,580.40 — which is already marginally above TC=55,576.32. A gap-up open creates a DOUBLE compression release upward, as the Inside CPR's compressed energy combined with a gap-up beyond TC=55,576.32 delivers a powerful bullish signal with above-average trending probability for the session.
CPR role: Launch Pad / Double Compression Release — the Inside Narrow CPR (BC=55,568.18 to TC=55,576.32) acts as a coiled spring; a gap-up above TC=55,576.32 triggers double-release energy upward, making the entire 8-point band immediate support and the directional bias aggressively bullish.
Minor Gap (0.05–0.25%) — Structure Dominant
A minor gap of 0.05–0.25% places BANKNIFTY opening between approximately 55,608 and 55,719, which is clearly above TC=55,576.32 and into the zone between TC and Camarilla H3=55,687.33, triggering the Inside CPR double-release upward with significant trend-day probability. The Narrow CPR confirmation rule requires only the first 15-minute candle close above TC=55,576.32, which in this scenario is already fulfilled by the gap-up open itself — meaning traders can look to enter on the first 15-minute pullback to or near TC=55,576.32 as a high-probability long. The first partial profit target is H3=55,687.33, followed by PDH=55,762.60 and R1=55,770.75 which form a tight confluence zone; the first 15-minute candle close above H3=55,687.33 confirms momentum continuation toward H4=55,794.27.
Significant Gap (0.25–0.5%) — Balanced
A significant gap of 0.25–0.5% places BANKNIFTY opening between approximately 55,719 and 55,858, which is above H3=55,687.33 and approaching the PDH=55,762.60 and R1=55,770.75 resistance cluster — a zone where Friday's sellers defended aggressively and where fresh short-sellers often enter on gap-up opens. Despite the Inside CPR double-release energy, opening directly into the PDH=55,762.60 resistance creates a gap-fill risk back toward TC=55,576.32, and traders should wait for a 15-minute candle close above PDH=55,762.60 before initiating fresh longs; immediate shorts targeting a gap-fill to H3=55,687.33 or TC=55,576.32 are also valid scalps in this zone. If PDH=55,762.60 is cleanly broken on the 15-minute close, the double-release energy resumes targeting R1=55,770.75, H4=55,794.27, R2=55,961.10, and H5=55,919.18 as the next sequence with the Max Pain pull toward 56,500 providing a week-long tailwind.
Large Gap (>0.5%) — Gap Direction Dominant
A large gap exceeding 0.5% places BANKNIFTY opening above approximately 55,858, potentially breaching H4=55,794.27 and R2=55,961.10 on the open — at this level the double-release energy from the Inside Narrow CPR is fully expressed but the risk of a gap-fill significantly increases because the 555-point straddle would be nearly consumed by the opening itself. Opening above H4=55,794.27 with no prior price discovery increases the probability of a sharp pullback toward TC=55,576.32, which would be the Narrow CPR confirmation that the double release was a false signal; experienced traders will sell the initial spike and wait for a pullback to H3=55,687.33 or PDH=55,762.60 before establishing long positions with stops below TC=55,576.32. The abort level for all long positions is a 15-minute close below TC=55,576.32, which would convert the Inside CPR double-release into a failed breakout and target the downside sequence toward L3=55,473.47 and PDL=55,373.75.
|
▲ Upside Path → OI-R Above H3=55,687.33, the upside path runs PDH=55,762.60 → R1=55,770.75 → H4=55,794.27 (breakout trigger) → R2=55,961.10 → H5=55,919.18 → H6=55,970.70 → R3=56,159.60, each requiring a 15-minute close confirmation per the Narrow CPR rule; H4=55,794.27 is especially significant because it aligns with PDH=55,762.60 plus 31 points, and breaking it confirms a new session high momentum run toward the 56,000 zone. The Max Pain at 56,500 and OI ceiling at 57,500 both suggest that the multi-day directional pull is strongly upward, making any breakout above R3=56,159.60 a momentum trade with room to the OI resistance. |
▼ Downside Path → OI-S Failure below TC=55,576.32 after a gap-up open is a classic double-release failure, and the bear path runs TC=55,576.32 → P=55,572.25 → BC=55,568.18 → L3=55,473.47 → PDL=55,373.75 → S1=55,381.90 → L4=55,366.53, with L4=55,366.53 and S1=55,381.90 forming the first major Camarilla demand zone that should produce a significant bounce. The Inside CPR compression energy, if released downward on a failed gap-up, often produces a fast and sharp move, so stop-losses below BC=55,568.18 must be respected immediately without waiting for confirmation. |
| 🔴 OI-R: OI resistance at 57,500 CE is a macro ceiling that is 1,919.60 points above Friday's close — it is the definitive expiry-week supply zone where CE writers have built the largest position, and reaching it intraday is virtually impossible; however, its existence creates a week-long directional target that institutional swing desks and options strategies are positioned toward. In the gap-up scenario, the immediate intraday CE-writer resistance manifests at R2=55,961.10 and R3=56,159.60 where shorter-dated CE positions create gamma pressure, and delta-hedging by CE writers at these strikes will dampen upside momentum as price approaches these levels. | 🟢 OI-S: OI support at 54,000 PE is 1,580 points below Friday's close and represents the ultimate downside anchor for the expiry cycle — in a gap-up session, this level is entirely irrelevant for intraday decisions but provides the psychological comfort that a massive PE base exists and broad market participants do not expect BANKNIFTY to breach 54,000 through expiry. The 54,000 PE wall means that any dip toward PDL=55,373.75 or even L4=55,366.53 during the session will attract systematic futures buying from put writers managing delta, creating a mechanical floor significantly above the actual OI strike. |
⚡ Key Trigger: The primary trigger for gap-up bulls in BANKNIFTY is a 15-minute candle close above H3=55,687.33, which is the Narrow CPR confirmation rule applied to the first Camarilla target — this level is the structural fulcrum because H3 represents the Camarilla mean-reversion zone where sellers initially defend, and a close above it signals that buyers have absorbed the first layer of supply and genuine momentum is present. If the 15-minute candle closes below TC=55,576.32, the double-release energy has failed, the bullish thesis is invalidated, and the bear path toward L3=55,473.47 becomes active.
▼ Lower Open (Gap Down) — Open < Prev Close
▼ Bearish
Open lands: For BANKNIFTY's Inside Narrow CPR (BC=55,568.18, TC=55,576.32), a gap-down open from Friday's close of 55,580.40 drops price below TC=55,576.32 and potentially below BC=55,568.18. A minor gap-down places price between TC and BC (inside the 8-point band), a significant gap-down places price below BC=55,568.18 triggering the Inside CPR double-release downward, and a large gap-down places price well below BC — in all cases the CPR band transforms from a neutral equilibrium zone to an overhead resistance cluster.
CPR role: Overhead Resistance / Double Compression Release Downward — below BC=55,568.18, the Inside Narrow CPR's compression energy is released to the downside, making the BC-to-TC band (55,568.18 to 55,576.32) a tight overhead resistance that sellers will defend on any early recovery attempt.
Minor Gap (0.05–0.25%) — Structure Dominant
A minor gap of 0.05–0.25% places BANKNIFTY opening between approximately 55,552 and 55,469, which is below TC=55,576.32 and potentially just below BC=55,568.18 — a zone where the Inside Narrow CPR's double-release energy is technically activated to the downside, but the gap size is small enough that recovery is still highly probable within the first 15 minutes. The Narrow CPR rule requires only a 15-minute candle close above TC=55,576.32 to invalidate the bearish double-release; if achieved, the session reverses bullish targeting H3=55,687.33 and PDH=55,762.60, and this 15-minute recovery pattern is extremely common in Inside Narrow CPR configurations as the compression energy seeks the path of least resistance. Failure to reclaim TC=55,576.32 within 15 minutes activates the bear sequence with L3=55,473.47 as the first target, followed by PDL=55,373.75 and S1=55,381.90.
Significant Gap (0.25–0.5%) — Balanced
A significant gap of 0.25–0.5% places BANKNIFTY opening between approximately 55,441 and 55,302, which is below BC=55,568.18 and past L3=55,473.47 — triggering a full double-release downward from the Inside CPR with the bear path now accelerating toward PDL=55,373.75 and S1=55,381.90. The 30-minute reclaim rule applies here: a 30-minute candle close back above BC=55,568.18 constitutes a failed breakdown and a powerful recovery signal because the Inside CPR's compressed energy can reverse direction rapidly when the initial break proves false; however, PUT writing at lower strikes by institutions means there may be limited recovery interest below PDL=55,373.75. If BC=55,568.18 is not reclaimed within 30 minutes, the bear acceleration targets L4=55,366.53, S2=55,183.40, L5=55,241.62, and L6=55,190.10 as the next Camarilla levels, with S3=54,993.05 as the extreme downside reference well above the 54,000 OI support.
Large Gap (>0.5%) — Gap Direction Dominant
A large gap exceeding 0.5% places BANKNIFTY opening below approximately 55,302, which breaches L4=55,366.53 on the open and signals a severe directional dislocation; at this level, the Inside CPR double-release downward has reached maximum expression and the straddle premium of 555.90 points would be substantially monetised by PUT holders, creating incentive for PE sellers to close longs and resist further selling near S1=55,381.90 and L4=55,366.53. Two consecutive 30-minute candle closes above BC=55,568.18 would be required to call any genuine recovery from this large gap-down, while continuation below L4=55,366.53 targets S2=55,183.40, L5=55,241.62, L6=55,190.10, and ultimately S3=54,993.05 where the next meaningful support cluster exists above the 54,000 OI floor. The 54,000 OI support remains the ultimate downside limit for the expiry cycle and should produce a mechanically significant bounce if tested.
|
▲ Upside Path → OI-R The recovery path runs BC=55,568.18 → TC=55,576.32 → P=55,572.25 (pivot) → H3=55,687.33 → PDH=55,762.60 → R1=55,770.75, with TC=55,576.32 reclaim being the first bull checkpoint and H3=55,687.33 being the first genuine recovery confirmation. Volume expansion on the TC reclaim and a 15-minute close above H3=55,687.33 validate the recovery, opening H4=55,794.27 and the 56,000+ zone aligned with the Max Pain pull toward 56,500. |
▼ Downside Path → OI-S The bear acceleration path below BC=55,568.18 runs L3=55,473.47 → PDL=55,373.75 → S1=55,381.90 → L4=55,366.53 → S2=55,183.40 → L5=55,241.62 → L6=55,190.10 → S3=54,993.05, with retail stop-losses clustered below PDL=55,373.75 creating a rapid acceleration once that level breaks cleanly on a 15-minute close. The L4=55,366.53 and S1=55,381.90 zone is the first major institutional demand cluster where structured option sellers will step in to buy futures. |
| 🔴 OI-R: OI resistance at 57,500 CE in a gap-down scenario becomes the macro ceiling that shorts are betting price cannot reach through expiry — it is 1,919.60 points above Friday's close and the CE writers here face zero delta pressure intraday, meaning they are not forced to hedge and add no selling pressure to the current session. The effective intraday overhead resistance from options in a gap-down scenario is the CPR band itself (BC=55,568.18 to TC=55,576.32) and the R1=55,770.75 zone where short-dated CE positions create gamma-driven selling. | 🟢 OI-S: OI support at 54,000 PE is the most important downside reference in a gap-down BANKNIFTY scenario — while 1,580 points below Friday's close, reaching this level would require a catastrophic intraday event, but its existence as the largest PE open interest strike means that put writers are acutely aware of the 54,000 support and will buy futures aggressively at any hint of approach to L5=55,241.62 and L6=55,190.10, creating a cascading mechanical support structure that prevents panic selling from reaching the OI strike itself. |
⚡ Key Trigger: The key trigger for gap-down BANKNIFTY sessions is the 15-minute candle reclaim of TC=55,576.32 for the bull thesis and the 15-minute candle close confirmation below L3=55,473.47 for the bear thesis — TC=55,576.32 is the structural fulcrum because reclaiming it restores price inside the CPR band and re-activates the double-release energy in the bullish direction, while closing below L3=55,473.47 confirms that sellers are in full control with acceleration toward PDL=55,373.75 likely. The Narrow CPR rule (first 15-minute candle) is strictly applied here because the extremely tight width of 8.14 points means any ambiguity resolves very quickly — there is no waiting for 30-minute confirmation in an Inside Narrow CPR.
◆ Near Flat Open — Open ≈ Prev Close (±0.05%)
◆ Neutral
Open lands: A ±0.05% flat open from 55,580.40 places BANKNIFTY opening between approximately 55,552 and 55,608 — a range that straddles both sides of the Inside Narrow CPR band (BC=55,568.18 to TC=55,576.32). This is the most electrically charged scenario for an Inside Narrow CPR: price is hovering directly over the compression point, and the market's first 15-minute directional decision will determine whether the double-release energy fires upward or downward.
CPR role: Compression Band / Directional Coil — the Inside Narrow CPR's 8-point band (BC=55,568.18 to TC=55,576.32) is a directional coil in a flat-open scenario; the first 15-minute candle closing outside this band in either direction triggers the compression release and sets the session's trend direction.
Near Flat (±0.05%)
A flat open directly on an Inside Narrow CPR (0.01% width) is one of the highest-probability trend-day setups in technical analysis, because the compressed energy from yesterday's trading range being engulfed within today's tiny CPR band must release in one direction — and the first 15-minute candle is the detonator. The BC=55,568.18 and TC=55,576.32 are separated by just 8.14 points, meaning that even a 1-minute candle can push price decisively outside the band and trigger the double-release energy; traders must be positioned before the 15-minute close rather than waiting for confirmation that arrives too late. Given the market structure label of 'Trending (up or down trend)' combined with the Narrow CPR, the session has a high probability of becoming a trend day — the direction of that trend is determined entirely by which side of the 8-point band the first 15-minute candle closes on. Both triggers are: bull — first 15-minute close above TC=55,576.32 (confirmed by price moving above H3=55,687.33 as the first milestone) targeting PDH=55,762.60, R1=55,770.75, H4=55,794.27, and R2=55,961.10; bear — first 15-minute close below BC=55,568.18 (confirmed by price moving below L3=55,473.47) targeting PDL=55,373.75, S1=55,381.90, L4=55,366.53, and S2=55,183.40.
|
▲ Upside Path → OI-R From above TC=55,576.32, the double-release bull path runs TC=55,576.32 → H3=55,687.33 (partial profit, 15-minute close confirmation) → PDH=55,762.60 → R1=55,770.75 → H4=55,794.27 (breakout trigger, trail stops) → R2=55,961.10 → H5=55,919.18 → H6=55,970.70 → R3=56,159.60, with the Max Pain pull toward 56,500 providing a weekly tailwind. Each Camarilla level is a partial-profit zone per the Narrow CPR rule, with stops trailed to the prior level after each successive breakout. |
▼ Downside Path → OI-S From below BC=55,568.18, the double-release bear path runs BC=55,568.18 → L3=55,473.47 (first partial cover) → PDL=55,373.75 → S1=55,381.90 → L4=55,366.53 (stop-loss cascade zone) → S2=55,183.40 → L5=55,241.62 → L6=55,190.10 → S3=54,993.05, with OI-S at 54,000 as the ultimate floor. The concentration of retail stop-losses below PDL=55,373.75 means the move from L3=55,473.47 to S1=55,381.90 is often the fastest and most violent portion of a bear trend day. |
| 🔴 OI-R: OI resistance at 57,500 CE in a flat-open Inside Narrow CPR scenario is the expiry-week macro target if bulls win the directional battle — the 1,919.60-point gap to this level means the intraday session will not reach it, but it defines the directional destination for structured bullish positions entering on Monday's trend-day resolution. The practical intraday CE resistance is R2=55,961.10 and R3=56,159.60 where shorter-dated call writers will delta-hedge by selling futures into any rally, creating natural profit-taking zones for long positions. | 🟢 OI-S: OI support at 54,000 PE in a flat-open scenario is the week-long safety net — put writers at this strike are so far out-of-the-money that they have minimal delta-hedging obligations intraday, but their collective presence means any panic selling is self-limiting well above 54,000. For intraday purposes, the PE base that matters is the positioning at 55,000–55,200 strikes where shorter-dated puts have significant OI, creating a mechanical support around S2=55,183.40 and L6=55,190.10 that acts as a bounce zone if the bear double-release scenario plays out. |
⚡ Key Trigger: Bull trigger: first 15-minute close above TC=55,576.32 with simultaneous price above H3=55,687.33 is the full confirmation of double-release upward; bear trigger: first 15-minute close below BC=55,568.18 with price below L3=55,473.47 confirms double-release downward. The 8-point gap between BC and TC makes this a binary decision point — there is no ambiguous middle ground, and the speed with which price exits this band in the first 15 minutes is itself a measure of momentum conviction; a fast breakout typically leads to larger intraday moves than a slow grind out.
SENSEX
Inside — Medium
◆ Neutral
Market Structure Balanced or transitional | Straddle ATM 73900 straddle: Week = Call 545.00 + Put 340.05 = **885.05 points** (range ~73,015–74,785); Month = Call 1,423.50 + Put 753.90 = **2,177.40 points** (range ~71,723–76,077). The weekly straddle of 885 points implies a very wide expected move for a near-expiry (01-Oct-2026) session, signalling elevated uncertainty and potentially high volatility in SENSEX this week. | Max Pain Max Pain: Week (01-Oct-2026) = **74,000** (approximately 104.26 points above Friday's close); Month (29-Oct-2026) = **76,000** (approximately 2,104.26 points above Friday's close). The weekly Max Pain at 74,000 creates a gravitational pull just 104 points above the close, suggesting mild upside pressure through Wednesday's expiry, while the monthly Max Pain at 76,000 implies a significant longer-term upside bias for October. |
Tomorrow's Complete Level Map
OI-R: 77,000 R3: 74,573.55 H6: 74,388.81 H5: 74,322.86 R2: 74,270.80 H4 ▶: 74,165.39 R1: 74,083.27 PDH: 73,968.05 H3 ↩: 74,030.57
TC: 73,838.13 P: 73,780.52 BC: 73,722.91
L3 ↩: 73,760.91 PDL: 73,477.77 S1: 73,592.99 L4 ▶: 73,626.09 S2: 73,290.24 L5: 73,468.62 L6: 73,402.67 S3: 73,102.71 OI-S: 69,000
↩ = Camarilla reversal point | ▶ = Camarilla breakout/breakdown trigger | OI-R/OI-S = Options wall (CE/PE max OI)
▲ Higher Open (Gap Up) — Open > Prev Close
▲ Bullish
Open lands: For SENSEX's Inside Medium CPR (BC=73,722.91, TC=73,838.13, width 115.22 points or 0.16%), Friday's close of 73,895.74 sits above TC=73,838.13 by approximately 57.61 points. A gap-up open amplifies this above-TC position, triggering the Inside CPR double-compression release upward — the entire 115-point CPR band (BC=73,722.91 to TC=73,838.13) becomes a support structure below the opening print, and the session bias is aggressively bullish from the first candle.
CPR role: Support / Double Compression Release Launch Pad — the Inside Medium CPR band (BC=73,722.91 to TC=73,838.13) sits below the gap-up open and acts as a layered support cushion; the Inside CPR's compression energy combined with a gap-up above TC=73,838.13 creates a high-probability bullish trend-day structure.
Minor Gap (0.05–0.25%) — Structure Dominant
A minor gap of 0.05–0.25% places SENSEX opening between approximately 73,933 and 74,079, which is above TC=73,838.13 and inside the zone between Friday's PDH=73,968.05 and H3=74,030.57 — the Medium CPR rule requires a first 30-minute candle close above TC=73,838.13 to confirm the double-release, which is already satisfied by the gap-up open. The opening in this range places price directly at or approaching PDH=73,968.05, the most recent intraday high and the first resistance that sellers will defend; a 30-minute candle close above PDH=73,968.05 is the practical trigger that confirms genuine bullish momentum rather than a gap-fill trap. Initial targets are H3=74,030.57 (first Camarilla partial) followed by R1=74,083.27 and H4=74,165.39, with the weekly Max Pain at 74,000 adding confluence to the H3=74,030.57 zone as a key inflection point.
Significant Gap (0.25–0.5%) — Balanced
A significant gap of 0.25–0.5% places SENSEX opening between approximately 74,079 and 74,264, which is above H3=74,030.57 and approaching R1=74,083.27 and H4=74,165.39 — a zone of layered resistance where Friday's sellers were not tested; opening into this zone creates immediate gap-fill risk back toward TC=73,838.13. The Inside CPR double-release energy supports an eventual breakout above H4=74,165.39 if the 30-minute candle closes above this level, but first there is a high probability of a pullback to test TC=73,838.13 or at least H3=74,030.57 as the new support; traders should look to buy dips toward TC=73,838.13 with a stop below BC=73,722.91 as the highest-probability intraday strategy. If H4=74,165.39 is cleared on a 30-minute close, the next targets are R2=74,270.80, H5=74,322.86, H6=74,388.81, and R3=74,573.55, well inside the weekly straddle range of 73,015–74,785.
Large Gap (>0.5%) — Gap Direction Dominant
A large gap exceeding 0.5% places SENSEX opening above approximately 74,264, which is above H4=74,165.39 and approaching H5=74,322.86 and R2=74,270.80 — extreme territory where the 885-point weekly straddle premium would be significantly monetised on the opening tick and where aggressive CE writers will sell into the rally. Opening at these levels means the Inside CPR's compression energy has been fully expressed in the gap itself, and the probability of a mean-reversion back toward TC=73,838.13 is very high — two 30-minute candle closes above TC=73,838.13 are required to confirm the Medium-width CPR's structural validity. The abort level for all bullish gap-up positions is a 30-minute close below TC=73,838.13, which would signal that the large gap-up has failed and targets a rapid decline toward BC=73,722.91, L3=73,760.91, and S1=73,592.99.
|
▲ Upside Path → OI-R Above PDH=73,968.05, the bull path runs H3=74,030.57 → Max Pain weekly=74,000 → R1=74,083.27 → H4=74,165.39 (key breakout trigger) → R2=74,270.80 → H5=74,322.86 → H6=74,388.81 → R3=74,573.55, with H4=74,165.39 requiring a two 30-minute close confirmation per the Medium CPR rule before establishing full trend-day positions. The OI ceiling at 77,000 CE is 3,104 points above Friday's close and represents the expiry-month macro target rather than an intraday objective, while the weekly Max Pain at 74,000 creates a gravitational convergence point that supports a hold above H3=74,030.57 through Wednesday's expiry. |
▼ Downside Path → OI-S Failure below TC=73,838.13 after the gap-up open triggers the Inside CPR double-release downward: TC=73,838.13 → P=73,780.52 → BC=73,722.91 → L3=73,760.91 (note: L3 is between BC and TC, so it is already tested; the real downside below BC is) → L4=73,626.09 → S1=73,592.99 → PDL=73,477.77 → L5=73,468.62 → L6=73,402.67 → S2=73,290.24. The L4=73,626.09 and S1=73,592.99 cluster forms the first significant demand zone below the CPR band, and a bounce from this area on a 30-minute candle is the typical pattern for Inside CPR failed breakouts. |
| 🔴 OI-R: OI resistance at 77,000 CE is the monthly expiry macro ceiling — it is 3,104.26 points above Friday's close and will not be tested intraday; CE writers at this massive strike have collected substantial premium and face no delta-hedging pressure from Monday's session, making them passive participants who simply cap any multi-week rally. The practical intraday CE resistance comes from shorter-dated call writers at R2=74,270.80 and R3=74,573.55 where gamma is significant, and these writers will sell SENSEX futures against any momentum run toward those levels, creating natural deceleration zones for longs. | 🟢 OI-S: OI support at 69,000 PE is the absolute monthly floor — it is 4,895.74 points below Friday's close and represents where institutional PUT writers have committed to defending the market; this level is completely irrelevant for Monday's intraday action but provides confidence that the broad market structure is not in a crash regime. The intraday PE support that matters is from SENSEX monthly Max Pain at 76,000 — but for the current-week context, the SENSEX weekly Max Pain at 74,000 (OI at 73,500 monthly PE) creates meaningful put-writer support at the BC=73,722.91 and S1=73,592.99 zone. |
⚡ Key Trigger: The primary trigger for gap-up bulls in SENSEX is a 30-minute candle close above PDH=73,968.05, confirming that Friday's intraday high has been surpassed with genuine buying conviction — this is the structural fulcrum because PDH represents the last tested resistance, and clearing it converts previous sellers into trapped shorts who will cover, adding momentum fuel toward H3=74,030.57 and R1=74,083.27. Failure of the 30-minute candle to close above PDH=73,968.05 — particularly if the candle closes back below TC=73,838.13 — activates the Inside CPR double-release downward and converts the gap-up into a bull trap, targeting L3=73,760.91 and BC=73,722.91.
▼ Lower Open (Gap Down) — Open < Prev Close
▼ Bearish
Open lands: A gap-down from Friday's SENSEX close of 73,895.74 pushes price below TC=73,838.13 and potentially into or below BC=73,722.91. Since Friday's close was already above TC, a minor gap-down places price inside the CPR band (between BC=73,722.91 and TC=73,838.13), a significant gap-down places price below BC=73,722.91 triggering the Inside CPR double-release downward, and a large gap-down places price well below BC=73,722.91 — in each case the CPR band (BC=73,722.91 to TC=73,838.13) converts from neutral equilibrium to overhead resistance.
CPR role: Overhead Resistance / Double Compression Release Downward — below BC=73,722.91, the Inside Medium CPR's compressed energy releases downward, and the entire 115-point band (BC=73,722.91 to TC=73,838.13) becomes a layered overhead resistance zone that sellers will defend on any recovery attempt.
Minor Gap (0.05–0.25%) — Structure Dominant
A minor gap of 0.05–0.25% places SENSEX opening between approximately 73,858 and 73,711, which is either inside the CPR band (between TC=73,838.13 and BC=73,722.91) or just below BC=73,722.91 — in both cases the Inside CPR double-release energy is either being tested or has just been triggered. Minor gaps inside the CPR band are ambiguous by nature: the first 30-minute candle determines whether price recovers above TC=73,838.13 (bull reversal targeting PDH=73,968.05) or confirms below BC=73,722.91 (bear acceleration toward L4=73,626.09 and S1=73,592.99). The Medium CPR confirmation rule requires a 30-minute close above TC=73,838.13 for the bull thesis with a retest expected, while the bear thesis requires a 30-minute close below BC=73,722.91 with the next target being L4=73,626.09.
Significant Gap (0.25–0.5%) — Balanced
A significant gap of 0.25–0.5% places SENSEX opening between approximately 73,711 and 73,527, which is below BC=73,722.91 and approaching L4=73,626.09 and S1=73,592.99 — the first meaningful Camarilla support cluster below the CPR band, and a zone where put writers at 73,500 strikes will defend with futures buying. The 30-minute reclaim rule applies: a 30-minute close back above BC=73,722.91 constitutes a failed double-release and strong recovery signal, consistent with Inside CPR dynamics where false breaks in either direction are common during the first 30 minutes; however, a 30-minute candle that closes below L4=73,626.09 confirms the bear path is active and puts S1=73,592.99, PDL=73,477.77, and L5=73,468.62 in scope. The weekly straddle range bottom at approximately 73,015 provides context for the maximum expected weekly downside, meaning S2=73,290.24 and S3=73,102.71 are within the expected-move envelope.
Large Gap (>0.5%) — Gap Direction Dominant
A large gap exceeding 0.5% places SENSEX opening below approximately 73,527, which is below S1=73,592.99 and approaching PDL=73,477.77 and L5=73,468.62 — a zone where the majority of intraday buy-side stops are clustered; breaching PDL=73,477.77 on the open would signal capitulation dynamics and a potential rapid run toward L6=73,402.67 and S2=73,290.24. In this scenario, the weekly straddle PUT holders (340.05 at the 73,900 strike) are deeply in-the-money and will take profits between 73,400 and 73,000, creating a mechanical buying force that limits further downside; experienced traders will look for the first 30-minute candle bounce above PDL=73,477.77 as a scalp long opportunity with a tight stop. Two 30-minute candle closes back above BC=73,722.91 are the full recovery signal for Medium-width CPR confirmation, while sustained trading below L6=73,402.67 opens S2=73,290.24 and eventually S3=73,102.71 as extreme bear targets.
|
▲ Upside Path → OI-R The recovery path runs BC=73,722.91 → P=73,780.52 → TC=73,838.13 → PDH=73,968.05 → H3=74,030.57, with each level requiring a 30-minute close confirmation per the Medium CPR rule; TC=73,838.13 reclaim is the structural validation that converts the CPR band from resistance back to neutral equilibrium and opens the session for a potential recovery to PDH=73,968.05. Volume expansion on the TC reclaim and two 30-minute closes above TC=73,838.13 are the full confirmation signal for the Inside Medium CPR double-release reversal to the upside. |
▼ Downside Path → OI-S The bear acceleration path below BC=73,722.91 runs L3=73,760.91 (inside band — already above BC, so not in scope) → L4=73,626.09 → S1=73,592.99 → PDL=73,477.77 → L5=73,468.62 → L6=73,402.67 → S2=73,290.24 → S3=73,102.71, with retail stop-losses below PDL=73,477.77 and L5=73,468.62 creating a sharp acceleration if those levels break on a 30-minute close. The SENSEX monthly OI support at 69,000 is 4,895 points below Friday's close, making it an expiry-level anchor rather than an intraday reference, but the weekly SENSEX OI support context (69,000) provides confidence that selling is self-limiting well above that level. |
| 🔴 OI-R: OI resistance at 77,000 CE in a gap-down scenario is entirely irrelevant for intraday action — it is more than 3,104 points above Friday's close and the CE writers here face zero delta pressure from any realistic intraday move; however, its existence caps any recovery attempt on a structural basis for the rest of the month and means that rallies toward 74,500+ will face institutional CE-writer selling. The effective intraday overhead resistance from options in a gap-down scenario is the CPR band (BC=73,722.91 to TC=73,838.13) where the Inside CPR's double-release resistance concentrates, plus the SENSEX monthly OI resistance context around 74,000 where substantial CE positions are written. | 🟢 OI-S: OI support at 69,000 PE is the absolute monthly floor and its existence provides a structural confidence level that this is not a crash environment — however, it is so far below current price that it provides no mechanical intraday support and is relevant only as an expiry-month risk context. The intraday PE support that matters in a gap-down is the SENSEX weekly Max Pain at 74,000 (which is ABOVE Friday's close) — this creates a perverse dynamic where put sellers at the 73,500–74,000 strikes must buy SENSEX futures to delta-hedge as price falls, providing mechanical support near S1=73,592.99 and L4=73,626.09. |
⚡ Key Trigger: The key trigger in a gap-down scenario is the 30-minute reclaim of BC=73,722.91 for the bull recovery thesis: a 30-minute close above BC=73,722.91 with improving volume restores price inside the CPR band and makes TC=73,838.13 the next immediate target, representing a failed double-release and a powerful reversal signal specific to Inside CPR setups. The bear confirmation trigger is a 30-minute close below L4=73,626.09: this level is critical because it sits 96.82 points below BC and represents the first substantial Camarilla support level, and breaking it on a 30-minute close signals that institutional demand has failed to absorb selling, activating systematic stop-losses and targeting S1=73,592.99 and PDL=73,477.77.
◆ Near Flat Open — Open ≈ Prev Close (±0.05%)
◆ Neutral
Open lands: A ±0.05% flat open from 73,895.74 places SENSEX opening between approximately 73,859 and 73,933, which is above TC=73,838.13 by a modest margin of 21–95 points. The Inside Medium CPR with a flat open above TC=73,838.13 is a directional coil: price is poised above the CPR band's top, and the session's direction will be determined by whether buyers defend TC=73,838.13 as support or sellers push price back inside the CPR band and below BC=73,722.91.
CPR role: Compression Band with Mild Bullish Lean — the flat open above TC=73,838.13 places the entire CPR band (BC=73,722.91 to TC=73,838.13) as immediate support below; the Inside CPR compression energy favours a trending day, and the slight bullish lean from opening above TC means the first 30-minute candle direction is the high-value signal.
Near Flat (±0.05%)
A flat open on an Inside Medium CPR (0.16%) that lands above TC=73,838.13 is a high-information setup where the first 30-minute candle will reveal the session's directional commitment — the Inside CPR compression energy means trend-day probability is elevated, but the Medium width (0.16%) means confirmation requires a full 30-minute close rather than the 15-minute quick-trigger of a Narrow CPR. The TC=73,838.13 is the critical bull-bear dividing line: a 30-minute close that holds above TC=73,838.13 and then extends toward PDH=73,968.05 confirms bull control, with a retest of TC=73,838.13 expected before the next leg higher; a 30-minute close below TC=73,838.13 shifts price inside the CPR band and a subsequent close below BC=73,722.91 triggers the full double-release downward. At 0.16% CPR width, trend-day probability for Inside setups remains high — historically, Inside CPRs (regardless of medium width) resolve into trending sessions more than 65% of the time because the compression from the prior day's trading within a narrow range creates pent-up directional energy. The dual triggers with exact values: bull — first 30-minute close above TC=73,838.13 followed by a break above PDH=73,968.05 targeting H3=74,030.57, R1=74,083.27, and the weekly Max Pain confluence at 74,000 → H4=74,165.39; bear — first 30-minute close below BC=73,722.91 targeting L4=73,626.09, S1=73,592.99, PDL=73,477.77, and L5=73,468.62.
|
▲ Upside Path → OI-R From above TC=73,838.13, the double-release bull path runs TC=73,838.13 → PDH=73,968.05 (30-minute close confirmation) → H3=74,030.57 (first Camarilla partial) → Max Pain weekly=74,000 → R1=74,083.27 → H4=74,165.39 (second partial, two 30-minute closes) → R2=74,270.80 → H5=74,322.86 → H6=74,388.81 → R3=74,573.55, each level providing a systematic partial-profit exit per Medium CPR rules. The OI ceiling at 77,000 is the monthly macro target and the weekly Max Pain at 74,000 creates a gravitational pull that supports holding longs above TC=73,838.13 through the Wednesday expiry. |
▼ Downside Path → OI-S From below BC=73,722.91, the double-release bear path runs BC=73,722.91 → L4=73,626.09 → S1=73,592.99 → PDL=73,477.77 → L5=73,468.62 → L6=73,402.67 → S2=73,290.24 → S3=73,102.71, with the first major support cluster at L4=73,626.09 and S1=73,592.99 where the Medium CPR rule suggests taking partial profits on shorts and awaiting a 30-minute close below PDL=73,477.77 before adding. The weekly straddle bottom at approximately 73,015 and the SENSEX monthly OI support at 69,000 both confirm that selling into these levels is counter-trend on a monthly basis, making them excellent reversal reference zones. |
| 🔴 OI-R: OI resistance at 77,000 CE in a flat-open Inside Medium CPR scenario is the monthly expiry ceiling — 3,104.26 points above Friday's close, it defines the macro bull target for October and will not be tested intraday; CE writers at this strike are the most confident macro bears in the system and their presence caps any sustained multi-week SENSEX rally above 76,000. The practical intraday CE pressure in a flat-open session comes from shorter-dated call writers at R1=74,083.27 and H4=74,165.39, where the weekly expiry (01-Oct-2026) CE positions have significant gamma and create delta-hedging sales that dampen momentum toward R2=74,270.80. | 🟢 OI-S: OI support at 69,000 PE in a flat-open SENSEX scenario provides absolute downside confidence but zero intraday mechanics — put writers at 69,000 have minimal delta and face no hedging pressure from any realistic intraday move. The functionally important put-writer support is clustered at 73,500 monthly SENSEX OI, making the S1=73,592.99 and L4=73,626.09 zone a strong mechanical support level where put-writing institutions will buy SENSEX futures to manage delta, and this creates a reliable bounce reference that intraday bear positions should respect as a first-partial-cover zone. |
⚡ Key Trigger: Bull trigger: first 30-minute close above TC=73,838.13 sustained above PDH=73,968.05 with volume expansion; this confirms the Inside CPR's double-release energy has fired upward and the day is structurally bullish. Bear trigger: first 30-minute close below BC=73,722.91 confirmed by a subsequent candle holding below this level; this converts the entire CPR band into overhead resistance and activates the double-release downward, with L4=73,626.09 as the first key target where Medium-width CPR confirmation requires a second 30-minute close below L4=73,626.09 before adding to short positions.
📊 VIX Insight: India VIX data is unavailable for the 25 Sep 2026 closing session, which is a significant limitation for precise options-premium decay modelling and sentiment calibration; without a VIX reading, traders cannot confirm whether implied volatility is elevated (favoring option selling strategies) or compressed (favoring directional breakout trades). In the absence of VIX, the straddle pricing provides a proxy: NIFTY weekly straddle at 196 points (0.85% of spot), BANKNIFTY monthly at 555.90 points (1.00% of spot), and SENSEX weekly at 885.05 points (1.20% of spot) — these premium levels are consistent with moderate-to-elevated IV for near-expiry contracts, suggesting traders should treat Monday as a potentially volatile session and size positions conservatively until the first 30-minute range is established.
Overall View:
All three indices — NIFTY, BANKNIFTY, and SENSEX — closed Friday 25 Sep 2026 on positive notes but remain significantly below their weekly CPR pivots (NIFTY at 23,140 vs weekly P=23,351.78; BANKNIFTY at 55,580 vs weekly P=56,383.27; SENSEX at 73,895 vs weekly P=74,570.91), confirming that the intermediate trend is bearish and that Monday's session is a potential counter-trend recovery opportunity rather than a trend-following setup. The most actionable confluence for bulls is the NIFTY and SENSEX weekly Max Pain levels (23,250 and 74,000 respectively) which are close to current prices and create gravitational support for mildly bullish expiry-week drift, while BANKNIFTY's massive Max Pain gap (current 55,580 vs pain 56,500) suggests the most explosive recovery potential if the Inside Narrow CPR's double-release fires upward. Traders should prioritise Inside CPR setups in BANKNIFTY (most explosive potential given 0.01% CPR width) and monitor NIFTY's 30-minute close relative to TC=23,124.27 as the session's primary directional signal for the broader market.
All three indices — NIFTY, BANKNIFTY, and SENSEX — closed Friday 25 Sep 2026 on positive notes but remain significantly below their weekly CPR pivots (NIFTY at 23,140 vs weekly P=23,351.78; BANKNIFTY at 55,580 vs weekly P=56,383.27; SENSEX at 73,895 vs weekly P=74,570.91), confirming that the intermediate trend is bearish and that Monday's session is a potential counter-trend recovery opportunity rather than a trend-following setup. The most actionable confluence for bulls is the NIFTY and SENSEX weekly Max Pain levels (23,250 and 74,000 respectively) which are close to current prices and create gravitational support for mildly bullish expiry-week drift, while BANKNIFTY's massive Max Pain gap (current 55,580 vs pain 56,500) suggests the most explosive recovery potential if the Inside Narrow CPR's double-release fires upward. Traders should prioritise Inside CPR setups in BANKNIFTY (most explosive potential given 0.01% CPR width) and monitor NIFTY's 30-minute close relative to TC=23,124.27 as the session's primary directional signal for the broader market.
Disclaimer: KRV Prime provides educational and informational content relating to financial markets. Articles, research, examples, charts, strategies and tools are provided for educational purposes and should not be interpreted as personalised investment advice or a guarantee of financial performance. Markets involve risk, including possible loss of capital. Past performance does not guarantee future results. KRV Prime is not a SEBI Registered Investment Adviser or Research Analyst.