
Index Analysis
Intraday Analysis for 06 Oct 2026
KRV Prime05 October 202656 min
Educational/Derived AnalysisSource: KRV Prime Market Insights (End-of-Day)As of 05 Oct 2026, 03:11 PM IST
Intraday Analysis for 06 Oct 2026
Markets closed on a firm note on 05 Oct 2026 with Nifty gaining **+0.60%** to **22,555.75**, BankNifty up **+0.48%** to **54,714.10**, and Sensex rising **+0.66%** to **72,382.47**, suggesting broad-based buying across large-caps. India VIX data is unavailable for this session, which limits precise volatility-regime classification; however, the moderate gains without a VIX spike suggest the market is not in panic mode and participants are positioned for a range-to-mildly-bullish session on 06 Oct. All three indices carry **Ascending CPRs** into the next session — Nifty and Sensex with Medium width (0.14%) and BankNifty with a Narrow width (0.08%) — collectively signalling that directional momentum exists but confirmation from the opening 15–30 minutes will be critical before committing to directional trades.
Key Market Signals — Intraday Setup
All three indices enter 06 Oct 2026 with Ascending CPRs sitting above yesterday's close, confirming multi-session bullish structure, but the weekly CPRs for Nifty, BankNifty, and Sensex are all **Descending and Wide**, creating an important overhead conflict that traders must respect — gap-up opens will face dual resistance from weekly CPR bands and OI CE walls. BankNifty's Narrow Ascending CPR (0.08%) is the standout signal: it raises the probability of a trending session, meaning whichever direction the first 15-minute candle establishes is likely to be sustained through the day.
Deep Technical Analysis & Levels
NIFTY
Ascending — Medium (Width 0.14%)
▲ Bullish
Market Structure Balanced or transitional | Straddle ATM 22,550 weekly straddle at **153.65 pts** (Call 79.5 + Put 74.15) implies an expected intraday move of roughly **±153 pts**, putting the range at approximately **22,402 to 22,704**; the monthly straddle at 619 pts reflects broader uncertainty over the coming weeks but is less relevant for today's intraday positioning. | Max Pain Weekly Max Pain at **22,550** — essentially at the ATM strike and within 6 pts of yesterday's close of 22,555.75 — strongly suggests option sellers will defend this zone and that price will gravitate toward 22,550 into Thursday's weekly expiry; any sustained move away from this strike will face mean-reversion pressure from short-gamma participants. |
Tomorrow's Complete Level Map
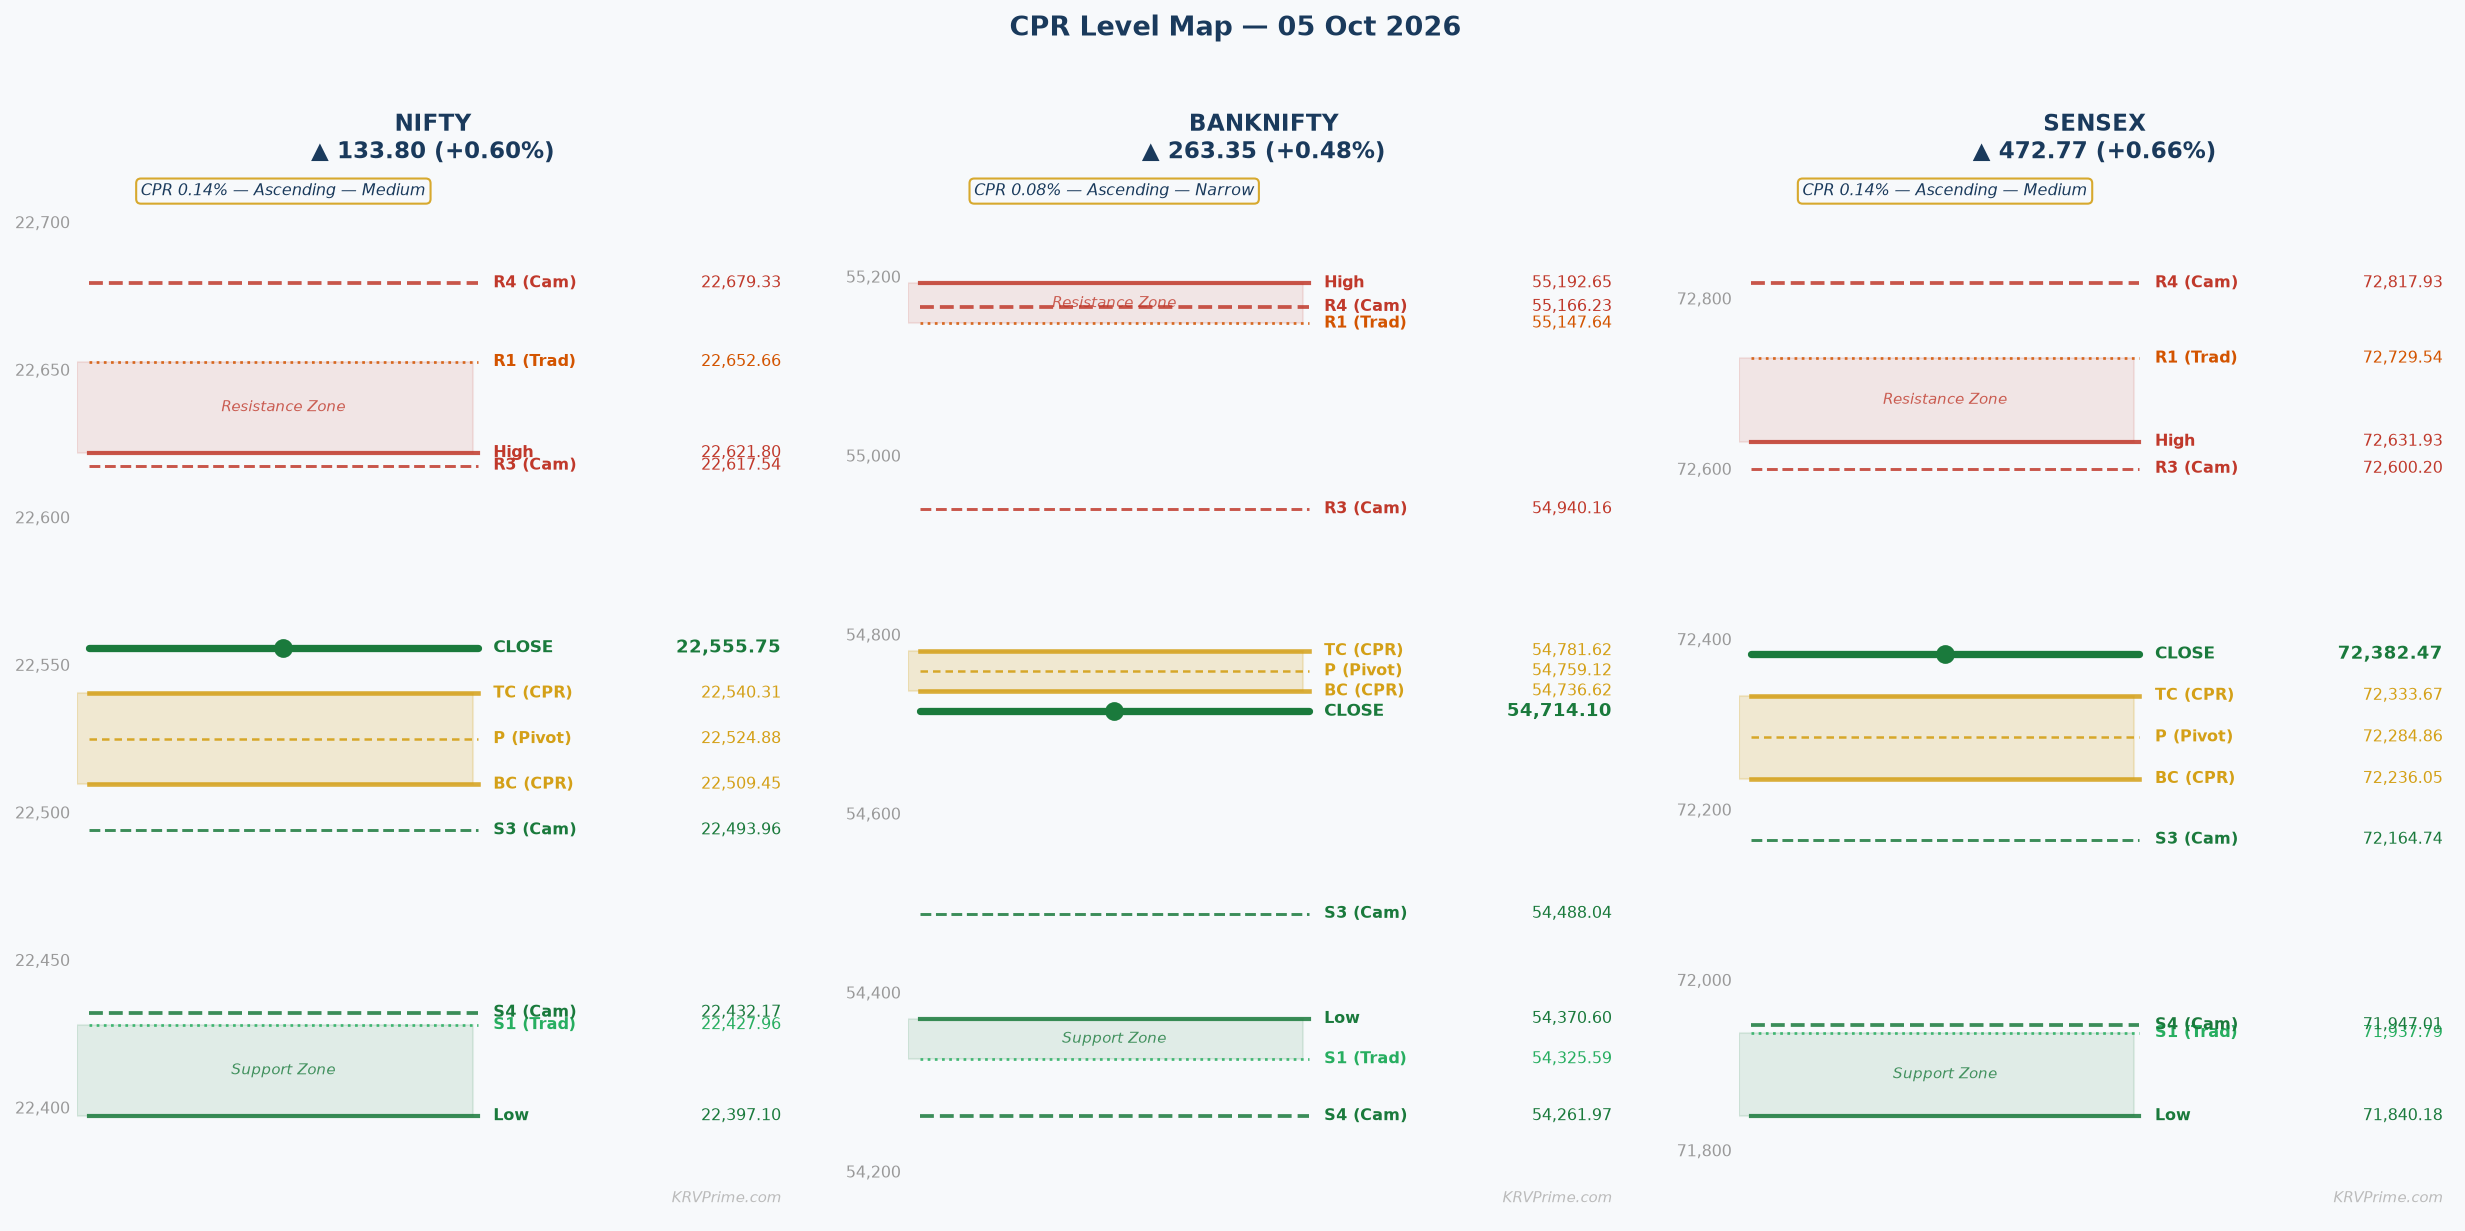
OI-R: 23,000 R3: 22,877.36 H6: 22,782.04 H5: 22,751.50 R2: 22,749.58 H4 ▶: 22,679.33 R1: 22,652.66 PDH: 22,621.80 H3 ↩: 22,617.54
TC: 22,540.31 P: 22,524.88 BC: 22,509.45
L3 ↩: 22,493.96 PDL: 22,397.10 S1: 22,427.96 L4 ▶: 22,432.17 S2: 22,300.18 L5: 22,360.00 L6: 22,329.46 S3: 22,203.26 OI-S: 21,500
↩ = Camarilla reversal point | ▶ = Camarilla breakout/breakdown trigger | OI-R/OI-S = Options wall (CE/PE max OI)
▲ Higher Open (Gap Up) — Open > Prev Close
▲ Bullish
Open lands: With an Ascending CPR (BC 22,509.45 > prev session TC), a gap-up open above the previous close of 22,555.75 places the open either inside the CPR band (between BC 22,509.45 and TC 22,540.31 — though this is technically above prev close but note TC is below prev close at 22,540.31, so a minor gap up lands just above TC 22,540.31 near H3 22,617.54) or, for a significant/large gap, well above TC and approaching PDH 22,621.80 or Camarilla H3 22,617.54.
CPR role: In a gap-up scenario, the CPR band (BC 22,509.45 – TC 22,540.31) immediately transforms into a **launch pad and support zone** below the open — the entire CPR sits beneath the opening price, meaning any intraday pullback to TC 22,540.31 represents a high-probability buy-on-dip zone; a breakdown through BC 22,509.45 would negate the bullish gap narrative entirely.
Minor Gap (0.05–0.25%) — Structure Dominant
A minor gap up of 0.05%–0.25% would place the open in the range of roughly **22,567 to 22,611**, which is above TC 22,540.31 but below the critical PDH 22,621.80 and Camarilla H3 22,617.54. The Ascending Medium CPR adds clear confirmation to this gap since the entire CPR band (BC 22,509.45 – TC 22,540.31) acts as a support cushion below the open, creating a bullish lean without being overextended. Traders should watch for a **first 30-minute candle close above H3 22,617.54** — the Camarilla mean-reversion zone — as the trigger for continuation toward R1 22,652.66, with partial profits booked there per the Medium width confirmation rule; failure to hold TC 22,540.31 on any pullback would be the stop-trigger for intraday longs.
Significant Gap (0.25–0.5%) — Balanced
A significant gap of 0.25%–0.5% would open Nifty in the zone of **22,611 to 22,667**, directly inside the PDH 22,621.80 and Camarilla H3 22,617.54 confluence — this is a critical resistance cluster where gap-fill risk is moderate and the market often pauses for the first 30 minutes. At this level, the gap and CPR structure are balanced per the framework: the Ascending CPR is supportive, but opening directly at H3 22,617.54 and PDH 22,621.80 means the path of least resistance is only higher if buyers can sustain above this dual resistance in the first half-hour. The specific first target is **R1 22,652.66** (first Traditional resistance), followed by H4 22,679.33 as the Camarilla breakout trigger; delta-hedging flow from CE sellers at these strikes will create natural selling pressure, so look for two consecutive 15-minute closes above H3 22,617.54 before treating the gap as a genuine breakout rather than a fade candidate.
Large Gap (>0.5%) — Gap Direction Dominant
A large gap of more than 0.5% would push the open above **22,667** and potentially toward or above H4 22,679.33 — the Camarilla breakout trigger — which, if opened into, signals extreme momentum but also maximum gap-fill risk given the straddle range of only 153.65 pts. Opening above PDH 22,621.80, H3 22,617.54, H4 22,679.33, and approaching R1 22,652.66 simultaneously compresses all key resistance into a very narrow zone, where CE writers will aggressively defend and gamma exposure spikes. Traders should use the straddle range (upper end ~22,704) as the probable resistance ceiling and avoid chasing; wait for a **30-minute consolidation above H4 22,679.33** before targeting R2 22,749.58 and H5 22,751.50 — the abort level is a close back below H3 22,617.54, and the maximum upside before OI-R at 23,000 makes this a scalp-only environment above 22,700.
|
▲ Upside Path → OI-R The confirmed upside path progresses as: **H3 22,617.54** (Camarilla mean-reversion first stall — partial profit zone) → **PDH 22,621.80** (prior session high — psychological resistance) → **R1 22,652.66** (first Traditional target — book 50% position per Medium width rule) → **H4 22,679.33** (Camarilla breakout trigger — second partial) → **R2 22,749.58 / H5 22,751.50** (twin resistance cluster — near-full exit) → **OI-R 23,000** (CE OI wall — maximum session target, unlikely intraday without a very large catalyst). Each level represents genuine supply from option writers; volume must expand on each breakout or the move is likely a false breakout. |
▼ Downside Path → OI-S The failure path on a gap-up begins with inability to hold **TC 22,540.31** — once price closes a 30-minute candle below TC, the CPR band shifts from support to overhead resistance, and the next destination is **P 22,524.88** then **BC 22,509.45**; a confirmed close below BC 22,509.45 flips the structure fully bearish for the day, targeting **L3 22,493.96** (Camarilla mean-reversion support) then **L4 22,432.17 / S1 22,427.96** (twin bear target). Loss of TC 22,540.31 is the specific structural alarm because it means the entire Ascending CPR's support role has failed, trapping gap-up buyers who entered without confirmation. |
| 🔴 OI-R: **OI-R at 23,000** is the CE maximum OI strike for the weekly expiry — this represents the highest concentration of call writing in the market and functions as an extremely robust ceiling for any intraday rally; CE writers at 23,000 are structurally short gamma and will hedge by selling futures on any rally toward this strike, creating a self-reinforcing ceiling. Given that 23,000 is approximately 445 pts above yesterday's close of 22,555.75 and the weekly straddle implies only 153.65 pts of expected move, reaching OI-R intraday is a very low-probability event and should not be used as a primary target — treat it as the maximum possible upside for swing positioning only. | 🟢 OI-S: **OI-S at 21,500** is the PE maximum OI strike and represents the primary downside floor where PE writers will aggressively defend — at 1,055 pts below current levels, it is entirely irrelevant for today's intraday gap-up scenario and will not be tested; its significance lies purely in confirming that there is a strong structural base well below current prices, which reduces systemic downside risk and supports the bullish gap-up bias from a risk-reward perspective. |
⚡ Key Trigger: The key trigger for a gap-up session is a **first 30-minute candle close above Camarilla H3 22,617.54** (and PDH 22,621.80) on above-average volume — this dual confirmation is the structural fulcrum because H3 is the Camarilla mean-reversion zone and PDH is the prior session's high, and a sustained close above both signals that buyers have absorbed all available supply from yesterday's high while momentum is genuine. If price opens gap-up but fails to close the first 30-minute candle above H3 22,617.54, the session risks reverting toward TC 22,540.31 then P 22,524.88, converting the gap-up into a bull trap that penalizes aggressive early buyers.
▼ Lower Open (Gap Down) — Open < Prev Close
▼ Bearish
Open lands: With an Ascending CPR (BC 22,509.45 / TC 22,540.31 both above prev session levels), a gap-down open below the previous close of 22,555.75 places the open below TC 22,540.31 — for a minor gap-down, the open is between BC 22,509.45 and TC 22,540.31 (inside the CPR band); for a significant gap-down, the open is below BC 22,509.45 near L3 22,493.96; for a large gap-down, the open is below L3 22,493.96 approaching PDL 22,397.10.
CPR role: In a gap-down scenario against an Ascending CPR, the CPR band becomes **overhead resistance** — the gap-down opens below the CPR, meaning bulls must work against the entire CPR band to recover; BC 22,509.45 is the first recovery hurdle and TC 22,540.31 is the second, and failure to reclaim BC within the first 30 minutes is a bearish structural signal that confirms selling pressure is dominant despite the upward-trending CPR.
Minor Gap (0.05–0.25%) — Structure Dominant
A minor gap down of 0.05%–0.25% would place the open in the zone of **22,499 to 22,543**, likely inside the CPR band between BC 22,509.45 and TC 22,540.31 — this is a high-information zone because the market is testing whether the Ascending CPR acts as support or is penetrated as resistance. Minor gaps inside CPR often fill within 30–60 minutes as the market oscillates around the pivot P 22,524.88, so patience is required before directional commitment; the critical signal is whether price can close a 30-minute candle above TC 22,540.31 (recovery, target H3 22,617.54) or break below BC 22,509.45 (bearish confirmation, target L3 22,493.96 then L4 22,432.17).
Significant Gap (0.25–0.5%) — Balanced
A significant gap-down of 0.25%–0.5% would open the index in the range of **22,443 to 22,499**, below the entire CPR band and near L3 22,493.96 — the Camarilla mean-reversion zone — which is a natural first bounce level; however, if this level fails to hold on a 30-minute close, the next bearish target is L4 22,432.17 / S1 22,427.96 (twin support cluster). The recovery thesis requires a **30-minute candle reclaim above BC 22,509.45**, which would suggest the gap-down was absorbed and PUT writers at OI-S 21,500 are providing structural support; without this reclaim, the failure-and-resume pattern activates with L4 22,432.17 as the session's bear target where PUT writers are likely to monetize. PE writing momentum at lower strikes would increase delta pressure to the downside if L3 22,493.96 fails, accelerating the move toward L4 22,432.17 and PDL 22,397.10.
Large Gap (>0.5%) — Gap Direction Dominant
A large gap-down of more than 0.5% would open below **22,443** — potentially testing or breaching PDL 22,397.10 and approaching S1 22,427.96 and L4 22,432.17 simultaneously — which is a panic-zone open that creates two competing dynamics: institutional buyers stepping in near PDL (prior session low support) and retail stop-losses triggering below PDL, accelerating the move toward L5 22,360 and L6 22,329.46. Without VIX data, the panic-vs-recovery determination is harder, but the straddle of 153.65 pts implies the market did not price this large a move, meaning implied volatility will spike on open and make options expensive for intraday buyers; the primary straddle monetisation signal would come from a sharp spike followed by a snap-back, confirming a washout low. Recovery levels to watch are BC 22,509.45 and P 22,524.88 — if price recovers above BC within 60 minutes, the large gap becomes an intraday reversal opportunity targeting TC 22,540.31 and H3 22,617.54.
|
▲ Upside Path → OI-R The recovery upside path on a gap-down is: **BC 22,509.45** (first reclaim — confirms absorption) → **P 22,524.88** (pivot — hold confirms bullish momentum) → **TC 22,540.31** (top of CPR — full recovery signal) → **H3 22,617.54** (Camarilla mean-reversion resistance) → **PDH 22,621.80** (prior session high) → **OI-R 23,000** (distant weekly ceiling). Genuine recovery is confirmed only when two consecutive 30-minute candles close above TC 22,540.31, as this demonstrates that gap-down sellers have been absorbed and bulls are in control. |
▼ Downside Path → OI-S The primary bear path is: **L3 22,493.96** (Camarilla mean-reversion — first stall, partial cover) → **L4 22,432.17 / S1 22,427.96** (twin breakdown trigger — retail stop losses cascade here) → **PDL 22,397.10** (prior session low — critical structural support) → **L5 22,360** → **L6 22,329.46 / S2 22,300.18** → **OI-S 21,500** (distant PE wall). Retail stop-losses below L3 22,493.96 are concentrated and their triggering typically accelerates the move to L4 22,432.17 within one or two candles, making this a high-speed bear segment that should be pre-planned rather than reacted to. |
| 🔴 OI-R: **OI-R at 23,000** serves as a distant overhead ceiling in a gap-down scenario — CE writers at 23,000 are structurally short gamma and their hedging activity (buying futures on rallies) would actually provide a tailwind for any recovery attempt, but only if price can first reclaim the CPR band; below BC 22,509.45, OI-R at 23,000 is essentially irrelevant for intraday action and only matters as context that no aggressive short covering from CE writers will occur at these levels. In a gap-down, OI-R reinforces that the path of least resistance, if recovery fails, is lower — not higher toward 23,000. | 🟢 OI-S: **OI-S at 21,500** is the PE maximum OI wall and represents where the largest concentration of PUT writing exists — in a gap-down session, this is the primary downside floor that option sellers will defend, and any approach toward this level (though very unlikely intraday) would trigger massive PUT buying to hedge exposure; more practically, the PE base at 21,500 provides systemic support that should limit the scale of any decline, and institutional participants will use gap-down opens as buying opportunities with this level as their ultimate risk boundary. |
⚡ Key Trigger: **Failure to reclaim BC 22,509.45 within the first 30 minutes** is the primary bear confirmation — this means the Ascending CPR has failed to serve as support and the structural bias shifts fully bearish for the session, targeting L3 22,493.96 and L4 22,432.17 in sequence. The bull trigger is the converse: a **first 30-minute candle close above BC 22,509.45** followed by a close above TC 22,540.31 signals gap-fill recovery toward PDC 22,555.75 and H3 22,617.54, making it a tradeable long with stops below BC 22,509.45.
◆ Near Flat Open — Open ≈ Prev Close (±0.05%)
◆ Neutral
Open lands: A flat open of ±0.05% places Nifty in the range **22,544 to 22,567** — above TC 22,540.31 but below H3 22,617.54, meaning the open is just above the top of the CPR band (TC 22,540.31), which is the most structurally clean opening for an Ascending Medium CPR because the CPR is fully beneath the open, acting as immediate support.
CPR role: In a flat-open scenario with an Ascending Medium CPR, the band (BC 22,509.45 – TC 22,540.31) becomes a **decision zone and compression band** — price opening just above TC 22,540.31 means bulls have technical control but must defend this level; any dip back into the CPR band (between TC and BC) creates a high-information 15–30 minute battleground where the first decisive close determines the day's direction.
Near Flat (±0.05%)
A flat open in an Ascending Medium CPR (width 0.14%) is one of the highest-quality intraday setups because it places the market precisely at the fulcrum — just above TC 22,540.31 — and the first 15-minute candle becomes a directional declaration rather than noise. TC 22,540.31 is the structural bull-bear divider: a close above it means the CPR has served its role as a launch pad and bulls are in control of the session, while a close below TC and subsequently below BC 22,509.45 hands the session to bears. With CPR width at 0.14% (Medium category), the probability of a trending day is elevated compared to a Wide CPR — narrow-to-medium CPR sessions have historically shown trend day probability of 60–65% when price opens above TC, because the tight band reduces the noise zone and forces decisive action. The bull trigger is a **first 30-minute close above TC 22,540.31** sustained for the next candle, which targets H3 22,617.54 (Camarilla mean-reversion first stall — partial profit), then R1 22,652.66 (Traditional first target — book 50% per Medium rule); the bear trigger is a **first 30-minute close below BC 22,509.45**, which targets L3 22,493.96 then L4 22,432.17 / S1 22,427.96, with max pain gravity at 22,550 adding a mean-reversion pull that will resist extreme moves in either direction into the weekly expiry.
|
▲ Upside Path → OI-R **TC 22,540.31** (CPR top — launch pad, must hold on 30-min close) → **H3 22,617.54** (Camarilla mean-reversion first resistance — first partial profit, book 30–40% here) → **PDH 22,621.80** (prior session high — psychological and technical resistance, trail stop to TC) → **R1 22,652.66** (Traditional first target — second partial, book another 30%) → **H4 22,679.33** (Camarilla breakout trigger — momentum confirmation if crossed) → **R2 22,749.58 / H5 22,751.50** (twin resistance cluster — near-full exit for intraday) → **OI-R 23,000** (CE OI wall — maximum ceiling, not an intraday target). Volume must expand at each breakout level or the move is likely exhausted. |
▼ Downside Path → OI-S **BC 22,509.45** (CPR bottom — first bear confirmation on close below) → **L3 22,493.96** (Camarilla mean-reversion support — first partial cover for shorts, 30% position) → **PDL 22,397.10** (prior session low — major structural support) → **L4 22,432.17 / S1 22,427.96** (twin bear target — second partial, book 30% here) → **L5 22,360** (Camarilla extended downside target) → **L6 22,329.46 / S2 22,300.18** (extreme downside cluster) → **OI-S 21,500** (PE wall — structural floor, maximum downside). Retail stop-losses are concentrated below L3 22,493.96 and their triggering typically accelerates the move to L4 22,432.17 within 1–2 candles. |
| 🔴 OI-R: **OI-R at 23,000** (CE maximum OI for the week) is the supreme ceiling for any bullish move in a flat-open session — CE writers at 23,000 are short gamma and will sell futures rallies aggressively as price approaches this level, but given that 23,000 is approximately 444 pts above the current close and the weekly straddle implies only 153.65 pts of expected move, OI-R will not be threatened today; its role is to confirm that there is ample upside headroom before any structural resistance from option positioning, supporting the bullish lean above TC 22,540.31. The practical implication is that intraday longs have a clear run from TC to R2 22,749.58 without CE writer interference, making the upper Camarilla and Traditional levels the realistic profit-taking zones. | 🟢 OI-S: **OI-S at 21,500** (PE maximum OI for the week) is the structural bedrock for the session — PE writers at 21,500 have the largest open interest concentration and will defend this level with additional PE selling on any approach, creating a near-impenetrable floor that supports the bullish tilt in a flat-open scenario. Practically, OI-S at 21,500 being 1,055 pts below current levels means downside risk for intraday longs is structurally cushioned, and the max pain at 22,550 — just 5.75 pts below the current close — reinforces that option sellers will gravitate price toward 22,550 into expiry, adding a mean-reversion force that limits extreme downside moves in today's session. |
⚡ Key Trigger: **First 30-minute candle close above TC 22,540.31** = bull bias confirmed, trade longs targeting H3 22,617.54 and R1 22,652.66; **first 30-minute candle close below BC 22,509.45** = bear bias confirmed, trade shorts targeting L3 22,493.96 and L4 22,432.17. TC 22,540.31 is the structural fulcrum because it is the top of the Ascending CPR — a CPR that has already shifted upward from the previous session — meaning bulls have pre-positioned above this level and any sustained close below it represents a failure of the multi-session uptrend signal embedded in the CPR structure.
BANKNIFTY
Ascending — Narrow (Width 0.08%)
▲ Bullish
Market Structure Trending (up or down trend) | Straddle ATM 54,700 monthly straddle at **1,725.2 pts** (Call 971.45 + Put 753.75) implies an expected monthly move of ±1,725 pts, putting the range at roughly **52,975 to 56,425**; for intraday purposes, traders should size positions assuming a realistic intraday move of 400–600 pts based on the Narrow CPR trending-day dynamic, noting that the monthly straddle is not the primary intraday volatility reference. | Max Pain Monthly Max Pain at **56,000** — approximately 1,286 pts above yesterday's close of 54,714.10 — suggests that on a monthly basis option sellers are positioned for BankNifty to drift higher toward 56,000 by expiry on 27 Oct 2026; for today's intraday session, max pain at 56,000 is too distant to influence price directly, but it signals that the structural bias from option positioning is bullish over the coming weeks, supporting today's Ascending Narrow CPR bullish setup. |
Tomorrow's Complete Level Map
OI-R: 58,000 R3: 55,969.69 H6: 55,541.34 H5: 55,430.28 R2: 55,581.17 H4 ▶: 55,166.23 R1: 55,147.64 PDH: 55,192.65 H3 ↩: 54,940.16
TC: 54,781.62 P: 54,759.12 BC: 54,736.62
L3 ↩: 54,488.04 PDL: 54,370.60 S1: 54,325.59 L4 ▶: 54,261.97 S2: 53,937.07 L5: 53,997.92 L6: 53,886.86 S3: 53,503.54 OI-S: 54,000
↩ = Camarilla reversal point | ▶ = Camarilla breakout/breakdown trigger | OI-R/OI-S = Options wall (CE/PE max OI)
▲ Higher Open (Gap Up) — Open > Prev Close
▲ Bullish
Open lands: With an Ascending Narrow CPR (BC 54,736.62 / TC 54,781.62 both above the previous session's CPR), a gap-up open above prev close of 54,714.10 places the open inside or above the CPR band — a minor gap-up (0.05%–0.25%) opens between TC 54,781.62 and H3 54,940.16; a significant gap-up (0.25%–0.5%) opens near or above H3 54,940.16; a large gap-up (>0.5%) approaches PDH 55,192.65 or R1 55,147.64.
CPR role: In a gap-up scenario with a Narrow Ascending CPR, the CPR band (BC 54,736.62 – TC 54,781.62) becomes an immediate **launch pad and tight support zone** — the narrow width (0.08%) means any retest of the CPR is a very precise, high-conviction support test; the first 15-minute candle closing above TC 54,781.62 is the primary trigger because Narrow CPRs have the highest trend-day probability, and the Trending market structure label amplifies this directional conviction.
Minor Gap (0.05–0.25%) — Structure Dominant
A minor gap-up of 0.05%–0.25% opens BankNifty in the range of approximately **54,741 to 54,850**, which places the open just inside the CPR band (above BC 54,736.62) or just above TC 54,781.62 — an extremely constructive setup because the Narrow Ascending CPR (0.08%) creates maximum compression and any open above TC in a trending-structure index typically resolves with a directional run within the first 15 minutes. The CPR structure here adds full confirmation to the gap since the entire Ascending CPR is above the previous session's CPR, signalling multi-session bullish momentum, and the Trending market structure tag reinforces that this is not a range-bound day. The specific trigger is a **first 15-minute candle close above TC 54,781.62** (Narrow width rule), which sets the target sequence: H3 54,940.16 (first partial, book 30–35%) → R1 55,147.64 / H4 55,166.23 (twin first major target, second partial) → stop trailed to TC 54,781.62 after R1 is hit.
Significant Gap (0.25–0.5%) — Balanced
A significant gap-up of 0.25%–0.5% opens BankNifty in the range of approximately **54,850 to 54,987**, above TC 54,781.62 and approaching or at Camarilla H3 54,940.16 — the Camarilla mean-reversion zone — which is the first natural stall point and where initial fade attempts from short-term traders will emerge. At this level, gap and structure are balanced per the framework: the Ascending Narrow CPR is fully supportive below, but opening directly at H3 54,940.16 means gap-fill risk toward TC 54,781.62 exists in the first 15 minutes, making the first candle close critical before committing to size. If the **first 15-minute candle closes above H3 54,940.16** on above-average volume, delta-hedging from CE writers at 55,000 and 55,500 will add momentum fuel targeting R1 55,147.64 / H4 55,166.23, then H5 55,430.28; gap-fill risk (back to TC 54,781.62) becomes dominant if H3 fails to hold on the first candle.
Large Gap (>0.5%) — Gap Direction Dominant
A large gap-up of more than 0.5% opens BankNifty above **54,987**, potentially in the R1 55,147.64 / PDH 55,192.65 zone or above — this is an extreme scenario where gap dominance overrides CPR structure per the framework, and the primary risk is a gap-fill reversion toward TC 54,781.62 once the initial spike exhausts. Opening at or above PDH 55,192.65 means BankNifty is in breakout territory where two consecutive 30-minute closes are required per the Narrow-Wide hybrid logic; however, given the OI-S at 54,000 being only 714 pts below the current close, any large gap-up that fails should find strong support well before testing OI-S. The straddle context (1,725.2 pts monthly) accommodates large moves, and targets for a confirmed large gap-up are H4 55,166.23 → H5 55,430.28 → H6 55,541.34 → R2 55,581.17, with abort level at a close back below TC 54,781.62.
|
▲ Upside Path → OI-R **TC 54,781.62** (CPR top — Narrow launch pad, hold on 15-min close) → **H3 54,940.16** (Camarilla mean-reversion — first partial profit, book 30–35%) → **PDH 55,192.65** (prior session high — psychological resistance) → **R1 55,147.64 / H4 55,166.23** (twin resistance cluster — second partial profit, book another 30–35%; trail stop to H3 54,940.16) → **H5 55,430.28** (extended Camarilla target — third partial) → **H6 55,541.34 / R2 55,581.17** (extreme upside cluster — near-full exit) → **OI-R 58,000** (CE OI wall — maximum monthly ceiling, not an intraday target for today). Volume expansion at each level is mandatory to treat the breakout as genuine rather than a squeeze. |
▼ Downside Path → OI-S If the gap-up fades, the failure path is: **TC 54,781.62** (loss triggers CPR role reversal) → **P 54,759.12** (pivot — momentum test) → **BC 54,736.62** (CPR bottom — full CPR failure, bear signal) → **L3 54,488.04** (Camarilla mean-reversion support — first short target) → **PDL 54,370.60** (prior session low — major support) → **L4 54,261.97 / S1 54,325.59** (twin bear target) → **OI-S 54,000** (PE OI wall — primary downside floor). The critical structural alarm is a 15-minute close below BC 54,736.62, which represents an Ascending Narrow CPR failure — a rare but high-conviction bearish signal when it occurs. |
| 🔴 OI-R: **OI-R at 58,000** is the CE maximum OI wall for the monthly expiry — at 3,286 pts above yesterday's close, it is entirely irrelevant for today's intraday gap-up action and should not be used as a target; its structural significance is that it confirms BankNifty has enormous headroom before option-writer resistance becomes a ceiling, meaning intraday longs from today's gap-up can be held with confidence until the Camarilla and Traditional levels (H3 54,940.16 through R2 55,581.17) are hit. CE writers at 58,000 are so far out of the money that they add zero short-gamma pressure to today's price action. | 🟢 OI-S: **OI-S at 54,000** is the PE maximum OI wall — critically, at only 714 pts below yesterday's close of 54,714.10, this level is well within the intraday range implied by the monthly straddle of 1,725.2 pts, meaning in a gap-up scenario where a reversal occurs, 54,000 becomes the PRIMARY downside target and PE monetisation zone; PUT writers here will aggressively sell more PUTs on any approach to 54,000, creating a strong bounce tendency. In a gap-up scenario, OI-S at 54,000 serves as the maximum stop-loss anchor for intraday longs — positions should be stopped out before reaching 54,000. |
⚡ Key Trigger: The primary trigger for BankNifty gap-up is a **first 15-minute candle close above TC 54,781.62** — because the CPR width is Narrow at 0.08%, the Narrow confirmation rule (first 15-min candle) applies, making this the fastest and most decisive trigger of all three indices today; a single 15-minute close above TC 54,781.62 with volume expanding signals that the Trending market structure is resuming to the upside. Failure to hold above TC 54,781.62 on the first 15-minute candle means the gap-up is being faded and the session may revert to range-bound action between BC 54,736.62 and H3 54,940.16 until a fresh directional trigger emerges from the second candle.
▼ Lower Open (Gap Down) — Open < Prev Close
▼ Bearish
Open lands: A gap-down open below prev close of 54,714.10 on an Ascending Narrow CPR places the open below BC 54,736.62 for any meaningful gap — a minor gap-down (0.05%–0.25%) opens between 54,578 and 54,688, below the entire CPR band; a significant gap-down (0.25%–0.5%) opens between 54,440 and 54,578, near L3 54,488.04; a large gap-down (>0.5%) opens below 54,440, approaching PDL 54,370.60 and OI-S 54,000.
CPR role: In a gap-down scenario with an Ascending Narrow CPR, the CPR band (BC 54,736.62 – TC 54,781.62) is entirely **overhead resistance** — the fact that the CPR has already ascended above the previous session means any gap-down has moved price below a rising CPR, which is a structurally negative signal; the narrow width (0.08%) means the overhead resistance band is tight and precise, but it also means that any recovery that achieves a 15-minute close back above BC 54,736.62 is a high-conviction reversal signal given the Trending market structure.
Minor Gap (0.05–0.25%) — Structure Dominant
A minor gap-down of 0.05%–0.25% opens BankNifty in the range of approximately **54,578 to 54,688**, below BC 54,736.62 but above L3 54,488.04 — the Camarilla mean-reversion support — creating an immediate test of whether the gap-down is a buy-the-dip opportunity or the start of a trending decline. Since the Narrow CPR (0.08%) with Trending structure typically resolves directionally within the first 15 minutes, this minor gap-down is high-stakes: a **first 15-minute candle close back above BC 54,736.62** signals a gap-fill recovery targeting TC 54,781.62 then H3 54,940.16; failure to reclaim BC 54,736.62 within 15 minutes triggers the bear path targeting L3 54,488.04 and then L4 54,261.97. The gap size (minor) means the CPR structure dominates per the framework, and the Ascending CPR should theoretically provide support — but if BC fails, the structural bull case collapses rapidly given the Narrow CPR's tendency toward decisive one-directional moves.
Significant Gap (0.25–0.5%) — Balanced
A significant gap-down of 0.25%–0.5% opens BankNifty in the range of approximately **54,440 to 54,578**, near Camarilla L3 54,488.04 — a natural bounce zone — and tests the gap-and-structure balanced zone where both bear and bull signals have equal weight per the framework. L3 54,488.04 is the Camarilla mean-reversion support and a significant gap opening right at L3 creates a high-quality 'failure test' setup: if the first 15-minute candle holds above L3 54,488.04 and then price reclaims BC 54,736.62, it is a powerful recovery signal; if L3 fails immediately, the next bear target is L4 54,261.97 and S1 54,325.59, with PUT writers' delta pressure toward OI-S 54,000 becoming the dominant force. The failure-and-resume pattern activates below L3 54,488.04 and accelerates toward PDL 54,370.60, which, if breached, opens the door to OI-S 54,000 as a same-session bear target.
Large Gap (>0.5%) — Gap Direction Dominant
A large gap-down of more than 0.5% opens BankNifty below **54,440** — potentially below PDL 54,370.60 or directly testing OI-S 54,000 — which is an extreme panic scenario where the gap dominates all structure per the framework; given that OI-S 54,000 is only 714 pts below yesterday's close, a large gap-down of more than 1.3% could open AT the primary PE OI wall, creating a massive bounce probability from PUT writer hedging. Without VIX data, the panic-vs-institutional-accumulation determination depends on price action: if the open is at or below 54,000 and the first 15-minute candle shows a long lower wick (hammer formation) on above-average volume, the straddle monetisation opportunity (PUT selling at 54,000) and institutional buying create a V-reversal setup targeting BC 54,736.62. Recovery levels are BC 54,736.62 (CPR reclaim) and TC 54,781.62 (full bull recovery); the abort level for any recovery trade is a 15-minute close back below 54,000.
|
▲ Upside Path → OI-R Recovery upside path: **BC 54,736.62** (first recovery trigger on 15-min close above — confirms absorption of gap sellers) → **P 54,759.12** (pivot — momentum confirmation) → **TC 54,781.62** (top of CPR — full CPR reclaim, bull structure restored) → **H3 54,940.16** (Camarilla mean-reversion resistance — first partial, book 30%) → **R1 55,147.64 / H4 55,166.23** (twin major resistance — second partial, book 30%) → **PDH 55,192.65** (prior session high, trail stop to TC 54,781.62). Genuine recovery vs dead-cat bounce is confirmed by two consecutive 15-minute candles above TC 54,781.62 with expanding volume. |
▼ Downside Path → OI-S Bear extension path: **L3 54,488.04** (Camarilla mean-reversion — first short target, partial cover 30%) → **S1 54,325.59 / L4 54,261.97** (twin bear targets — retail stops cascade, second partial 30%) → **PDL 54,370.60** (prior session low — psychological support) → **L5 53,997.92** (Camarilla extended target — aligns with OI-S 54,000) → **OI-S 54,000** (PE OI wall — primary floor, maximum PUT monetisation zone) → **L6 53,886.86 / S2 53,937.07** (extreme downside — only if OI-S 54,000 fails). The critical acceleration zone is below L3 54,488.04 where retail stops trigger a 200–300 pt move to L4 54,261.97 very quickly. |
| 🔴 OI-R: **OI-R at 58,000** in a gap-down scenario is irrelevant for intraday direction but confirms that CE writers are defending a level 3,286 pts above — their short-gamma positioning means they will BUY futures on any rally (hedging), adding a small tailwind to any recovery attempt; however, at 58,000 being so far away, this OI-R is purely a macro context signal and should not influence intraday decision-making on a gap-down day. The practical implication is that there is no CE writer-induced selling pressure within the intraday range, so any gap-down recovery is not fighting option-writer headwinds. | 🟢 OI-S: **OI-S at 54,000** is the most critical level of the entire gap-down scenario — as the PE maximum OI wall for the monthly expiry, it represents where PUT writers have the largest concentration of short-PUT positions and will sell additional PUTs on any approach, generating a strong bounce force; this level is only 714 pts below yesterday's close, making it a realistic intraday target in a significant or large gap-down scenario, and the bounce from 54,000 — if it occurs — will be sharp and tradeable. The PUT writer hedging dynamic (futures buying as delta hedge when PUTs go deep ITM) means OI-S 54,000 acts as a powerful magnet and reversal zone, and any candle that holds above 54,000 for two consecutive periods should be treated as a high-conviction long entry with tight stop below 53,886.86 (L6). |
⚡ Key Trigger: **Failure to reclaim BC 54,736.62 within the first 15 minutes** (Narrow CPR rule) is the primary bear confirmation for any gap-down — because the CPR is Narrow at 0.08% and the market structure is Trending, the 15-minute window is decisive; failure to reclaim BC means the Trending structure is resolving to the downside and L3 54,488.04 → L4 54,261.97 → OI-S 54,000 is the active bear sequence. The bull trigger is equally precise: a **first 15-minute candle close above BC 54,736.62** signals that gap-down sellers have been absorbed and recovery toward TC 54,781.62 then H3 54,940.16 is underway, making it a high-conviction reversal entry with a tight stop below BC.
◆ Near Flat Open — Open ≈ Prev Close (±0.05%)
◆ Neutral
Open lands: A flat open of ±0.05% places BankNifty in the range of **54,687 to 54,741**, which is between BC 54,736.62 and the previous close of 54,714.10 — specifically, a flat open may be just below BC 54,736.62 or right at BC, meaning the CPR band is immediately relevant as either a support floor (if above BC) or overhead resistance (if below BC) from the very first minute.
CPR role: In a flat-open scenario with an Ascending Narrow CPR, the band (BC 54,736.62 – TC 54,781.62) is a **tight decision zone and compression band** — the Narrow width of 0.08% is the smallest CPR band of all three indices today, creating maximum compression energy; a flat open right at BC 54,736.62 means the market is balanced at the fulcrum of the day's most powerful trending setup, and the first 15-minute candle will resolve this compression with very high directional conviction.
Near Flat (±0.05%)
A flat open in BankNifty's Ascending Narrow CPR (0.08%) is the single highest-probability trending-day setup of all three indices today — the Narrow CPR means compression energy is at maximum, the Ascending structure means multi-session bullish momentum is embedded, and the Trending market structure tag from the data confirms that BankNifty has been resolving directionally rather than oscillating. BC 54,736.62 and TC 54,781.62 are separated by only 45 pts — an exceptionally tight band — meaning any open within ±0.05% of the previous close will place price right at or within this band, and the first 15-minute candle direction IS the trade for the session. The Narrow CPR trending-day probability is the highest of any CPR category (typically 70–75%), meaning once the first 15-minute candle establishes direction, counter-trend attempts are low-probability and high-risk; this is not a day for oscillating between support and resistance but for identifying and riding the primary trend. The bull trigger is a **first 15-minute candle close above TC 54,781.62** (only 22.52 pts above BC — an extremely tight move required), which targets H3 54,940.16 and then R1 55,147.64 / H4 55,166.23; the bear trigger is a **first 15-minute candle close below BC 54,736.62** with follow-through in the next candle, targeting L3 54,488.04 and L4 54,261.97 — the max pain at 56,000 being so far above adds a long-term bullish tilt, but intraday action follows the CPR trigger regardless.
|
▲ Upside Path → OI-R **TC 54,781.62** (Narrow CPR top — 15-min close above triggers long, stop below BC 54,736.62) → **H3 54,940.16** (Camarilla mean-reversion first resistance — first partial profit, book 30–35%; trail stop to TC 54,781.62) → **R1 55,147.64 / H4 55,166.23** (twin first major target — second partial, book another 30–35%; trail stop to H3 54,940.16) → **PDH 55,192.65** (prior session high — psychological resistance) → **H5 55,430.28** (extended Camarilla target — third partial) → **H6 55,541.34 / R2 55,581.17** (extreme upside cluster — near-full exit) → **OI-R 58,000** (distant monthly ceiling). The trend-day dynamic means pullbacks to H3 54,940.16 after initial breakout are buy-the-dip opportunities rather than exit signals. |
▼ Downside Path → OI-S **BC 54,736.62** (Narrow CPR bottom — 15-min close below triggers short, second candle confirmation required) → **L3 54,488.04** (Camarilla mean-reversion support — first short target, partial cover 30–35%; stop above BC 54,736.62) → **S1 54,325.59 / L4 54,261.97** (twin bear target — second partial; trail stop to L3 54,488.04) → **PDL 54,370.60** (prior session low — psychological support, watch for bounce) → **L5 53,997.92 / OI-S 54,000** (primary PE wall and Camarilla extended target — maximum downside and PUT monetisation zone) → **L6 53,886.86 / S2 53,937.07** (extreme downside, full exit). In a trending Narrow CPR bear session, the move from BC to L4 can be fast (30–60 minutes) as retail stops cascade below L3. |
| 🔴 OI-R: **OI-R at 58,000** (CE maximum OI for monthly expiry) is irrelevant for today's flat-open intraday session given it is 3,286 pts above current levels — however, its structural significance in a flat-open scenario is that it confirms BankNifty has enormous upside runway before any option-writer ceiling is hit; CE writers at 58,000 are so far out of the money that their delta-hedging adds zero selling pressure today, meaning any upside breakout above TC 54,781.62 will face only price-action resistance (H3, H4, PDH) without systematic option-writer selling until much higher levels. This is actually bullish context for the flat-open setup — the path above TC 54,781.62 is largely clear of systematic resistance. | 🟢 OI-S: **OI-S at 54,000** (PE maximum OI for monthly expiry) is the critical downside anchor in a flat-open scenario — at 714 pts below the current close, it is the level where the bear scenario terminates with maximum PUT writer defense; PE writers at 54,000 are short-gamma on PUTs and will BUY futures aggressively as price approaches 54,000 to delta-hedge, creating a powerful natural support and bounce zone. In a flat-open session, OI-S 54,000 serves as the maximum risk level for intraday short positions — once price reaches 54,000, the PUT writer hedging dynamic makes continuation of shorts high-risk, and any short position should be covered near or above 54,000 rather than below it. |
⚡ Key Trigger: **First 15-minute candle close above TC 54,781.62** = strong bull bias confirmed, enter longs targeting H3 54,940.16 then R1 55,147.64 / H4 55,166.23, stop below BC 54,736.62; **first 15-minute candle close below BC 54,736.62** with the second candle confirming below = bear bias, enter shorts targeting L3 54,488.04 then L4 54,261.97, stop above TC 54,781.62. TC 54,781.62 is the structural fulcrum because the Ascending Narrow CPR with Trending market structure means the entire session's directional bias is determined by whether price can sustain above the CPR top — the 45-pt narrow band between BC and TC is the compression coil, and the first break determines which direction the spring releases.
SENSEX
Ascending — Medium (Width 0.14%)
▲ Bullish
Market Structure Balanced or transitional | Straddle ATM 72,400 weekly straddle at **886.2 pts** (Call 414.25 + Put 471.95) implies an expected weekly move of ±886 pts, placing the range at approximately **71,514 to 73,286**; the monthly straddle at 2,081.05 pts is more relevant for multi-day swing traders but the weekly straddle's 886-pt range is the primary intraday volatility gauge, slightly wider than Nifty's proportional equivalent, suggesting active premium with modest directional uncertainty. | Max Pain Weekly Max Pain at **72,400** — only 17.53 pts below yesterday's close of 72,382.47 — is essentially at the current market level, meaning option sellers have built their maximum profit zone exactly at the ATM, and price will face strong gravitational pull toward 72,400 throughout Thursday's weekly expiry session; this makes aggressive directional bets above or below 72,400 higher-risk for intraday, as mean-reversion toward max pain is the default force in expiry week. |
Tomorrow's Complete Level Map
OI-R: 74,000 R3: 73,521.29 H6: 73,180.20 H5: 73,072.24 R2: 73,076.61 H4 ▶: 72,817.93 R1: 72,729.54 PDH: 72,631.93 H3 ↩: 72,600.20
TC: 72,333.67 P: 72,284.86 BC: 72,236.05
L3 ↩: 72,164.74 PDL: 71,840.18 S1: 71,937.79 L4 ▶: 71,947.01 S2: 71,493.11 L5: 71,692.70 L6: 71,584.74 S3: 71,146.04 OI-S: 70,000
↩ = Camarilla reversal point | ▶ = Camarilla breakout/breakdown trigger | OI-R/OI-S = Options wall (CE/PE max OI)
▲ Higher Open (Gap Up) — Open > Prev Close
▲ Bullish
Open lands: With an Ascending Medium CPR (BC 72,236.05 / TC 72,333.67 both above prev session CPR levels), a gap-up open above prev close of 72,382.47 places the open above TC 72,333.67 — note that prev close at 72,382.47 is already above TC 72,333.67, so any gap-up from 72,382.47 opens further above TC; a minor gap-up opens between 72,418 and 72,563, a significant gap-up opens between 72,563 and 72,744, and a large gap-up opens above 72,744, approaching PDH 72,631.93 or H3 72,600.20.
CPR role: In a gap-up scenario with prev close already above TC 72,333.67, the CPR band (BC 72,236.05 – TC 72,333.67) acts as a **deep support zone and confirmed launch pad** — the gap-up extends the already-bullish positioning (prev close above TC) even further, meaning the CPR band is comfortably below and would only be tested on a significant reversal; the immediate trading zone is between H3 72,600.20 and PDH 72,631.93 for minor gaps, or directly at R1 72,729.54 for significant gaps.
Minor Gap (0.05–0.25%) — Structure Dominant
A minor gap-up of 0.05%–0.25% from 72,382.47 opens Sensex in the range of approximately **72,418 to 72,563**, which is above TC 72,333.67 (already confirmed bullish) but below H3 72,600.20 (Camarilla mean-reversion zone) — a clean, comfortable opening in the CPR support zone where the Ascending Medium CPR provides a clearly bullish backdrop without immediate overhead pressure. The CPR structure adds full confirmation to this minor gap: with prev close above TC and a further gap-up, two consecutive bullish CPR signals are stacked, raising trend-day probability to the upper end of the Medium CPR range; the first 30-minute candle close above H3 72,600.20 is the specific confirmation trigger per the Medium width rule. Targets post-confirmation are **R1 72,729.54** (Traditional first target — partial profit 40%), then **H4 72,817.93** (Camarilla breakout trigger — second partial 30%), with the stop for the day placed at TC 72,333.67; the weekly max pain at 72,400 being just above the open suggests mild mean-reversion risk, but a confirmed break above H3 72,600.20 overrides this gravitational pull.
Significant Gap (0.25–0.5%) — Balanced
A significant gap-up of 0.25%–0.5% opens Sensex in the range of approximately **72,563 to 72,744**, directly approaching or inside the H3 72,600.20 / PDH 72,631.93 resistance cluster — this is a technically crowded zone where gap-fill risk and continuation risk are in balance per the framework. The Ascending Medium CPR provides structural support below (TC 72,333.67 now 230+ pts below the open), but opening at H3 72,600.20 and PDH 72,631.93 simultaneously means the first 30-minute candle must resolve whether buyers have absorbed all available supply from yesterday's high; if the first 30-minute candle closes above PDH 72,631.93 on above-average volume, the target sequence is R1 72,729.54 → H4 72,817.93, with delta-hedging from CE writers at 73,000 and above adding momentum fuel. Gap-fill risk (back to TC 72,333.67) is the primary downside risk and would be triggered by a 30-minute close below H3 72,600.20, making H3 the specific bull-bear divider for this opening scenario.
Large Gap (>0.5%) — Gap Direction Dominant
A large gap-up of more than 0.5% opens Sensex above **72,744**, potentially above R1 72,729.54 and approaching H4 72,817.93 — the Camarilla breakout trigger — which, if the open is directly above H4, signals extreme momentum but requires two consecutive 30-minute closes above H4 72,817.93 to confirm genuine breakout versus a gap that will fill back toward TC 72,333.67. At this level, gap dominance is total per the framework, and the key risk is the weekly OI-R at 74,000 being 1,256 pts above, which — while distant — represents the ultimate CE writer ceiling and should be the maximum upside target for any large-gap trading strategy. The straddle context (886.2 pts weekly) means a large gap-up of more than 0.5% consumes a significant portion of the weekly expected move on the open itself, raising the probability of mean-reversion and making H4 72,817.93 the maximum realistic intraday target; abort level is a close back below H3 72,600.20.
|
▲ Upside Path → OI-R **H3 72,600.20** (Camarilla mean-reversion — first stall and partial profit zone, book 30–40% on 30-min close above) → **PDH 72,631.93** (prior session high — psychological resistance) → **R1 72,729.54** (Traditional first target — second partial profit, book 30%; trail stop to H3 72,600.20) → **H4 72,817.93** (Camarilla breakout trigger — momentum confirmation) → **R2 73,076.61 / H5 73,072.24** (twin extreme target — near-full exit per Medium rule) → **OI-R 74,000** (CE OI wall — maximum weekly ceiling, not intraday target). Volume must expand at each breakout; declining volume on approach to H4 72,817.93 is an early warning of exhaustion. |
▼ Downside Path → OI-S Failure path from gap-up: **TC 72,333.67** (CPR top loss — structural alarm) → **P 72,284.86** (pivot — momentum failure) → **BC 72,236.05** (full CPR failure, bear signal for the day) → **L3 72,164.74** (Camarilla mean-reversion support — first short target) → **L4 71,947.01 / S1 71,937.79** (twin bear target — retail stops cascade) → **PDL 71,840.18** (prior session low — major support) → **OI-S 70,000** (distant PE wall). A 30-minute close below TC 72,333.67 is the structural alarm that converts the gap-up from a bull setup to a potential bull trap, reversing the day's bias. |
| 🔴 OI-R: **OI-R at 74,000** is the CE maximum OI wall for the weekly expiry — at 1,617.53 pts above yesterday's close and with the weekly straddle implying only 886.2 pts of expected move, OI-R 74,000 is beyond the realistic intraday range and should not be used as a direct target for gap-up trades today. However, CE writers at 74,000 being so far out of the money means they apply zero systematic selling pressure to today's gap-up, which is a bullish structural context — intraday longs face only price-action resistance (H3 72,600.20, PDH 72,631.93, R1 72,729.54, H4 72,817.93) without options-writer headwinds until much higher levels. | 🟢 OI-S: **OI-S at 70,000** is the PE maximum OI wall for the weekly expiry — at 2,382.47 pts below yesterday's close and entirely outside the weekly straddle range, it is irrelevant for today's gap-up intraday action; its structural role is to confirm that the downside floor is firmly established and well below any realistic intraday decline, supporting the bullish gap-up thesis from a risk-perspective by ensuring that systemic downside risk is distant. PUT writers at 70,000 will only become active defenders if price breaks dramatically lower — a scenario incompatible with the gap-up opening. |
⚡ Key Trigger: The key trigger for Sensex gap-up is a **first 30-minute candle close above H3 72,600.20 and PDH 72,631.93** — per the Medium width confirmation rule (30-minute close), this dual level is the structural fulcrum because H3 is the Camarilla mean-reversion zone AND PDH is yesterday's high, and sustaining above both on a 30-minute close confirms that sellers from the prior session's high have been absorbed and fresh buyers are in control. If price opens gap-up but fails to achieve a 30-minute close above H3 72,600.20, the session risks a gap-fill reversion toward TC 72,333.67 and P 72,284.86, with max pain gravity at 72,400 adding further pull toward the CPR band.
▼ Lower Open (Gap Down) — Open < Prev Close
▼ Bearish
Open lands: A gap-down below prev close of 72,382.47 — with TC 72,333.67 being below prev close — means a minor gap-down opens between 72,345 and 72,346, which may still be above TC 72,333.67; a meaningful minor gap-down opens between 72,200 and 72,333 (inside CPR band between BC and TC); a significant gap-down opens below BC 72,236.05 near L3 72,164.74; a large gap-down opens below L3 72,164.74 approaching PDL 71,840.18.
CPR role: In a gap-down scenario with an Ascending Medium CPR, the CPR band (BC 72,236.05 – TC 72,333.67) transitions into **overhead resistance and recovery battleground** — a gap-down that opens inside the CPR band creates an immediate test of whether the Ascending structure provides support (bulls step in at BC 72,236.05) or acts as a trap (the band becomes resistance and price accelerates lower below BC). The critical distinction for Sensex is that prev close was already above TC, meaning a gap-down back inside the CPR band represents a significant reversal of the prior session's bullish positioning.
Minor Gap (0.05–0.25%) — Structure Dominant
A minor gap-down of 0.05%–0.25% from 72,382.47 opens Sensex in the range of approximately **72,201 to 72,346**, which may be inside the CPR band between BC 72,236.05 and TC 72,333.67 or just below BC 72,236.05 — this is a structurally mixed signal because the CPR is Ascending (bullish multi-session trend) but the open has pulled back inside the band, suggesting overnight selling has challenged the bullish structure. Minor gaps inside an Ascending CPR band often resolve with a gap-fill recovery within 30–60 minutes, particularly when the previous close was above TC; the specific test is whether price can close a **first 30-minute candle above TC 72,333.67** (recovery, target H3 72,600.20) or breaks below BC 72,236.05 (bear confirmation, target L3 72,164.74). Max pain at 72,400 adds a gravity pull toward the CPR zone, reinforcing the mean-reversion tendency and reducing the probability of an aggressive directional move in either direction on a minor gap-down.
Significant Gap (0.25–0.5%) — Balanced
A significant gap-down of 0.25%–0.5% opens Sensex in the range of approximately **72,020 to 72,201**, below BC 72,236.05 and potentially near L3 72,164.74 — the Camarilla mean-reversion support zone; at this level, the gap and structure are balanced per the framework, meaning a 30-minute close above BC 72,236.05 is required to signal recovery, while failure confirms the bear path to L4 71,947.01 / S1 71,937.79. The weekly straddle of 886.2 pts implies this gap consumes roughly 20–25% of the weekly expected move on the open, and if the gap is not filled within the first hour, PUT writing pressure at lower strikes adds momentum fuel toward L4 71,947.01 and the PDL 71,840.18. Recovery confirmation is a 30-minute close above BC 72,236.05 followed by a second 30-minute close above TC 72,333.67 per the Medium width confirmation rule — both conditions must be met for a reliable intraday long.
Large Gap (>0.5%) — Gap Direction Dominant
A large gap-down of more than 0.5% opens Sensex below **72,020**, potentially approaching PDL 71,840.18 or S1 71,937.79 / L4 71,947.01 — a panic-zone open where the prior session's entire range is partially or fully retraced before the opening bell. PDL 71,840.18 is the key large-gap anchor: if the gap opens at or below PDL, the primary bear target is L5 71,692.70 and L6 71,584.74 (extreme Camarilla levels) while the recovery thesis requires a first 30-minute close above L4 71,947.01 then BC 72,236.05. The weekly straddle of 886.2 pts means a large gap-down of more than 0.5% has consumed more than 40% of the weekly expected move on the open, making PUT selling (straddle monetisation) an attractive institutional strategy at open prices below 71,840.18 — this PUT selling creates a floor and drives the V-reversal probability above 50% if volume on the open candle is extreme.
|
▲ Upside Path → OI-R Recovery upside path: **BC 72,236.05** (first 30-min close above — confirms absorption of gap sellers) → **P 72,284.86** (pivot — momentum test) → **TC 72,333.67** (second 30-min close above — full CPR recovery, bull structure restored, target H3) → **H3 72,600.20** (Camarilla mean-reversion resistance — first partial profit, book 30–40%) → **PDH 72,631.93** (prior session high — second partial, book 20%) → **R1 72,729.54** (Traditional first target — trail stop to TC 72,333.67). Two consecutive 30-minute candles above TC 72,333.67 with expanding volume are the confirmation threshold for distinguishing genuine recovery from a dead-cat bounce. |
▼ Downside Path → OI-S Bear continuation path: **L3 72,164.74** (Camarilla mean-reversion support — first short target, partial cover 30–35%) → **L4 71,947.01 / S1 71,937.79** (twin bear target — retail stops cascade between these levels, second partial 30%) → **PDL 71,840.18** (prior session low — major psychological support) → **L5 71,692.70** (extended Camarilla target) → **L6 71,584.74 / S2 71,493.11** (extreme downside cluster — near-full exit) → **OI-S 70,000** (PE OI wall — maximum weekly floor). Retail stop-losses below L3 72,164.74 are concentrated and will accelerate the move to L4 71,947.01 within 1–2 candles on a medium-to-large gap-down. |
| 🔴 OI-R: **OI-R at 74,000** in a gap-down scenario serves as a distant overhead ceiling that confirms CE writers will not apply selling pressure within today's intraday range — their hedging activity (buying futures on rallies as delta hedge) would actually provide a mild tailwind to recovery attempts once price climbs above TC 72,333.67, but given that OI-R at 74,000 is 1,617 pts above and the weekly straddle implies only 886 pts of expected move, CE writer flows are inconsequential for today's gap-down direction. The practical implication is that any recovery from a gap-down faces no OI-driven resistance until H4 72,817.93 or R2 73,076.61 — recoveries above the CPR band should be traded with confidence. | 🟢 OI-S: **OI-S at 70,000** is the weekly PE maximum OI wall and primary downside floor — at 2,382 pts below yesterday's close and outside the weekly straddle range, it is not a direct intraday target even in a large gap-down scenario; however, its structural significance is that PE writers at 70,000 have built massive premium reserves and will step in as aggressive buyers of futures if any extreme decline threatens their positions, creating a systemic support that limits catastrophic downside. For intraday traders, OI-S 70,000 confirms that any gap-down is bouncing before reaching this level, reinforcing the recovery bias after any initial gap-down flush. |
⚡ Key Trigger: **Failure to reclaim BC 72,236.05 within the first 30 minutes** is the primary bear confirmation for any gap-down in Sensex — per the Medium width rule (30-minute close), this is the minimum time frame required, and failure to reclaim BC 72,236.05 activates the L3 72,164.74 → L4 71,947.01 / S1 71,937.79 bear path. The bull trigger is a **first 30-minute candle close above BC 72,236.05** (recovery inside CPR, targeting TC 72,333.67) followed by a **second 30-minute candle close above TC 72,333.67** (full CPR recovery, targeting H3 72,600.20); both closes are required per the Medium width rule before treating the recovery as a genuine long trade.
◆ Near Flat Open — Open ≈ Prev Close (±0.05%)
◆ Neutral
Open lands: A flat open of ±0.05% from 72,382.47 places Sensex in the range of **72,346 to 72,418** — above TC 72,333.67 (since prev close 72,382.47 > TC 72,333.67), meaning a flat open keeps price in the same position as yesterday's close: above the CPR top, with the CPR band (BC 72,236.05 – TC 72,333.67) as a support zone below.
CPR role: In a flat-open scenario with prev close above TC 72,333.67, the CPR band acts as a **confirmed support cushion and decision zone** — price is opening in the space between TC 72,333.67 and H3 72,600.20, which is the most bullish flat-open scenario possible for an Ascending Medium CPR because both the prior session's close AND today's open are above the CPR. The zone between TC 72,333.67 and the flat-open range (72,346–72,418) is a **compression band** where the first 30-minute candle will determine whether the bullish CPR structure launches a trending move higher or a reversion begins.
Near Flat (±0.05%)
A flat open in Sensex's Ascending Medium CPR (0.14%) is a high-quality setup because prev close is already above TC 72,333.67, meaning the market enters the session in bullish CPR territory; the flat open maintains this advantage and creates a compressed starting zone between TC 72,333.67 and H3 72,600.20. The CPR Medium width (0.14%) means trend-day probability is elevated but not as extreme as BankNifty's Narrow setup — traders should use the full 30-minute window to assess the first candle before committing directionally. TC 72,333.67 is the absolute bull-bear divider for the session: price is opening above it in a flat scenario, meaning bulls have structural control, and the bear trigger (close below TC then below BC 72,236.05) requires a double confirmation step — first losing TC, then losing BC — before the bearish bias is established; this two-step bear trigger (vs one-step bull trigger above H3 72,600.20) makes the flat-open scenario slightly asymmetrically bullish. The bull trigger is a **first 30-minute close above H3 72,600.20** (Camarilla mean-reversion, 218 pts above the open) targeting R1 72,729.54 and H4 72,817.93; the bear trigger is a **first 30-minute close below TC 72,333.67** followed by a second 30-minute close below BC 72,236.05 targeting L3 72,164.74 and L4 71,947.01; max pain at 72,400 (essentially at the open) creates a gravitational center for the first 30–60 minutes that may delay directional conviction.
|
▲ Upside Path → OI-R **H3 72,600.20** (Camarilla mean-reversion — 30-min close above triggers long; first partial profit zone, book 35–40%; trail stop to TC 72,333.67) → **PDH 72,631.93** (prior session high — psychological resistance, maintain trailing stop) → **R1 72,729.54** (Traditional first target — second partial profit, book 25–30%; trail stop to H3 72,600.20) → **H4 72,817.93** (Camarilla breakout trigger — momentum confirmation, third partial) → **R2 73,076.61 / H5 73,072.24** (twin extreme resistance cluster — near-full exit per Medium rule, do not trail beyond) → **OI-R 74,000** (CE OI wall — maximum weekly ceiling). Volume must be above average at each level to distinguish genuine trending from a low-conviction grind. |
▼ Downside Path → OI-S **TC 72,333.67** (first bear signal on 30-min close below — switch to cautious) → **P 72,284.86** (pivot — momentum deterioration) → **BC 72,236.05** (second bear confirmation on 30-min close below — bear thesis activated) → **L3 72,164.74** (Camarilla mean-reversion support — first short target, partial cover 35%; trail short stop to BC 72,236.05) → **L4 71,947.01 / S1 71,937.79** (twin bear target — second partial cover, book 30%) → **PDL 71,840.18** (prior session low — major structural support) → **L5 71,692.70 / L6 71,584.74** (extended Camarilla targets) → **OI-S 70,000** (PE OI wall — maximum weekly floor). The two-step confirmation rule (TC then BC) for the bear side in a flat-open scenario above TC reduces false trigger risk significantly. |
| 🔴 OI-R: **OI-R at 74,000** (CE maximum OI for weekly expiry) is the primary ceiling for any bullish extension in a flat-open scenario — at 1,617.53 pts above the current close and beyond the weekly straddle range of 886.2 pts, it is not a direct intraday target; however, CE writers at 74,000 are so far out of the money that their delta-hedging flows add a persistent mild buying force to futures (as they hedge their short-call positions by being long futures), which structurally benefits the bullish flat-open setup by providing a non-price-action tailwind to any early upside move. The practical implication is that intraday longs above TC 72,333.67 in a flat-open session have OI structure working in their favor up to at least R2 73,076.61 before any meaningful CE writer resistance is encountered. | 🟢 OI-S: **OI-S at 70,000** (PE maximum OI for weekly expiry) is the primary downside anchor in a flat-open scenario — at 2,382 pts below current levels and outside the weekly straddle range, it is not a direct intraday consideration; however, its structural role is to confirm that the downside is firmly bounded by massive PUT writer interest, and any gap-down or intraday breakdown below BC 72,236.05 will trigger incremental PUT selling (and thus futures buying as delta hedge) from PE writers progressively as price declines, creating a series of natural support points well before 70,000 is tested. In a flat-open session, OI-S 70,000 reinforces the asymmetric risk of shorting Sensex near current levels — the PUT writer community will defend the downside vigorously, making long-bias trades statistically superior risk-reward setups compared to outright shorts below TC. |
⚡ Key Trigger: **First 30-minute candle close above H3 72,600.20** = strong bull confirmation, enter longs targeting R1 72,729.54 and H4 72,817.93, stop below TC 72,333.67; **first 30-minute candle close below TC 72,333.67** followed by a second 30-minute candle close below BC 72,236.05 = bear bias confirmed, enter shorts targeting L3 72,164.74 and L4 71,947.01, stop above TC 72,333.67. TC 72,333.67 is the structural fulcrum because it is the CPR top of an Ascending band — sustaining above it in a flat-open session confirms that the multi-session bull trend is intact, while closing below it on a flat open is an early-warning signal that the upward CPR migration is stalling and sellers are gaining control for the session.
📊 VIX Insight: India VIX data is unavailable for the 05 Oct 2026 closing session, which limits precise volatility-regime determination; without VIX confirmation, traders must rely on CPR width, straddle pricing, and OI positioning to gauge expected move size. The moderate gains across all three indices (+0.48% to +0.66%) without a VIX spike suggest the market is not in an elevated-fear environment, and the combined straddle premiums (Nifty weekly 153.65 pts, Sensex weekly 886.2 pts, BankNifty monthly 1,725.2 pts) imply reasonable but not extreme premium, consistent with a transitional-to-bullish regime entering 06 Oct. Traders should use straddle ranges as the primary expected-move proxy until VIX data is available and treat any sharp opening gap that exceeds straddle range as a candidate for mean-reversion rather than directional extension.
Overall View:
All three indices enter 06 Oct 2026 with Ascending CPRs — BankNifty's Narrow (0.08%) with Trending structure is the highest-conviction setup and the index most likely to trend decisively in the first 15 minutes; Nifty and Sensex, with Ascending Medium CPRs (0.14%) and Balanced/Transitional structures, require the first 30-minute candle for directional confirmation and are more likely to show an early oscillation around their respective TC levels (22,540.31 and 72,333.67) before trending. The dominant cross-index theme is the conflict between bullish daily Ascending CPRs and Descending Wide weekly CPRs — in all three cases the weekly CPR is Descending, meaning the multi-week trend is under pressure even as the short-term daily momentum is positive, and OI-S levels (Nifty 21,500, BankNifty 54,000, Sensex 70,000) are well below current prices confirming structural support, while OI-R levels (Nifty 23,000, BankNifty 58,000, Sensex 74,000) are sufficiently distant to allow intraday upside runs without immediate CE writer resistance. The primary recommendation for 06 Oct is to wait for the first 15 minutes (BankNifty) or 30 minutes (Nifty, Sensex) to confirm direction before initiating directional trades, keeping max pain gravity (Nifty 22,550, BankNifty 56,000 monthly, Sensex 72,400) in mind as the expiry week mean-reversion force that will resist extreme directional moves on either side.
All three indices enter 06 Oct 2026 with Ascending CPRs — BankNifty's Narrow (0.08%) with Trending structure is the highest-conviction setup and the index most likely to trend decisively in the first 15 minutes; Nifty and Sensex, with Ascending Medium CPRs (0.14%) and Balanced/Transitional structures, require the first 30-minute candle for directional confirmation and are more likely to show an early oscillation around their respective TC levels (22,540.31 and 72,333.67) before trending. The dominant cross-index theme is the conflict between bullish daily Ascending CPRs and Descending Wide weekly CPRs — in all three cases the weekly CPR is Descending, meaning the multi-week trend is under pressure even as the short-term daily momentum is positive, and OI-S levels (Nifty 21,500, BankNifty 54,000, Sensex 70,000) are well below current prices confirming structural support, while OI-R levels (Nifty 23,000, BankNifty 58,000, Sensex 74,000) are sufficiently distant to allow intraday upside runs without immediate CE writer resistance. The primary recommendation for 06 Oct is to wait for the first 15 minutes (BankNifty) or 30 minutes (Nifty, Sensex) to confirm direction before initiating directional trades, keeping max pain gravity (Nifty 22,550, BankNifty 56,000 monthly, Sensex 72,400) in mind as the expiry week mean-reversion force that will resist extreme directional moves on either side.
Disclaimer: KRV Prime provides educational and informational content relating to financial markets. Articles, research, examples, charts, strategies and tools are provided for educational purposes and should not be interpreted as personalised investment advice or a guarantee of financial performance. Markets involve risk, including possible loss of capital. Past performance does not guarantee future results. KRV Prime is not a SEBI Registered Investment Adviser or Research Analyst.