
Index Analysis
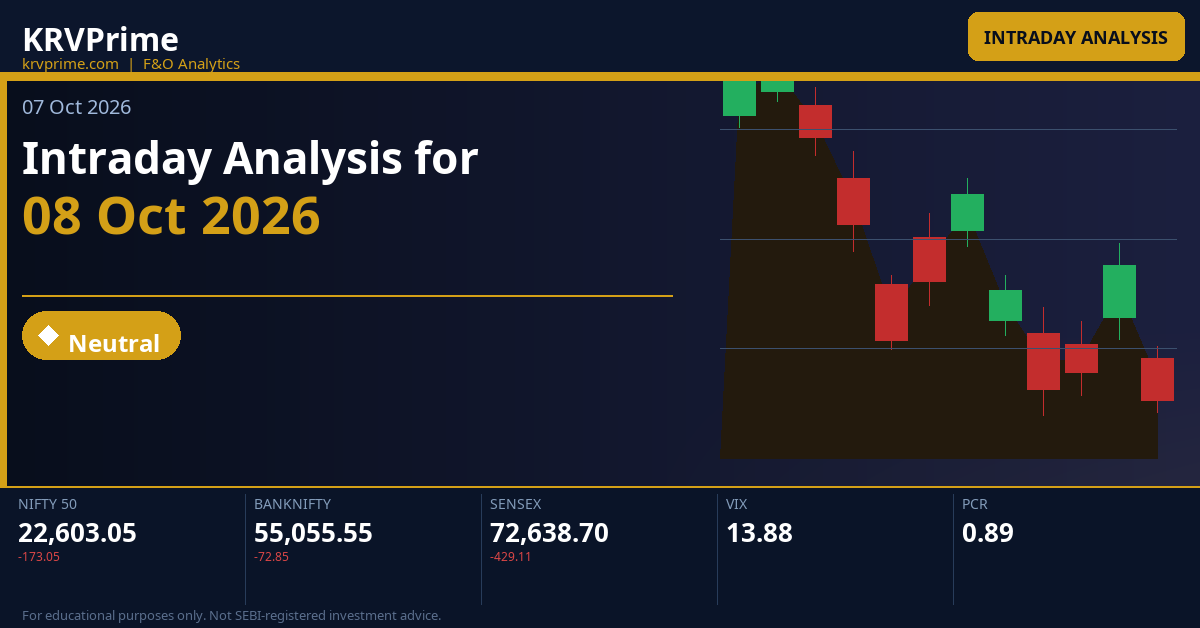
Intraday Analysis for 08 Oct 2026
KRV Prime07 October 202651 min
Educational/Derived AnalysisSource: KRV Prime Market Insights (End-of-Day)As of 07 Oct 2026, 04:06 PM IST
Intraday Analysis for 08 Oct 2026
Markets closed on a soft note on 07 Oct 2026, with NIFTY shedding 0.76% to 22,603.05, SENSEX down 0.59% to 72,638.70, and BANKNIFTY relatively resilient at -0.13% to 55,055.55. India VIX data is unavailable for today's session, which makes CPR band and OI positioning the primary tools for assessing directional conviction; traders must rely on straddle pricing — NIFTY weekly straddle at 279.25 pts — to gauge expected intraday range. With all three indices carrying Descending or Overlapping Narrow CPR structures into 08 Oct, the probability of a trending session is elevated, and the first 15-minute candle direction will be especially critical for session structure.
Key Market Signals — Intraday Setup
All three indices are printing Narrow CPR widths (NIFTY 0.09%, BANKNIFTY 0.08%, SENSEX 0.10%), a powerful multi-index signal that a decisive trending day is likely on 08 Oct — the market is coiled, and whichever direction the first 15-minute candle confirms will define the full intraday session with minimal mean-reversion noise.
Deep Technical Analysis & Levels
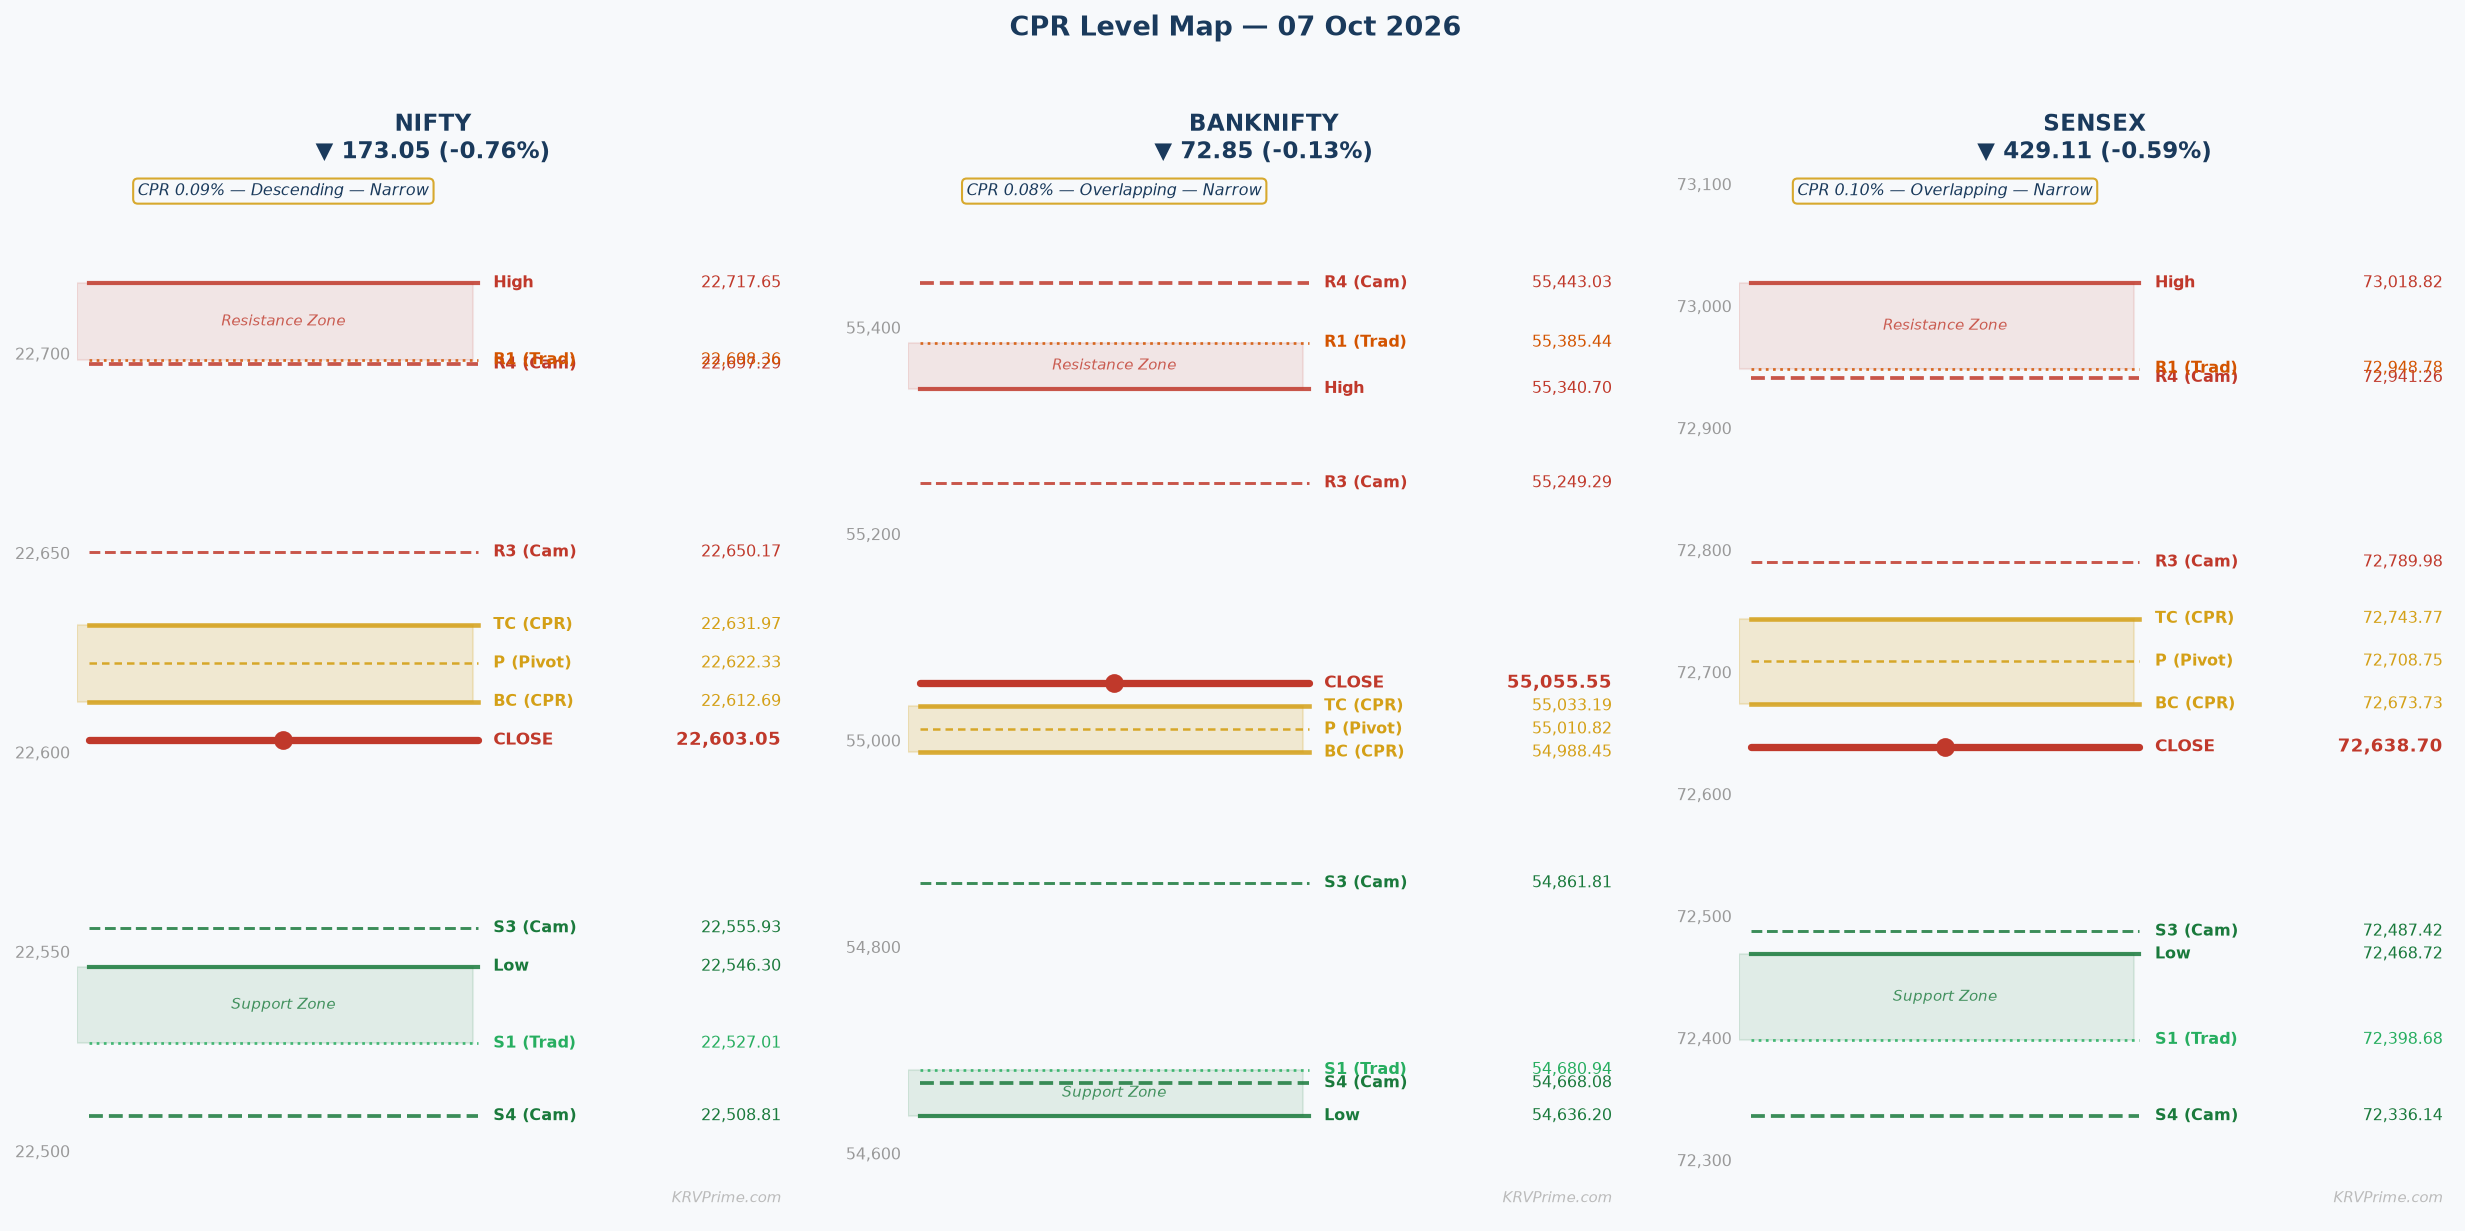
NIFTY
Descending — Narrow (0.09%)
▼ Bearish
Market Structure Trending (up or down trend) | Straddle Weekly ATM 22600 straddle = 124.3 (Call) + 154.95 (Put) = **279.25 pts**. This implies an expected intraday range of approximately 22,323 to 22,879, bracketing the CPR band tightly and aligning with S1 (22,527.01) on the downside and R1 (22,698.36) on the upside as the first standard deviation targets. | Max Pain Weekly Max Pain = **22,650** (expiry 13-Oct-2026). Price closed at 22,603.05, which is 46.95 pts below max pain, suggesting options market gravity will attempt to pin price toward 22,650 into expiry. This favours mild upside pressure intraday toward the CPR band but does NOT override the Descending CPR bearish structure if price cannot reclaim TC at 22,631.97. |
Tomorrow's Complete Level Map
OI-R: 23,000 R3: 22,869.71 H6: 22,774.83 H5: 22,752.33 R2: 22,793.68 H4 ▶: 22,697.29 R1: 22,698.36 PDH: 22,717.65 H3 ↩: 22,650.17
TC: 22,631.97 P: 22,622.33 BC: 22,612.69
L3 ↩: 22,555.93 PDL: 22,546.30 S1: 22,527.01 L4 ▶: 22,508.81 S2: 22,450.98 L5: 22,453.77 L6: 22,431.27 S3: 22,355.66 OI-S: 21,500
↩ = Camarilla reversal point | ▶ = Camarilla breakout/breakdown trigger | OI-R/OI-S = Options wall (CE/PE max OI)
▲ Higher Open (Gap Up) — Open > Prev Close
↕ Conflicted
Open lands: For a Descending CPR, a gap up opens above the entire CPR band (TC = 22,631.97, BC = 22,612.69). Even a minor gap up of 0.1–0.25% from 22,603.05 places the open near or above TC at 22,631.97, which is unusual for a Descending structure and represents a counter-trend gap. A significant or large gap up would push the open above H3 (22,650.17) and toward PDH (22,717.65) or R1 (22,698.36).
CPR role: In a gap-up on a Descending CPR, the CPR band (BC 22,612.69 – TC 22,631.97) flips to act as immediate support below the open. Price gapping above the entire Descending CPR converts what was overhead resistance into a potential launch pad, but only if price sustains above TC 22,631.97 through the first 15-minute candle. Failure to hold TC turns the CPR band into a trap door.
Minor Gap (0.05–0.25%) — Structure Dominant
A minor gap up of 0.05–0.25% from 22,603.05 places the opening price between approximately 22,614 and 22,659 — landing inside or just above the CPR band (BC 22,612.69 to TC 22,631.97) or marginally above it near H3 (22,650.17). The Descending CPR structure creates a structural conflict: the CPR is positioned below yesterday's close, indicating multi-session bearish drift, yet the gap up momentarily lifts price above it. The gap adds a mild bullish lean, but CPR structure retains precedence — the first 15-minute candle close ABOVE TC 22,631.97 is required to validate bullish intent, with the initial target being H3 at 22,650.17 and then R1 at 22,698.36.
Significant Gap (0.25–0.5%) — Balanced
A significant gap up of 0.25–0.5% from 22,603.05 places the open between approximately 22,659 and 22,715 — above H3 (22,650.17) and approaching PDH (22,717.65) and R1 (22,698.36). This level of gap creates meaningful gap-fill risk because price has already bypassed H3, the Camarilla mean-reversion resistance, and is now opening into the H4 (22,697.29) / R1 (22,698.36) confluence zone where supply is structurally expected. Delta-hedging from call writers at these levels (especially near PDH 22,717.65) will add selling pressure, making a sustained breakout difficult without heavy volume. If the first 15-minute candle fails to close above 22,717.65 (PDH), expect a sharp pullback toward TC 22,631.97 and then BC 22,612.69 as gap-fill mechanics dominate.
Large Gap (>0.5%) — Gap Direction Dominant
A large gap up of over 0.5% from 22,603.05 places the open above approximately 22,716, potentially at or above PDH (22,717.65) and approaching R2 (22,793.68) or H5 (22,752.33). At this point, the gap dominant rule overrides the Descending CPR bearish bias, and the session character shifts to a potential momentum chase on the upside. However, with the weekly straddle pricing a total move of only 279.25 pts and OI resistance at 23,000 still 280+ pts away, a large gap up exhausts a significant portion of the expected move before the open, making extension above PDH increasingly difficult. The key abort level for longs is a gap-fill back to TC 22,631.97; if price cannot reclaim PDH 22,717.65 after retesting it, the day risks becoming a gap-and-trap scenario with a close below the CPR band.
|
▲ Upside Path → OI-R **H3 (22,650.17) → H4/R1 cluster (22,697.29 / 22,698.36) → H5 (22,752.33) → H6 (22,774.83) → R2 (22,793.68) → OI-R (23,000)**: H3 at 22,650.17 is the Camarilla mean-reversion first stall zone, so price must close a 15-minute candle above it to confirm genuine upside momentum rather than a gap-and-fade. The H4/R1 cluster at 22,697.29 / 22,698.36 is the primary target for the session and represents a natural partial-profit zone; only a sustained close above PDH 22,717.65 with volume opens the path toward H5 (22,752.33) and R2 (22,793.68), with OI-R at 23,000 as the distant ceiling where CE writing will completely cap upside. |
▼ Downside Path → OI-S **Failure at TC 22,631.97 → P 22,622.33 → BC 22,612.69 → L3 22,555.93 → PDL 22,546.30 → S1 22,527.01 → L4 22,508.81 → OI-S 21,500**: A first 15-minute candle that closes below TC 22,631.97 on a gap-up day is a powerful reversal signal — the market has rejected the higher open and the Descending CPR structure reasserts its bearish dominance. Loss of BC at 22,612.69 shifts the session structure fully bearish, targeting L3 at 22,555.93 first, then PDL at 22,546.30 and S1 at 22,527.01, with L4 at 22,508.81 as the secondary downside target; OI-S at 21,500 is a distant reference floor for extreme bear scenarios only. |
| 🔴 OI-R: OI Resistance at **23,000** (CE max OI for weekly expiry) acts as the ultimate upside ceiling for 08 Oct's session — call writers have positioned their maximum exposure at this strike, meaning every point above 22,900 brings increasing gamma-hedging selling pressure from market makers. In a gap-up scenario, 23,000 is academically the target but realistically 280+ pts from the close, making the H4/R1 cluster at 22,697–22,698 the practical session resistance ceiling and 23,000 the expiry-week gravitational cap rather than an intraday target. | 🟢 OI-S: OI Support at **21,500** (PE max OI for weekly expiry) is structurally significant as the floor where put writers have positioned maximum bets, indicating that institutions consider sub-21,500 an extremely low probability event for this expiry. In a gap-up scenario, 21,500 is not a relevant intraday level but acts as a broad safety net confirming that deep downside is put-writer protected — meaningful only if price breaks below L4 (22,508.81) and S2 (22,450.98) in an extreme bear sequence. |
⚡ Key Trigger: The primary bull trigger for a gap-up scenario is a **first 15-minute candle close above TC 22,631.97** on above-average volume — this is the structural fulcrum because TC is the upper boundary of the Descending CPR, and a confirmed close above it means price has re-entered bullish CPR control. If price gaps up but the first 15-minute candle closes BELOW TC 22,631.97, it signals institutional rejection and the CPR band switches to overhead resistance, initiating a bearish trend toward L3 (22,555.93) and PDL (22,546.30).
▼ Lower Open (Gap Down) — Open < Prev Close
▼ Bearish
Open lands: For a Descending CPR, a gap down confirms the bearish structure — the CPR (BC 22,612.69 – TC 22,631.97) sits entirely above yesterday's close (22,603.05) and now sits further above the gap-down open. A minor gap down of 0.05–0.25% places the open between approximately 22,547 and 22,592, below BC (22,612.69) and near PDL (22,546.30) and L3 (22,555.93). A significant or large gap down pushes the open below S1 (22,527.01), L4 (22,508.81), or lower.
CPR role: In a gap-down on a Descending CPR, the CPR band (BC 22,612.69 – TC 22,631.97) becomes entrenched overhead resistance. The CPR band was already below yesterday's price, confirming two-session bearish drift; now with price gapping below even the previous close, the CPR acts as a firm overhead ceiling that any recovery rally must first attempt to crack. The band will likely trigger fresh selling from short-sellers who use it as a re-entry reference.
Minor Gap (0.05–0.25%) — Structure Dominant
A minor gap down of 0.05–0.25% from 22,603.05 places the open between approximately 22,547 and 22,592 — near PDL (22,546.30) and the L3 Camarilla level (22,555.93), with BC (22,612.69) sitting 20–65 pts overhead as resistance. The gap-fill probability for a minor gap in the first 30–60 minutes is moderate, but the Descending CPR structure strongly discourages recovery — any bounce toward BC 22,612.69 should be treated as a selling opportunity rather than a reversal signal. The primary bearish target for the day is L3 at 22,555.93 first, followed by S1 at 22,527.01 and L4 at 22,508.81 if selling pressure sustains.
Significant Gap (0.25–0.5%) — Balanced
A significant gap down of 0.25–0.5% from 22,603.05 places the open between approximately 22,490 and 22,547 — below L3 (22,555.93), near or below S1 (22,527.01), and approaching L4 (22,508.81). At this level, the weekly OI support at 21,500 remains distant, but the L4 (22,508.81) / S1 (22,527.01) zone becomes the immediate battle ground for bulls attempting recovery versus bears resuming selling. A 30-minute candle close below S1 (22,527.01) confirms the failure-and-resume bear pattern, targeting L4 (22,508.81) and S2 (22,450.98); put writers at lower strikes will also be marking positions to profit, adding structural pressure. Recovery above BC (22,612.69) within 30 minutes is the only signal that aborts the bearish thesis and initiates a gap-fill bounce toward P (22,622.33) and TC (22,631.97).
Large Gap (>0.5%) — Gap Direction Dominant
A large gap down of over 0.5% from 22,603.05 places the open below approximately 22,490, breaching L4 (22,508.81) and approaching S2 (22,450.98) / L5 (22,453.77) territory. This is a panic-gap scenario where the gap dominant rule overrides all CPR structure — retail stop-losses below PDL (22,546.30) and S1 (22,527.01) will have already triggered, exacerbating the move. The straddle of 279.25 pts is now largely consumed by the open itself, meaning straddle sellers look to monetise quickly; the immediate targets are L5 (22,453.77) and S2 (22,450.98), with L6 (22,431.27) as an extended bear target. Recovery is only plausible if price reclaims L4 (22,508.81) within 30 minutes — a sign of aggressive buying absorbing the supply.
|
▲ Upside Path → OI-R **BC 22,612.69 → P 22,622.33 → TC 22,631.97 → H3 22,650.17 → OI-R 23,000**: A genuine recovery requires a first 15-minute close above BC (22,612.69) with volume confirmation, then reclaiming P (22,622.33) and TC (22,631.97) to neutralise the Descending CPR bearish signal — only a sustained hold above TC (22,631.97) with two 30-minute closes shifts the day to a recovery mode targeting H3 (22,650.17) and then R1 (22,698.36). Without volume confirmation, any bounce to BC or P should be treated as a dead-cat bounce and a fresh shorting opportunity. |
▼ Downside Path → OI-S **L3 22,555.93 → PDL 22,546.30 → S1 22,527.01 → L4 22,508.81 → S2 22,450.98 → L5 22,453.77 → L6 22,431.27 → OI-S 21,500**: L3 at 22,555.93 is the Camarilla first stall zone and will attract initial buying interest, but retail stop-losses clustered below PDL (22,546.30) will accelerate the move to S1 (22,527.01) and L4 (22,508.81) if L3 breaks. L4 at 22,508.81 is the Camarilla breakdown trigger — a 15-minute candle close below it unlocks L5 (22,453.77) and S2 (22,450.98) as the next cluster, with OI-S at 21,500 as the far-floor where put writers would begin aggressive covering. |
| 🔴 OI-R: OI Resistance at **23,000** in a gap-down scenario is the distant ceiling that reinforces the bearish macro backdrop — CE writers at 23,000 are not at risk of being tested intraday, but their presence keeps the recovery potential structurally capped. The more relevant near-term overhead is the CPR band itself (BC 22,612.69 – TC 22,631.97), which functions as the proxy OI wall for the session; shorts defending the CPR band at these levels will fade any recovery rally aggressively. | 🟢 OI-S: OI Support at **21,500** (PE max OI weekly) is the primary bear target zone where put writers have built their maximum positions — reaching 21,500 would trigger massive put monetisation and a sharp short-covering rally. In a moderate gap-down scenario, 21,500 is not a realistic intraday target, but it represents the floor of institutional comfort; any sustained break below L4 (22,508.81) and S2 (22,450.98) would begin to pressure this put-base, potentially triggering early defensive covering from put sellers who would then add to upside pressure. |
⚡ Key Trigger: The primary bear confirmation is **failure to reclaim BC 22,612.69 within the first 30 minutes** — if the opening gap-down session sees a recovery attempt that stalls below BC, it signals that overhead CPR resistance is intact and the downtrend is resuming. Conversely, the bull trigger is a **first 15-minute candle close above BC 22,612.69** with strong volume, which would initiate a gap-fill recovery rally toward P (22,622.33) and TC (22,631.97), but even then, the Descending CPR structure means TC is the maximum recovery target before fresh selling emerges.
◆ Near Flat Open — Open ≈ Prev Close (±0.05%)
◆ Neutral
Open lands: A ±0.05% flat open from 22,603.05 places the open between approximately 22,592 and 22,614 — below or just inside the lower boundary of the Descending CPR band (BC 22,612.69). Per the Descending CPR framework, a flat open lands at or near TC, but since TC (22,631.97) is 28.92 pts above the close, a true flat open (within ±0.05%) lands BELOW BC (22,612.69), meaning price opens below the entire Descending CPR band, confirming the bearish structure without requiring a gap.
CPR role: The CPR band (BC 22,612.69 – TC 22,631.97) acts as a **decision zone and overhead resistance** in the flat-open scenario — with price opening just below BC, the entire CPR band is sitting above as a ceiling. This is a classic Descending CPR flat-open setup: the market has two-session bearish drift confirmed, and a flat open below BC creates a 'trade the break' setup where the CPR is the fence separating bulls from bears.
Near Flat (±0.05%)
A flat open near 22,603.05 on a Descending Narrow CPR is one of the highest-information setups available for intraday traders — the fact that the CPR (BC 22,612.69 – TC 22,631.97) sits fully above the open means the first 15-minute candle is not merely informational but IS the trade signal. The CPR band's width of only 0.09% (19.28 pts) concentrates the market's decision into an extraordinarily tight range: a close above TC at 22,631.97 shifts the session to bullish and targets H3 (22,650.17) and R1 (22,698.36), while a close below BC at 22,612.69 — where price is already positioned flat — confirms the bear trend and targets L3 (22,555.93) and PDL (22,546.30). The Narrow CPR width below 0.10% creates a very high probability of a trending day: statistically, price cannot oscillate inside a 19-pt band for an extended period without institutional orders forcing a directional break. Both the weekly Max Pain at 22,650 (pulling slightly above, toward H3) and the Descending CPR structure (pushing below) create a genuine tug-of-war, making the 15-minute candle the cleanest signal — bull trigger: sustained close above TC 22,631.97 targeting H3 (22,650.17) → R1/H4 (22,697–22,698); bear trigger: any sustained trading below BC 22,612.69 targets L3 (22,555.93) → S1 (22,527.01) → L4 (22,508.81).
|
▲ Upside Path → OI-R **TC 22,631.97 → H3 22,650.17 → H4/R1 cluster 22,697.29 / 22,698.36 → H5 22,752.33 → R2 22,793.68 → OI-R 23,000**: A first 15-minute close above TC (22,631.97) initiates the bull path, with H3 (22,650.17) as the Camarilla mean-reversion stall zone where a partial profit makes sense; sustained momentum above H3 with volume targets the H4/R1 confluence at 22,697–22,698 as the primary session high target — this cluster is also near PDH (22,717.65), creating a natural zone for profit-taking. Beyond PDH, H5 (22,752.33) and R2 (22,793.68) become accessible only in a strong trending bull day, with OI-R at 23,000 as the expiry-week ceiling. |
▼ Downside Path → OI-S **BC 22,612.69 → L3 22,555.93 → PDL 22,546.30 → S1 22,527.01 → L4 22,508.81 → S2/L5 cluster 22,450.98 / 22,453.77 → OI-S 21,500**: Since price is already below BC in a flat open, the Descending CPR bear path requires no special trigger to initiate — the first 15-minute candle confirming below BC accelerates selling toward L3 (22,555.93), which is the Camarilla mean-reversion stall zone where initial longs will defend. A break below PDL (22,546.30) is particularly significant as it signals fresh session lows and flushes out yesterday's low-holders, targeting S1 (22,527.01) and L4 (22,508.81); the S2/L5 cluster at 22,450.98 / 22,453.77 is the secondary downside objective, with OI-S at 21,500 as the weekly put base that must not be breached. |
| 🔴 OI-R: OI Resistance at **23,000** (CE max OI, weekly) functions as the macro ceiling that confirms why call writers are comfortably positioned above — in a flat-open scenario, 23,000 is 397 pts above the CPR band, making it an expiry-week structural cap rather than an intraday target. The practical effect is that CE writing at 23,000 caps any recovery momentum well before that strike, as market makers begin delta-hedging (selling futures) as price approaches R2 (22,793.68) and R3 (22,869.71), making the H4/R1 cluster (22,697–22,698) the realistic upside ceiling for an intraday bull scenario. | 🟢 OI-S: OI Support at **21,500** (PE max OI, weekly) represents the structural floor where put writers have their maximum exposure and will aggressively defend — in a flat-open scenario, 21,500 is 1,103 pts below the CPR, making it irrelevant for direct intraday targeting. Its significance is psychological and risk-management: the existence of this put base means that institutional participants view 21,500 as an extreme-downside scenario for expiry, giving confidence that moves toward L4 (22,508.81) or S2 (22,450.98) will attract aggressive put-seller covering and temporary bounces. |
⚡ Key Trigger: **Bull trigger: First 15-minute candle close above TC 22,631.97** → immediately targets H3 (22,650.17) and then the R1/H4 cluster (22,698.36 / 22,697.29); this level is the structural fulcrum because TC is the top of the Descending CPR, and reclaiming it converts two-session bearish drift into a potential trend reversal — volume must be above the 15-minute average to distinguish from a false breakout. **Bear trigger: First 15-minute candle close (or sustained trading) below BC 22,612.69** → confirms the Descending CPR bearish structure, opening L3 (22,555.93) as the immediate target with L4 (22,508.81) and S1 (22,527.01) as the day's primary downside objectives; flat open below BC already leans bearish, so the bear trigger requires less confirmation than the bull trigger.
BANKNIFTY
Overlapping — Narrow (0.08%)
◆ Neutral
Market Structure Trending (up or down trend) | Straddle Monthly ATM 55100 straddle = 844.0 (Call) + 694.5 (Put) = **1538.5 pts**. This implies a wide expected range of approximately 53,561 to 56,638 for the monthly expiry cycle, but intraday the relevant range anchors to the CPR band (BC 54,988.45 – TC 55,033.19) and the Camarilla H3/L3 band (55,249.29 / 54,861.81) as the first standard deviation intraday move reference. | Max Pain Monthly Max Pain = **55,900** (expiry 27-Oct-2026). BANKNIFTY closed at 55,055.55, which is 844.45 pts below max pain — this is a significant deviation that creates substantial upside gravitational pull over the monthly expiry horizon. For 08 Oct intraday sessions, max pain at 55,900 aligns with the H3 Camarilla (55,249.29) as an intermediate waypoint and the H4 (55,443.03) as the next milestone on the path to 55,900. |
Tomorrow's Complete Level Map
OI-R: 58,000 R3: 56,089.94 H6: 55,765.46 H5: 55,669.32 R2: 55,715.32 H4 ▶: 55,443.03 R1: 55,385.44 PDH: 55,340.70 H3 ↩: 55,249.29
TC: 55,033.19 P: 55,010.82 BC: 54,988.45
L3 ↩: 54,861.81 PDL: 54,636.20 S1: 54,680.94 L4 ▶: 54,668.08 S2: 54,306.32 L5: 54,441.80 L6: 54,345.64 S3: 53,976.44 OI-S: 55,000
↩ = Camarilla reversal point | ▶ = Camarilla breakout/breakdown trigger | OI-R/OI-S = Options wall (CE/PE max OI)
▲ Higher Open (Gap Up) — Open > Prev Close
▲ Bullish
Open lands: BANKNIFTY's CPR is Overlapping Narrow (BC 54,988.45 – TC 55,033.19) with prev close at 55,055.55. Since prev_close (55,055.55) is already ABOVE TC (55,033.19), a gap up open places price even further above the entire CPR band. A minor gap up of 0.05–0.25% from 55,055.55 places the open between approximately 55,083 and 55,193, clearly above TC (55,033.19) and moving toward H3 (55,249.29). A significant or large gap up pushes price toward or beyond H3 (55,249.29), PDH (55,340.70), or R1 (55,385.44).
CPR role: In a gap-up from an already-above-TC position, the CPR band (BC 54,988.45 – TC 55,033.19) functions as a **deep support base** well below the open — the band is acting as a launch pad from the previous session. The Overlapping structure means yesterday's range engulfs the CPR band, and with prev_close already above TC, any gap up further confirms bullish control; the CPR band's role is now to catch any pullback rather than to resist.
Minor Gap (0.05–0.25%) — Structure Dominant
A minor gap up of 0.05–0.25% from 55,055.55 places the open between approximately 55,083 and 55,193 — above TC (55,033.19) but below H3 (55,249.29), meaning price opens in the intermediate zone between CPR support and the first Camarilla resistance. The Overlapping Narrow CPR structure reinforces bullish bias since prev_close was already above TC, and now a gap up confirms two-consecutive-day bullish positioning — structure and gap direction are aligned. The first target is H3 at 55,249.29 (Camarilla mean-reversion zone), confirmed by a first 15-minute candle close above it, with the secondary target being PDH (55,340.70) and R1 (55,385.44).
Significant Gap (0.25–0.5%) — Balanced
A significant gap up of 0.25–0.5% from 55,055.55 places the open between approximately 55,194 and 55,331 — approaching H3 (55,249.29) and potentially touching PDH (55,340.70) at the upper end. Opening at or above H3 (55,249.29) creates an immediate gap-fill risk because H3 is the Camarilla mean-reversion resistance zone and will attract systematic selling from algorithmic players; the delta-hedging flow from call writers in the 55,400–55,500 range will also add overhead pressure. A first 15-minute candle close above PDH (55,340.70) confirms the gap is genuine and targets H4/R1 cluster (55,443.03 / 55,385.44); failure to hold H3 (55,249.29) sends price back toward TC (55,033.19) for a gap-fill attempt.
Large Gap (>0.5%) — Gap Direction Dominant
A large gap up of over 0.5% from 55,055.55 places the open above approximately 55,332, likely at or above PDH (55,340.70) and approaching R1 (55,385.44) or H4 (55,443.03). At this gap size, the gap-dominant rule applies: price has bypassed all intraday CPR resistance and is opening directly into the H4/R1 cluster (55,385–55,443) where call writers are structurally positioned. The monthly straddle of 1,538.5 pts provides significant buffer, and OI-R at 58,000 is 2,668 pts away — extension beyond PDH is possible but requires extremely strong volume. The abort level is PDH (55,340.70): failure to hold it on a retest converts the large gap into a gap-and-trap, targeting TC (55,033.19) and then BC (54,988.45) as profit-taking unwinds.
|
▲ Upside Path → OI-R **H3 55,249.29 → PDH 55,340.70 → R1 55,385.44 → H4 55,443.03 → H5 55,669.32 → R2 55,715.32 → H6 55,765.46 → OI-R 58,000**: H3 (55,249.29) is the first meaningful resistance and partial-profit zone; PDH (55,340.70) is the session high from the previous day and a technical reference for breakout traders. The H4/R1 cluster (55,385–55,443) is the primary session target for a gap-up day, with H5 (55,669.32) accessible only in a strong trending session; OI-R at 58,000 is the monthly expiry CE wall and the ultimate upside ceiling, far above intraday reach for a single session but the multi-session directional target aligned with Max Pain at 55,900. |
▼ Downside Path → OI-S **Failure at H3 55,249.29 → TC 55,033.19 → P 55,010.82 → BC 54,988.45 → OI-S 55,000 → L3 54,861.81 → L4 54,668.08**: A rejection at H3 (55,249.29) in a gap-up scenario sends price back to TC (55,033.19) as the first support level, where bulls will attempt to defend the gap; loss of TC (55,033.19) brings P (55,010.82) and then BC (54,988.45) into play, and critically, OI-S at 55,000 (PE max OI for the month) sits precisely within this zone, making 54,988–55,000 a powerful dual-support cluster. A decisive close below OI-S at 55,000 / BC (54,988.45) is the bear trigger, targeting L3 (54,861.81) and L4 (54,668.08) as the next downside milestones. |
| 🔴 OI-R: OI Resistance at **58,000** (CE max OI, monthly) is the dominant macro ceiling for BANKNIFTY — in a gap-up scenario, this level is 2,668+ pts above the close, making it an expiry-horizon target rather than an intraday level. Its significance is that the entire bull trend has room to run toward 58,000 before hitting structural CE-writer resistance, and for 08 Oct specifically, the H4/R1 cluster (55,385–55,443) is the practical intraday resistance ceiling, representing the first 'local OI wall' before the true CE dominance begins around the 56,000–57,000 strikes. | 🟢 OI-S: OI Support at **55,000** (PE max OI, monthly) is critically important for BANKNIFTY because it sits almost exactly at BC (54,988.45) — the bottom of today's CPR band — creating a powerful dual-support confluence. In a gap-up scenario, this 55,000 / BC (54,988.45) level is the primary abort zone: as long as price holds above it, put writers are comfortably in profit and will continue to provide structural support; a close below 55,000 triggers put unwinding and the beginning of a bearish session where L3 (54,861.81) and L4 (54,668.08) become the downside targets. |
⚡ Key Trigger: The primary bull trigger for BANKNIFTY gap-up is a **first 15-minute candle close above H3 55,249.29** with above-average volume — this confirms that the Camarilla mean-reversion resistance is being broken and institutional buyers are in control, opening the path to H4 (55,443.03) and R1 (55,385.44). If price gaps up but the first 15-minute candle fails to close above H3 (55,249.29) and instead reverses below TC (55,033.19), the signal flips to a gap-and-trap, and the Overlapping CPR's support function is being tested — a close below BC (54,988.45) then becomes the trigger for a full reversal targeting L3 (54,861.81).
▼ Lower Open (Gap Down) — Open < Prev Close
▼ Bearish
Open lands: With prev_close (55,055.55) above TC (55,033.19) for an Overlapping Narrow CPR, a gap down open of 0.05–0.25% places the open between approximately 54,917 and 55,027 — bringing price back inside the CPR band (BC 54,988.45 – TC 55,033.19) or just below BC. A significant gap down of 0.25–0.5% places the open between approximately 54,779 and 54,917, below BC (54,988.45) and approaching OI-S (55,000) from below, near L3 (54,861.81). A large gap down opens below L3 (54,861.81), approaching L4 (54,668.08).
CPR role: In a gap-down scenario where prev_close was above TC, the CPR band (BC 54,988.45 – TC 55,033.19) transitions from a **launch pad** to a **battleground overhead resistance zone**. Price gapping from above TC back into or below the CPR band signals that yesterday's bull momentum is being challenged — if price cannot quickly reclaim TC (55,033.19), the CPR becomes a ceiling rather than a floor, consistent with bearish pressure.
Minor Gap (0.05–0.25%) — Structure Dominant
A minor gap down of 0.05–0.25% from 55,055.55 places the open between approximately 54,917 and 55,027 — inside the CPR band (BC 54,988.45 – TC 55,033.19) or just below it, and critically near OI-S at 55,000 (PE max OI, monthly). The gap drops price back through TC (55,033.19) into the CPR decision zone, where the overlapping structure means yesterday's range is being re-tested — this creates an immediate gap-fill impulse as minor gaps inside familiar ranges often recover within 30–60 minutes. The key level is BC (54,988.45) / OI-S (55,000): a hold above BC confirms gap-fill recovery targeting TC (55,033.19) and then H3 (55,249.29), while a close below BC with OI-S at 55,000 breached signals genuine bearish resumption targeting L3 (54,861.81).
Significant Gap (0.25–0.5%) — Balanced
A significant gap down of 0.25–0.5% from 55,055.55 places the open between approximately 54,779 and 54,917 — below BC (54,988.45), below OI-S (55,000), and approaching L3 (54,861.81). This is a structurally important gap because it opens below the monthly PE max OI strike of 55,000, which is a significant bearish signal — put writers will be under pressure and delta-hedging by put sellers (buying futures) may provide initial support. The 30-minute reclaim rule applies: a 30-minute candle close back above BC (54,988.45) / OI-S (55,000) aborts the bearish thesis and initiates a recovery toward TC (55,033.19) and H3 (55,249.29); failure to reclaim BC within 30 minutes confirms the gap as genuine and targets L3 (54,861.81) and L4 (54,668.08) for the session.
Large Gap (>0.5%) — Gap Direction Dominant
A large gap down of over 0.5% from 55,055.55 places the open below approximately 54,779, approaching or breaching L3 (54,861.81) and heading toward L4 (54,668.08) / PDL (54,636.20). This is a panic-gap scenario for BANKNIFTY, especially significant because the monthly straddle (1,538.5 pts) would have its entire downside component (694.5 pts of put premium) rapidly losing time value to intrinsic — put buyers will be taking profits aggressively. The VIX context (unavailable today) would normally amplify this signal; in its absence, the key recovery signal is a 30-minute candle close above L3 (54,861.81), while the primary downside targets remain L4 (54,668.08), PDL (54,636.20), and L5 (54,441.80). OI-S at 55,000 has already been breached in a large gap-down, making it overhead resistance for any recovery attempt.
|
▲ Upside Path → OI-R **BC 54,988.45 / OI-S 55,000 → P 55,010.82 → TC 55,033.19 → H3 55,249.29 → PDH 55,340.70 → R1 55,385.44 → OI-R 58,000**: A recovery first requires reclaiming BC (54,988.45) / OI-S (55,000) — this is the most critical recovery level because it also resolves the put-writer pressure at 55,000. Once TC (55,033.19) is reclaimed on a 15-minute close, the session normalises toward H3 (55,249.29) and PDH (55,340.70) as the primary bull targets; only a sustained close above PDH (55,340.70) with volume opens the path toward H4 (55,443.03) and OI-R at 58,000 over the broader expiry horizon. |
▼ Downside Path → OI-S **L3 54,861.81 → PDL 54,636.20 → L4 54,668.08 → S1 54,680.94 → L5 54,441.80 → S2 54,306.32 → L6 54,345.64 → S3 53,976.44**: L3 (54,861.81) is the Camarilla mean-reversion first stall — initial buying will appear here, but a 15-minute close below it signals momentum selling that targets PDL (54,636.20) and the L4/S1 cluster (54,668.08 / 54,680.94). Below this cluster, L5 (54,441.80) and S2 (54,306.32) form the secondary downside target, with L6 (54,345.64) in close proximity; S3 (53,976.44) is the extreme downside level for a full breakdown session. Stop-losses below PDL (54,636.20) from yesterday's buyers will accelerate this move if L3 breaks. |
| 🔴 OI-R: OI Resistance at **58,000** (CE max OI, monthly) is irrelevant as a direct target in a gap-down session — it sits 2,944 pts above the close and functions as the macro ceiling that confirms bears have enormous room before hitting the CE wall. More immediately relevant is that the CPR band (BC 54,988.45 – TC 55,033.19) acts as a proxy resistance in the gap-down context, with TC (55,033.19) being the primary overhead level that gap-down session shorts will defend as their reference to add to positions. | 🟢 OI-S: OI Support at **55,000** (PE max OI, monthly) is the most critical level in any gap-down scenario for BANKNIFTY — it sits precisely at BC (54,988.45), creating a dual-confluence support that put writers will defend aggressively through futures buying and OTM put buying to protect their written positions. If 55,000 is breached and sustained below, the put-writer community faces losses and begins delta-hedging by selling futures — this 'short gamma' dynamic can accelerate the down move toward L3 (54,861.81) and L4 (54,668.08) rapidly, turning a moderate gap-down into a trending bear session. |
⚡ Key Trigger: **Bear confirmation: Failure to reclaim BC 54,988.45 (OI-S 55,000 zone) within the first 30 minutes** — this is the structural fulcrum because BC at 54,988.45 sits at the exact OI-S strike of 55,000, creating a dual-confirmation bear signal when broken. **Bull recovery trigger: First 15-minute candle close above TC 55,033.19** — this signals that the gap-down was absorbed by institutional buying, the CPR band is being reclaimed, and the session structure reverts to the bullish Overlapping setup with H3 (55,249.29) as the next target.
◆ Near Flat Open — Open ≈ Prev Close (±0.05%)
◆ Neutral
Open lands: A ±0.05% flat open from 55,055.55 places the open between approximately 55,028 and 55,083 — right at or just above TC (55,033.19) and P (55,010.82), inside or barely above the CPR band. Since prev_close (55,055.55) is already above TC (55,033.19), a flat open re-tests TC as support from above, making this a 'defend the TC' setup where bulls must hold 55,033.19 to maintain bullish control.
CPR role: The CPR band (BC 54,988.45 – TC 55,033.19) acts as a **decision zone and launch pad** in the flat-open scenario — with price opening right at TC (55,033.19), the band is acting as support from below. The Overlapping Narrow (0.08%) structure means this is a compressed energy session: market structure is Trending, confirming the first 15-minute candle will set the direction with high follow-through probability.
Near Flat (±0.05%)
A flat open near 55,055.55 on an Overlapping Narrow CPR (0.08%) is a pristine intraday setup because the CPR band (BC 54,988.45 – TC 55,033.19) is sitting just below the open, meaning price is essentially sitting on TC as support — a two-way trigger exists within a 19-pt band. The Narrow width (0.08%) below the 0.10% threshold confirms a high-probability trending day: the market is coiled and the first 15-minute candle's direction will define the session, with minimal mean-reversion noise expected once a directional break occurs. The bullish scenario: a flat open that holds above TC (55,033.19) through the first 15 minutes, then a close above TC confirms bullish control with H3 (55,249.29) as the first target, PDH (55,340.70) and R1 (55,385.44) as the primary session targets, and H4 (55,443.03) as the stretch target — aligned with Monthly Max Pain at 55,900 providing upside gravity. The bearish scenario: a flat open that dips below TC (55,033.19) within the first 15 minutes and then closes below BC (54,988.45) / OI-S (55,000) activates the bear path, because breaching OI-S at 55,000 triggers put-writer delta-hedging and targets L3 (54,861.81) and L4 (54,668.08) — the OI-S / BC dual confluence makes this the most powerful single level to watch on 08 Oct for BANKNIFTY.
|
▲ Upside Path → OI-R **TC 55,033.19 → H3 55,249.29 → PDH 55,340.70 → R1 55,385.44 → H4 55,443.03 → H5 55,669.32 → R2 55,715.32 → OI-R 58,000**: A first 15-minute close above TC (55,033.19) launches the bull path with H3 (55,249.29) as the first significant resistance and partial-profit zone (Camarilla mean-reversion stall); PDH (55,340.70) is the previous session high and a key breakout reference — a 15-minute close above it with volume confirms the trending bull day targeting H4/R1 (55,385–55,443) as the primary session peak. H5 (55,669.32) and R2 (55,715.32) are achievable only in a strong bull session, with OI-R at 58,000 as the monthly expiry ceiling and multi-session ultimate target. |
▼ Downside Path → OI-S **BC 54,988.45 / OI-S 55,000 → L3 54,861.81 → PDL 54,636.20 → L4 54,668.08 → S1 54,680.94 → L5 54,441.80 → S2 54,306.32 → OI-S 55,000 (now overhead)**: A close below BC (54,988.45) breaches OI-S at 55,000, switching the put-writer dynamic from defender to delta-hedger (selling futures), which accelerates the move to L3 (54,861.81) as the first Camarilla downside stall. Below L3, the PDL/L4/S1 cluster (54,636–54,681) is the primary downside target, with L5 (54,441.80) and S2 (54,306.32) as secondary targets in an extended bear session — once 55,000 is broken, it becomes overhead resistance for any recovery attempt. |
| 🔴 OI-R: OI Resistance at **58,000** (CE max OI, monthly) in the flat-open scenario acts as the distant structural ceiling that defines the bull potential for the entire October expiry — for 08 Oct intraday, it confirms there is no CE wall until 58,000, meaning upside toward H4 (55,443.03), H5 (55,669.32), and beyond is structurally unobstructed by CE writers in the near-term strikes. This provides confirmation that any breakout above PDH (55,340.70) on 08 Oct has institutional room to run without hitting a meaningful call-writing ceiling until the 56,000–57,000 range on the monthly series. | 🟢 OI-S: OI Support at **55,000** (PE max OI, monthly) is the single most important level for BANKNIFTY in the flat-open scenario — sitting precisely at BC (54,988.45), it creates a hyper-concentrated support confluence where put writers will defend aggressively. In a flat open, the 55,000 / BC (54,988.45) zone is both the trigger for the bear scenario AND the insurance floor for bulls: as long as price holds above it, put writers are in control and will provide structural support; the moment it breaks on a 15-minute close, the put writer community begins net-selling futures, creating a self-reinforcing bear move toward L3 (54,861.81). |
⚡ Key Trigger: **Bull trigger: First 15-minute candle close above TC 55,033.19** with volume above the 15-minute average, signalling that TC is acting as support and bulls are in control — this opens H3 (55,249.29) immediately and then the PDH/R1/H4 cluster (55,340–55,443) as the session target zone. **Bear trigger: First 15-minute candle close below BC 54,988.45 (OI-S 55,000 zone)** — the dual-confluence nature of BC (54,988.45) and OI-S (55,000) makes this the single most important level for BANKNIFTY on 08 Oct: a close below it signals both CPR breakdown AND options market structural shift, targeting L3 (54,861.81) and L4 (54,668.08) with high probability.
SENSEX
Overlapping — Narrow (0.10%)
◆ Neutral
Market Structure Trending (up or down trend) | Straddle Monthly ATM 72600 straddle = 1019.7 (Call) + 831.4 (Put) = **1851.1 pts**. This implies a wide expected range of approximately 70,749 to 74,451 for the monthly expiry cycle. For 08 Oct intraday, the weekly ATM 72600 straddle = 189.4 (Call) + 288.0 (Put) = **477.4 pts**, implying an intraday range of approximately 72,123 to 73,077 — this weekly straddle range neatly brackets the OI-R at 73,000 on the upside and approaches OI-S at 71,000 on the extended downside. | Max Pain Weekly Max Pain = **72,600** (expiry 08-Oct-2026, TODAY's expiry). SENSEX closed at 72,638.70, which is only 38.70 pts above max pain — this is an extraordinarily tight alignment indicating that the options market is already nearly pinned at max pain. With today being the weekly expiry session, the max pain gravitational pull toward 72,600 will be extremely strong, making the CPR band (BC 72,673.73 – TC 72,743.77) just above max pain the key battleground, and any significant deviation from 72,600 will face strong pin-back pressure from option sellers. |
Tomorrow's Complete Level Map
OI-R: 73,000 R3: 73,498.88 H6: 73,190.09 H5: 73,117.96 R2: 73,258.85 H4 ▶: 72,941.26 R1: 72,948.78 PDH: 73,018.82 H3 ↩: 72,789.98
TC: 72,743.77 P: 72,708.75 BC: 72,673.73
L3 ↩: 72,487.42 PDL: 72,468.72 S1: 72,398.68 L4 ▶: 72,336.14 S2: 72,158.65 L5: 72,159.44 L6: 72,087.31 S3: 71,848.58 OI-S: 71,000
↩ = Camarilla reversal point | ▶ = Camarilla breakout/breakdown trigger | OI-R/OI-S = Options wall (CE/PE max OI)
▲ Higher Open (Gap Up) — Open > Prev Close
↕ Conflicted
Open lands: SENSEX's Overlapping Narrow CPR has BC at 72,673.73 and TC at 72,743.77, with prev_close at 72,638.70 sitting just BELOW BC (72,673.73). A gap up of 0.05–0.25% from 72,638.70 places the open between approximately 72,675 and 72,820 — lifting price from below BC to inside or above the CPR band. A significant gap up (0.25–0.5%) places the open between 72,820 and 73,001, above TC (72,743.77) and approaching OI-R (73,000). A large gap up (>0.5%) opens above OI-R at 73,000.
CPR role: In a gap-up scenario where prev_close was below BC, the CPR band (BC 72,673.73 – TC 72,743.77) transitions from being overhead resistance (as it was when price closed below BC) to acting as a **launch pad / recovery zone**. A gap up that lifts price into or above the CPR band signals that yesterday's breakdown below BC is being reversed — the CPR band acts as a decision zone where the gap-up's validity is tested.
Minor Gap (0.05–0.25%) — Structure Dominant
A minor gap up of 0.05–0.25% from 72,638.70 places the open between approximately 72,675 and 72,820 — lifting price from below BC (72,673.73) to just inside or slightly above the CPR band (BC 72,673.73 – TC 72,743.77). This is a high-information scenario: the minor gap lifts price from a bearish position (below BC) back into the CPR decision zone, and the first 15-minute candle will determine whether the recovery is genuine. A first 15-minute close above TC (72,743.77) validates the recovery and targets H3 (72,789.98) and then R1/H4 cluster (72,948.78 / 72,941.26); failure to close above TC within 15 minutes and a drop back below BC (72,673.73) confirms the gap-up as a fake-out, resuming the bearish path toward L3 (72,487.42) and PDL (72,468.72).
Significant Gap (0.25–0.5%) — Balanced
A significant gap up of 0.25–0.5% from 72,638.70 places the open between approximately 72,820 and 73,001 — above TC (72,743.77) and approaching or at OI-R (73,000). This is a critically important gap level because OI-R at 73,000 (CE max OI for the weekly expiry that expires TODAY, 08-Oct-2026) is not a distant future target but an immediate intraday ceiling — call writers at 73,000 will aggressively delta-hedge by selling futures as price approaches. The gap-fill risk is high: opening near 73,000 on a weekly expiry day with the straddle at 477.4 pts and max pain at 72,600 creates strong downward pinning pressure. A first 15-minute candle close above PDH (73,018.82) is required to confirm genuine breakout; otherwise, expect a sharp reversion toward TC (72,743.77) and the max pain zone at 72,600.
Large Gap (>0.5%) — Gap Direction Dominant
A large gap up of over 0.5% from 72,638.70 places the open above approximately 73,001, breaching OI-R at 73,000 (CE max OI for today's weekly expiry) on the opening tick. This is a gamma-squeeze scenario: call writers at 73,000 are immediately in-the-money, forcing aggressive delta-hedging (buying futures) from market makers who sold those calls — this can create a paradoxical upside acceleration above 73,000 in the opening minutes. However, the weekly max pain at 72,600 and today being expiry day creates the strongest possible pin-back force by 2:30–3:00 PM; the realistic scenario is a gap-and-fade where price touches H4 (72,941.26) to R2 (73,258.85) at the open before collapsing back toward TC (72,743.77) and the 72,600 max pain zone by close.
|
▲ Upside Path → OI-R **BC 72,673.73 → TC 72,743.77 → H3 72,789.98 → H4/R1 cluster 72,941.26 / 72,948.78 → OI-R 73,000 → PDH 73,018.82 → H5 73,117.96 → H6 73,190.09 → R2 73,258.85**: The upside path progresses from CPR reclaim at TC (72,743.77) through H3 (72,789.98), a natural mean-reversion stall zone, then into the powerful H4/R1/OI-R confluence (72,941–73,000) which is the primary ceiling for the session given today's weekly expiry. Only a sustained gamma-squeeze above OI-R (73,000) opens PDH (73,018.82), H5 (73,117.96), and H6 (73,190.09) as secondary targets — these levels align with the monthly straddle's upside range and should be treated as extreme-extension zones requiring exceptional volume confirmation. |
▼ Downside Path → OI-S **Failure at BC 72,673.73 → L3 72,487.42 → PDL 72,468.72 → S1 72,398.68 → L4 72,336.14 → S2/L5 cluster 72,158.65 / 72,159.44 → L6 72,087.31 → OI-S 71,000**: A gap-up that fails to reclaim BC (72,673.73) within the first 15 minutes immediately targets L3 (72,487.42) and PDL (72,468.72), where yesterday's lows are clustered; retail stop-losses below PDL (72,468.72) will accelerate toward S1 (72,398.68) and L4 (72,336.14). The S2/L5 cluster (72,158–72,159) is a powerful support confluence where two Camarilla levels converge, and OI-S at 71,000 is the distant put-writer floor where monthly PE max OI is concentrated. |
| 🔴 OI-R: OI Resistance at **73,000** (CE max OI, weekly — TODAY's expiry) is the most dominant single level for SENSEX on 08 Oct because it is BOTH the OI wall AND the expiry strike that CE writers are defending. In a gap-up scenario, price touching 73,000 intraday will trigger maximum delta-hedging selling from call writers who are near expiry — this creates a self-reinforcing resistance as the gamma at this strike is at its highest (expiry day), meaning every tick above 73,000 forces call sellers to sell more futures, capping the rally with compounding force. Traders should treat 73,000 as an absolute fade level on weekly expiry day unless volume is extraordinarily strong. | 🟢 OI-S: OI Support at **71,000** (PE max OI, weekly) is the structural floor where put writers have their maximum exposure for this week's expiry — in a gap-up scenario, 71,000 is 1,638 pts below the close and functions as the extreme-downside safety net. Its practical significance for a gap-up day is that it confirms the put-writer community considers the week's downside as protected at 71,000, which means any intraday drop toward L3 (72,487.42) or S1 (72,398.68) will attract defensive put-seller buying (futures) as a hedge — providing an indirect support bid on dips. |
⚡ Key Trigger: The primary trigger for SENSEX gap-up on this weekly expiry day is **first 15-minute candle close above TC 72,743.77** confirming CPR reclaim, with the immediate target being H3 (72,789.98) and then OI-R / R1 / H4 cluster (73,000 / 72,948.78 / 72,941.26). Given today is the weekly SENSEX expiry, the secondary and more powerful trigger is whether **price can sustain above OI-R 73,000** for more than one 15-minute candle — CE writers who sold 73,000 calls will defend this level aggressively, and only a gamma-squeeze with enormous volume can cause a sustained break above it, making 73,000 the day's most pivotal single level.
▼ Lower Open (Gap Down) — Open < Prev Close
▼ Bearish
Open lands: With prev_close (72,638.70) already below BC (72,673.73) for an Overlapping Narrow CPR, a gap down opens further below BC, deepening the bearish positioning. A minor gap down of 0.05–0.25% from 72,638.70 places the open between approximately 72,457 and 72,602 — below BC (72,673.73), near PDL (72,468.72), and approaching L3 (72,487.42). A significant or large gap down opens below PDL (72,468.72), approaching L4 (72,336.14) or S1 (72,398.68).
CPR role: In a gap-down from a position already below BC (72,673.73), the CPR band (BC 72,673.73 – TC 72,743.77) becomes **firm overhead resistance** — price has now been below the entire CPR for multiple sessions, and the band sits as a ceiling that any recovery must fight to reclaim. The max pain at 72,600 for today's weekly expiry adds an important nuance: option sellers will try to pull price back toward 72,600 even in a gap-down, creating a potential intraday bounce from the gap-down open toward 72,600 before the session stabilises.
Minor Gap (0.05–0.25%) — Structure Dominant
A minor gap down of 0.05–0.25% from 72,638.70 places the open between approximately 72,457 and 72,602 — below BC (72,673.73) and near or below PDL (72,468.72) and L3 (72,487.42), with BC sitting 71–216 pts overhead as resistance. Today being the weekly expiry for SENSEX (max pain 72,600) creates an unusual dynamic: despite the bearish gap-down, options market forces will attempt to pin price near 72,600 through active market-making, meaning a minor gap-down may see a quick intraday recovery toward 72,600 and then BC (72,673.73). If the first 15-minute candle fails to reclaim 72,600 (max pain), the bearish path toward L3 (72,487.42) and PDL (72,468.72) is confirmed, targeting S1 (72,398.68) as the primary session bear objective.
Significant Gap (0.25–0.5%) — Balanced
A significant gap down of 0.25–0.5% from 72,638.70 places the open between approximately 72,457 and 72,457, near L3 (72,487.42) and approaching S1 (72,398.68) and L4 (72,336.14). Opening at or near L3 (72,487.42) is meaningful because this is the Camarilla mean-reversion zone — initial buyers will appear here, and on a weekly expiry day, option sellers' gamma exposure at lower strikes makes defensive futures buying likely. A 30-minute candle close above L3 (72,487.42) initiates the 30-minute reclaim test for recovery toward PDL (72,468.72) and BC (72,673.73); failure to reclaim L3 within 30 minutes confirms a trending bear session targeting L4 (72,336.14) and S1 (72,398.68), with S2/L5 cluster (72,158–72,159) as the secondary target.
Large Gap (>0.5%) — Gap Direction Dominant
A large gap down of over 0.5% from 72,638.70 places the open below approximately 72,275, breaching S1 (72,398.68) and approaching L4 (72,336.14) or S2 (72,158.65) / L5 (72,159.44). This is a severe gap-down scenario for a weekly expiry day, where put buyers will be aggressively monetising ITM puts while call sellers at OI-R (73,000) will have their premium collapse — the net flow is complex. The weekly straddle of 477.4 pts implies a total range, and a large gap down consuming most of the put side (288.0 pts) creates straddle-seller pressure to quickly fade the move. Key levels to watch: L4 (72,336.14) as the Camarilla breakdown trigger and S2/L5 cluster (72,158–72,159) as the primary extreme downside target; recovery above S1 (72,398.68) within 30 minutes is the only signal for a reversal attempt.
|
▲ Upside Path → OI-R **Max Pain 72,600 → BC 72,673.73 → P 72,708.75 → TC 72,743.77 → H3 72,789.98 → OI-R 73,000**: A recovery first clears max pain at 72,600 (the primary gravitational force on expiry day), then reclaims BC (72,673.73) to restore CPR bullish structure — every level above is progressively more bullish. TC (72,743.77) reclaim confirms the session recovery, with H3 (72,789.98) as the first significant resistance; OI-R at 73,000 is the ultimate ceiling where CE writers at today's expiry will sell calls aggressively, making the H4/R1 cluster (72,941–72,948) the practical maximum upside target for any recovery session. |
▼ Downside Path → OI-S **L3 72,487.42 → PDL 72,468.72 → S1 72,398.68 → L4 72,336.14 → S2/L5 cluster 72,158.65 / 72,159.44 → L6 72,087.31 → OI-S 71,000**: L3 (72,487.42) is the first Camarilla stall — expect temporary buying here, especially on expiry day from put seller covering. A break below PDL (72,468.72) triggers stop-losses from previous session buyers, accelerating toward S1 (72,398.68) and the critical L4 (72,336.14) breakdown trigger. Below L4, the S2/L5 confluence (72,158–72,159) is a dual Camarilla support that should provide a meaningful bounce; OI-S at 71,000 is the monthly put-writer floor and represents the extreme downside boundary for the weekly expiry. |
| 🔴 OI-R: OI Resistance at **73,000** (CE max OI, weekly expiry TODAY) in a gap-down scenario functions as the distant overhead ceiling that confirms shorts have enormous room before facing call-writer competition. On a weekly expiry day, the 73,000 call writers are collecting full premium as the price gaps down away from their strike — they have zero delta-hedge pressure and are simply watching their calls decay, making them indifferent to the downside move. The practical effect is that CE writers at 73,000 provide NO upside support today; all the option-market support comes from PE writers at lower strikes. | 🟢 OI-S: OI Support at **71,000** (PE max OI, weekly) is the critical downside reference for a gap-down session — put writers at 71,000 for the weekly expiry that expires TODAY will be watching the price action carefully but are not under immediate pressure as price is 1,638 pts above their strike. However, the SENSEX month OI-S at 72,500 (PE max OI) is far more relevant for today's intraday session — a close below 72,500 would pressure monthly put writers and trigger defensive buying of futures, creating a natural intraday bounce zone that intraday traders should monitor alongside L4 (72,336.14) as a dual-support confluence. |
⚡ Key Trigger: **Bear confirmation: Failure to reclaim BC 72,673.73 within the first 30 minutes** combined with a first 15-minute candle close below L3 (72,487.42) — this double-confirmation signals that the CPR band is firmly overhead resistance AND the Camarilla support has failed. **Bull recovery: First 15-minute close above max pain 72,600 / BC 72,673.73** — on a weekly expiry day, the max pain level (72,600) is extremely powerful, and a recovery above it signals that option sellers are successfully pinning the market, reversing the gap-down and targeting TC (72,743.77) and H3 (72,789.98).
◆ Near Flat Open — Open ≈ Prev Close (±0.05%)
◆ Neutral
Open lands: A ±0.05% flat open from 72,638.70 places the open between approximately 72,602 and 72,675 — below BC (72,673.73) or just at BC at the upper end. Since prev_close (72,638.70) is below BC (72,673.73) for this Overlapping Narrow CPR, a flat open keeps price below the CPR band, maintaining the bearish structural positioning from the previous session. The flat open is precisely at or near the weekly max pain level of 72,600, creating a powerful pin scenario.
CPR role: The CPR band (BC 72,673.73 – TC 72,743.77) acts as a **decision zone overhead** — with price opening just below BC, the band is acting as resistance above, consistent with the two-session positioning below BC. Today being the SENSEX weekly expiry day (max pain 72,600) means the CPR band and max pain are simultaneously acting as reference points, making the 72,600–72,673 zone a highly concentrated battleground for options expiry and CPR technical structure.
Near Flat (±0.05%)
A flat open near 72,638.70 on a SENSEX weekly expiry day (08-Oct-2026) where max pain is exactly 72,600 creates a uniquely powerful setup: the market opens within 38.70 pts of max pain, which means option sellers from both call and put sides will aggressively work to pin the index near 72,600 through the 3:30 PM close. The Overlapping Narrow CPR (0.10% width, BC 72,673.73 – TC 72,743.77) sits just above the flat open, meaning BC (72,673.73) is the first decisive level — a flat open that reclaims BC on the first 15-minute candle initiates a bull recovery targeting TC (72,743.77) and H3 (72,789.98), while a flat open that dips below 72,600 / max pain activates the bearish Camarilla path toward L3 (72,487.42) and PDL (72,468.72). With the weekly straddle at 477.4 pts and price opening at max pain (72,600), the expected intraday range is 72,123 to 73,077 — the OI-R at 73,000 sits precisely at the upper end of the straddle range, confirming it as the session ceiling. The narrow CPR width (0.10%) confirms a trending day is highly probable; given today's weekly expiry context, the most likely scenario is a directional break before noon followed by a mean-reversion back to the 72,600 max pain zone by close — making first-half trend trades the priority and second-half mean-reversion the secondary strategy.
|
▲ Upside Path → OI-R **BC 72,673.73 → P 72,708.75 → TC 72,743.77 → H3 72,789.98 → H4/R1 cluster 72,941.26 / 72,948.78 → OI-R 73,000 → PDH 73,018.82**: A first 15-minute close above BC (72,673.73) confirms CPR reclaim with P (72,708.75) as the midpoint pivot and TC (72,743.77) as the upper boundary that triggers full bull momentum on a confirmed close; H3 (72,789.98) is the Camarilla first-stall zone and partial-profit reference, with the powerful H4/R1/OI-R cluster (72,941–73,000) as the primary session target. On today's weekly expiry, CE writing at 73,000 is at maximum gamma — a touch of 73,000 will be strongly faded, making PDH (73,018.82) the extreme extension only achievable if options market structure shifts dramatically. |
▼ Downside Path → OI-S **L3 72,487.42 → PDL 72,468.72 → S1 72,398.68 → L4 72,336.14 → S2/L5 cluster 72,158.65 / 72,159.44 → L6 72,087.31 → OI-S 71,000**: A close below max pain (72,600) and L3 (72,487.42) confirms the bear path with PDL (72,468.72) as the immediate target where yesterday's lows will attract initial buying. Stop-loss triggers below PDL (72,468.72) accelerate the move to S1 (72,398.68) and then the Camarilla breakdown trigger L4 (72,336.14); the S2/L5 confluence (72,158–72,159) is a powerful dual-Camarilla support that is typically the maximum intraday bear extension on a weekly expiry day, with OI-S at 71,000 as the weekly put-writer floor and ultimate downside boundary. |
| 🔴 OI-R: OI Resistance at **73,000** (CE max OI, weekly expiry TODAY, 08-Oct-2026) in the flat-open scenario is the most powerful single ceiling in any scenario today — with the weekly straddle of 477.4 pts implying a range top of approximately 73,077, the OI-R at 73,000 sits precisely at the straddle's upper boundary. CE writers at 73,000 who sold these calls today will face maximum gamma pressure as price approaches their strike; they will delta-hedge aggressively by selling futures above 72,900, creating a compressing ceiling that makes 73,000 an essentially impenetrable wall on expiry day unless an extreme event occurs. | 🟢 OI-S: OI Support at **71,000** (PE max OI, weekly) is the structural floor for this week's expiry — put writers at 71,000 are deeply OTM and their primary role today is as the gravitational lower boundary confirming that option market participants are not pricing a sub-71,000 close. More immediately relevant is the SENSEX monthly OI-S at **72,500** (PE max OI, monthly expiry 29-Oct-2026), which sits within the flat-open range and acts as an additional daily support layer — put writers at 72,500 for the monthly series will defend this level through futures buying on any dip, creating a dual-support convergence zone at 72,500 / L3 (72,487.42) that should be respected as the primary intraday bear abort level. |
⚡ Key Trigger: **Bull trigger: First 15-minute candle close above BC 72,673.73** — this is the fulcrum because BC is the bottom of the CPR band and reclaiming it confirms a shift from sub-CPR bearish to inside-CPR bullish, targeting TC (72,743.77), H3 (72,789.98), and ultimately OI-R/R1/H4 cluster (73,000 / 72,948.78 / 72,941.26) as the session ceiling. **Bear trigger: First 15-minute candle close below 72,600 (max pain) / L3 (72,487.42)** — a sustained break below the weekly max pain level of 72,600 combined with a close below L3 (72,487.42) signals that bear pressure is overwhelming even the option-seller pinning force, targeting PDL (72,468.72), S1 (72,398.68), and L4 (72,336.14) for the session.
📊 VIX Insight: India VIX data is unavailable for 07 Oct 2026, which removes a key volatility confirmation tool from the analysis. In the absence of VIX data, the straddle premiums serve as the primary implied-move gauge: NIFTY weekly straddle at 279.25 pts, SENSEX weekly straddle at 477.4 pts (with today being SENSEX weekly expiry), and BANKNIFTY monthly straddle at 1,538.5 pts collectively suggest moderate implied volatility consistent with a trending session rather than an extreme event. Traders should be aware that without VIX confirmation, any gap scenario (particularly large gaps) carries higher uncertainty about follow-through momentum, and position sizing should be adjusted conservatively — CPR and Camarilla levels take on even greater importance as the primary risk management framework.
Overall View:
All three indices present Narrow CPR structures for 08 Oct 2026 (NIFTY 0.09% Descending, BANKNIFTY 0.08% Overlapping, SENSEX 0.10% Overlapping), a rare triple-narrow alignment that strongly signals a high-probability trending day across the board — the first 15-minute candle direction in each index will be definitive. NIFTY carries the most bearish structural bias (Descending CPR with close below BC) and should be monitored for a break below PDL (22,546.30) targeting S1 (22,527.01) and L4 (22,508.81), while BANKNIFTY has the most complex setup with OI-S at 55,000 precisely at BC (54,988.45) — a hold above 55,000 is bullish and targets 55,900 (max pain), while a break below is aggressively bearish. SENSEX faces its weekly expiry today with max pain at 72,600 nearly pinning the previous close, making the OI-R at 73,000 the key ceiling and the CPR band (72,673.73 – 72,743.77) the decision zone that will define whether the expiry session closes near max pain or breaks directionally.
All three indices present Narrow CPR structures for 08 Oct 2026 (NIFTY 0.09% Descending, BANKNIFTY 0.08% Overlapping, SENSEX 0.10% Overlapping), a rare triple-narrow alignment that strongly signals a high-probability trending day across the board — the first 15-minute candle direction in each index will be definitive. NIFTY carries the most bearish structural bias (Descending CPR with close below BC) and should be monitored for a break below PDL (22,546.30) targeting S1 (22,527.01) and L4 (22,508.81), while BANKNIFTY has the most complex setup with OI-S at 55,000 precisely at BC (54,988.45) — a hold above 55,000 is bullish and targets 55,900 (max pain), while a break below is aggressively bearish. SENSEX faces its weekly expiry today with max pain at 72,600 nearly pinning the previous close, making the OI-R at 73,000 the key ceiling and the CPR band (72,673.73 – 72,743.77) the decision zone that will define whether the expiry session closes near max pain or breaks directionally.
Disclaimer: KRV Prime provides educational and informational content relating to financial markets. Articles, research, examples, charts, strategies and tools are provided for educational purposes and should not be interpreted as personalised investment advice or a guarantee of financial performance. Markets involve risk, including possible loss of capital. Past performance does not guarantee future results. KRV Prime is not a SEBI Registered Investment Adviser or Research Analyst.