
Index Analysis
Intraday Analysis for 22 Sep 2026
KRV Prime21 September 202648 min
Educational/Derived AnalysisSource: KRV Prime Market Insights (End-of-Day)As of 21 Sep 2026, 04:07 PM IST
Intraday Analysis for 22 Sep 2026
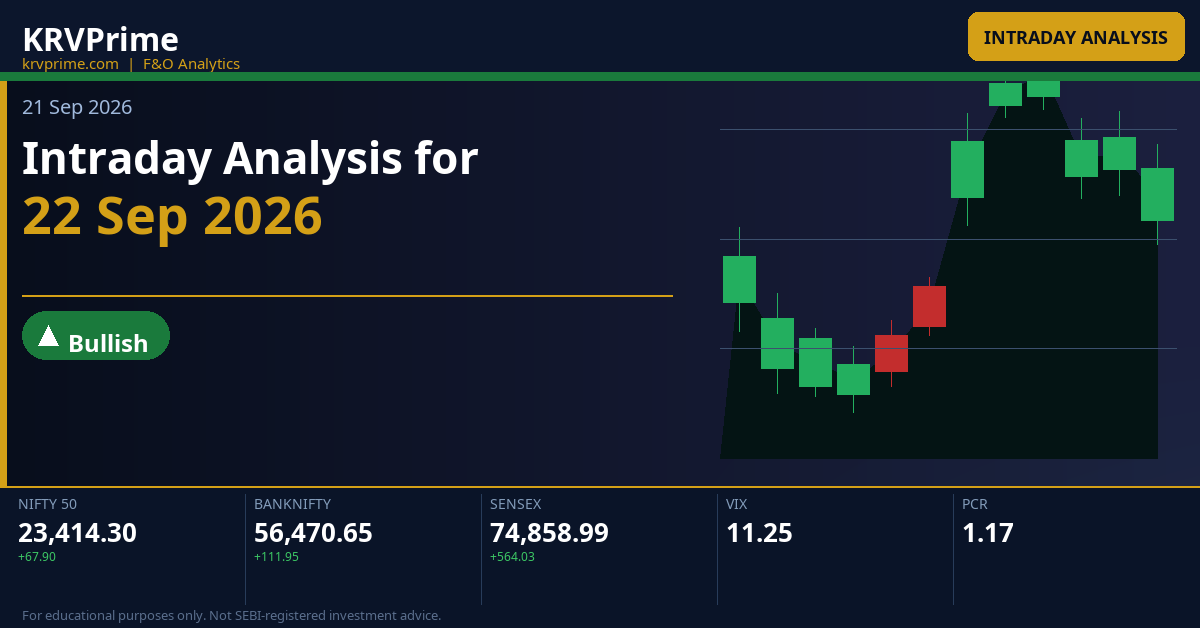
Markets closed with mild gains on 21 Sep 2026 — NIFTY at **23,414.30** (+0.29%), BANKNIFTY at **56,470.65** (+0.20%), and SENSEX at **74,858.99** (+0.76%) — reflecting a session of cautious optimism with no aggressive directional commitment from either side. India VIX data is unavailable for this session, which limits precise volatility-based sizing; however, the narrow CPR widths across all three indices (NIFTY 0.07%, BANKNIFTY 0%, SENSEX 0.12%) inherently signal compressed premium environments where a trending day is highly probable once the opening direction is established. Traders should anchor all trade decisions to the first 15-minute candle for NIFTY and BANKNIFTY and the first 30-minute candle for SENSEX, as CPR type and OI walls define today's structural bias with exceptional clarity.
Key Market Signals — Intraday Setup
All three indices carry **Ascending Narrow CPR structures** into 22 Sep 2026, placing the entire CPR band fractionally above yesterday's close and creating a high-probability trending-day setup where the opening gap direction will act as the primary session bias determiner. NIFTY's weekly OI resistance at **23,500** and BANKNIFTY's monthly OI support at **56,000** are the dominant options walls to watch, as they define the realistic intraday range within which option sellers have maximum gamma exposure.
Deep Technical Analysis & Levels
NIFTY
Ascending — Narrow (Width 0.07%)
▲ Bullish
Market Structure Trending (up or down trend) | Straddle ATM 23,400 weekly straddle = Call 90.75 + Put 42.15 = **132.90 points** implied move, placing the expected range at approximately 23,267 on the downside and 23,533 on the upside for the expiry session; the asymmetry (Call 90.75 vs Put 42.15) signals heavier Call premium implying bulls are paying more for upside exposure while put writers are confident the 23,400 base holds. | Max Pain Weekly Max Pain = **23,400** — extremely close to current close of 23,414.30, implying option sellers collectively benefit from NIFTY pinning near 23,400 on expiry; any sustained move above 23,500 OI-R or below 23,400 OI-S will force delta hedging and accelerate directional momentum away from the pin. |
Tomorrow's Complete Level Map
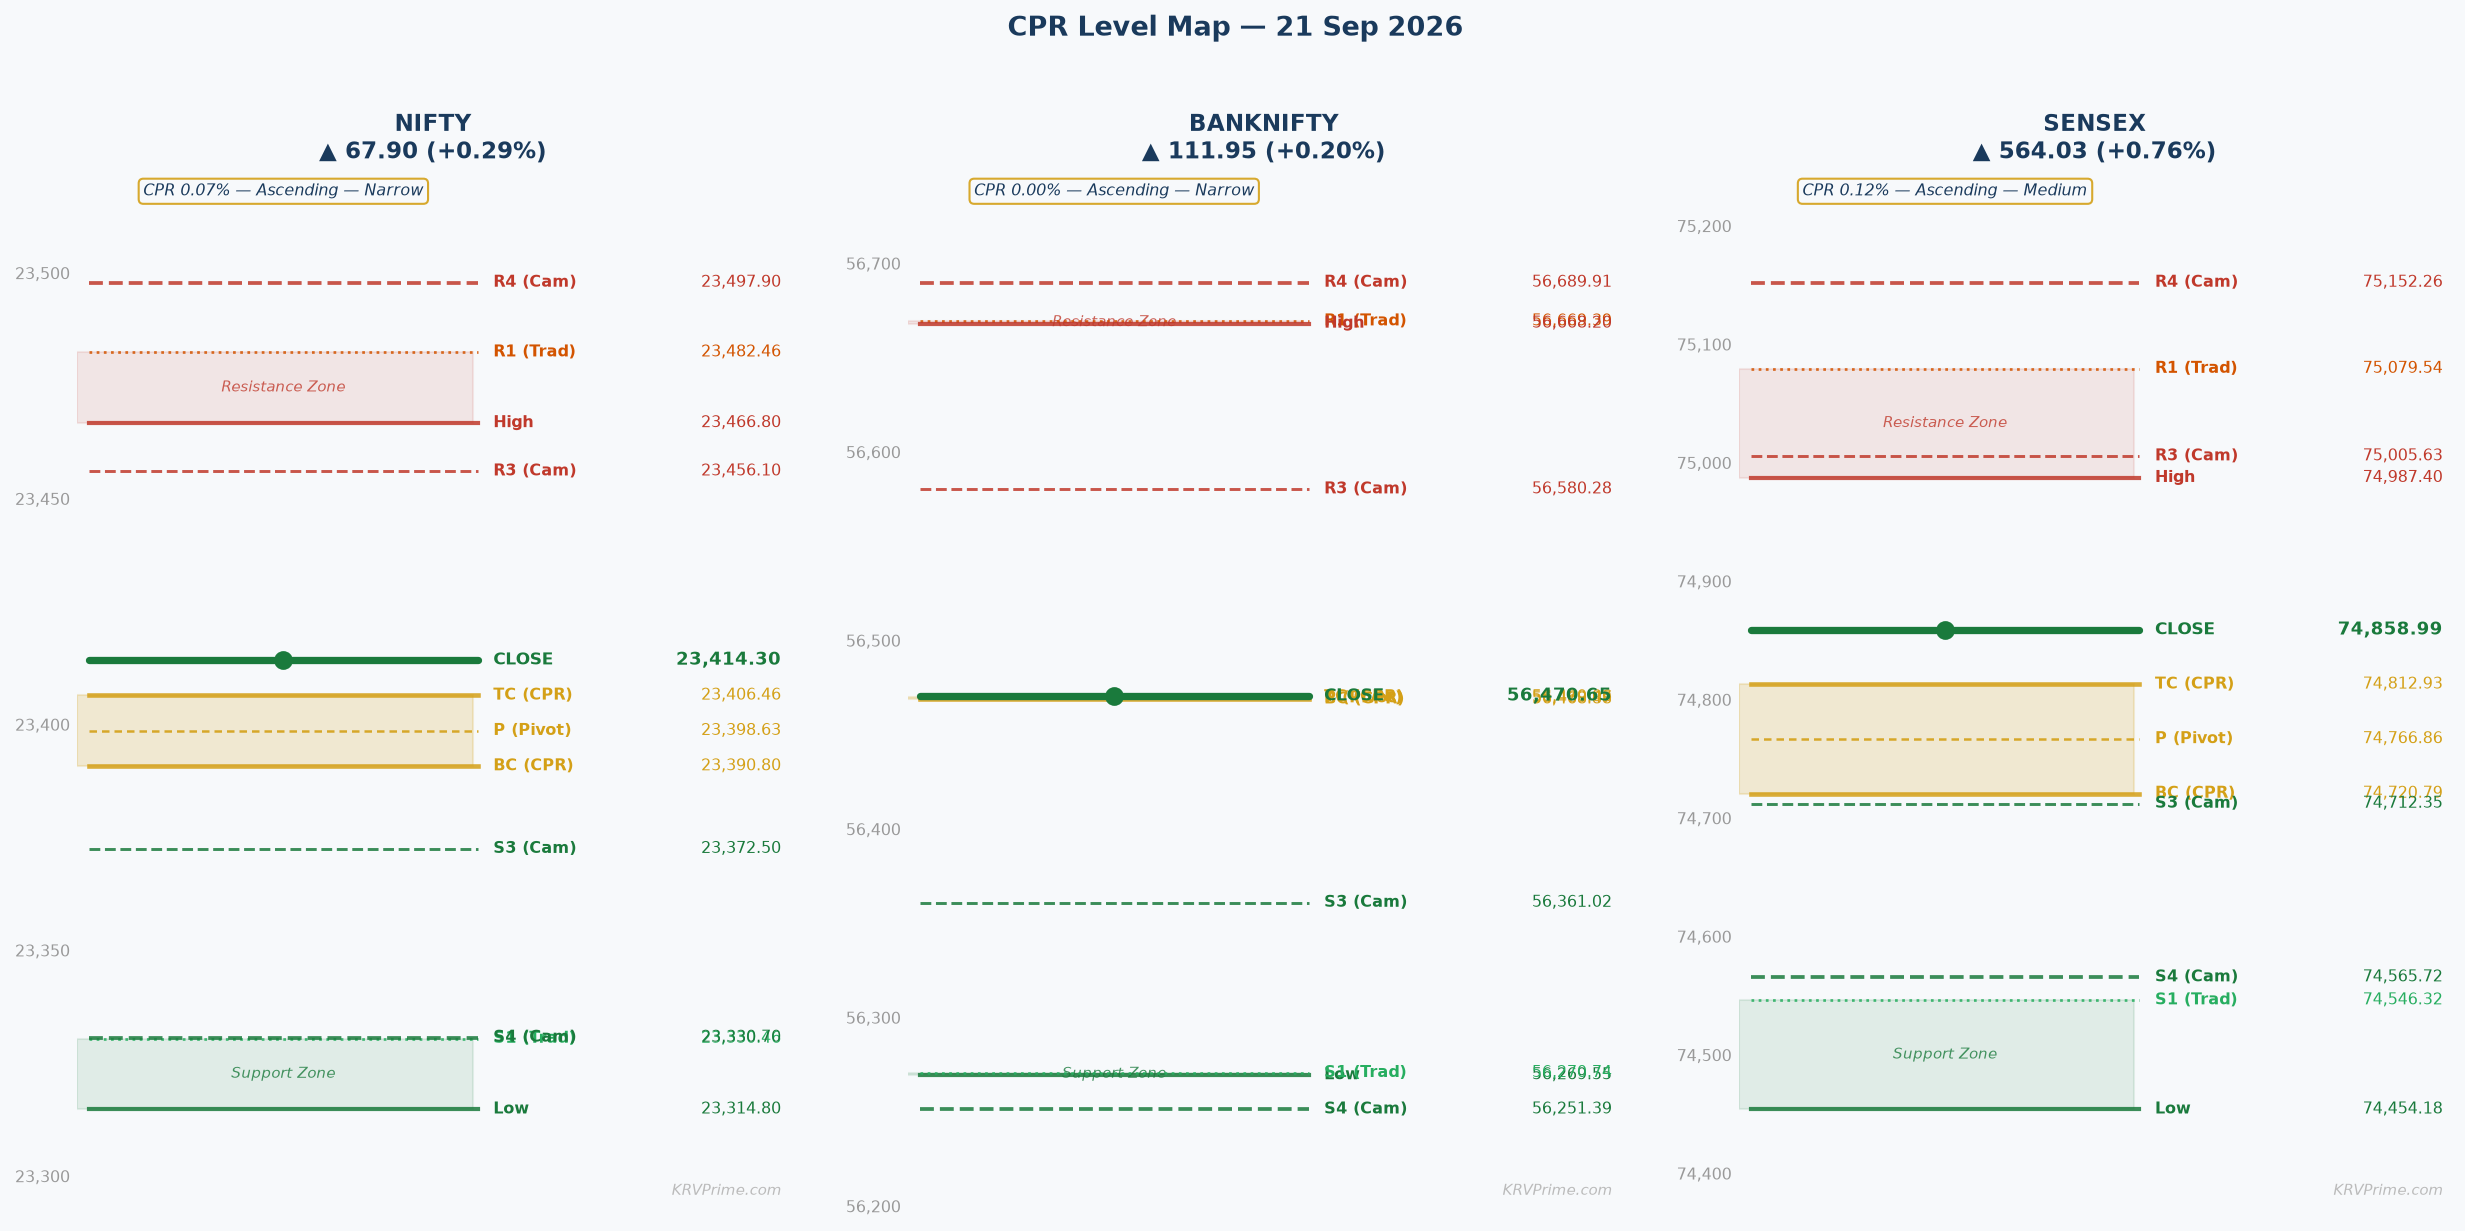
OI-R: 23,500 R3: 23,634.46 H6: 23,566.95 H5: 23,546.72 R2: 23,550.63 H4 ▶: 23,497.90 R1: 23,482.46 PDH: 23,466.80 H3 ↩: 23,456.10
TC: 23,406.46 P: 23,398.63 BC: 23,390.80
L3 ↩: 23,372.50 PDL: 23,314.80 S1: 23,330.46 L4 ▶: 23,330.70 S2: 23,246.63 L5: 23,281.88 L6: 23,261.65 S3: 23,178.46 OI-S: 23,400
↩ = Camarilla reversal point | ▶ = Camarilla breakout/breakdown trigger | OI-R/OI-S = Options wall (CE/PE max OI)
▲ Higher Open (Gap Up) — Open > Prev Close
▲ Bullish
Open lands: For an Ascending CPR where BC=23,390.80 is above prev_TC, a gap-up open places price inside the CPR band (between BC 23,390.80 and TC 23,406.46) or above TC 23,406.46 — the entire CPR is being offered as immediate support from the first tick of the session.
CPR role: Launch pad — the CPR band (BC 23,390.80 to TC 23,406.46) transforms into a compressed springboard; any open at or above TC confirms bullish control and makes the band a base from which upside targets are measured.
Minor Gap (0.05–0.25%) — Structure Dominant
A minor gap-up of 0.05–0.25% opens NIFTY in the range of roughly 23,426 to 23,472, placing price directly above TC 23,406.46 and inside the Camarilla H3 zone at 23,456.10. The Ascending Narrow CPR provides immediate structural confirmation to this minor gap — the entire CPR band below the open acts as a support shelf, adding strong conviction to the bullish lean without creating over-extension risk. The first target on the upside is H3 23,456.10 (partial profit zone), followed by PDH 23,466.80 and R1 23,482.46, with the primary session ceiling at OI-R 23,500; a 15-minute candle close above TC 23,406.46 is the trigger for initiating longs, with stop placed below BC 23,390.80.
Significant Gap (0.25–0.5%) — Balanced
A significant gap of 0.25–0.5% opens NIFTY between approximately 23,473 and 23,531, placing price above H3 23,456.10 and approaching R1 23,482.46 and H4 23,497.90 — zones that coincide almost exactly with the OI resistance wall at 23,500. This creates an immediate risk that the gap-up open is directly into the options wall, where CE writers at 23,500 will aggressively defend with fresh short supply; gap-fill risk back to TC 23,406.46 and BC 23,390.80 increases significantly in the first 30 minutes. If price sustains above H4 23,497.90 and OI-R 23,500 on a 15-minute candle close, the delta-hedging unwind could extend toward H5 23,546.72 and R2 23,550.63 rapidly; however, traders should book partial profits at R1 23,482.46 and use H4 23,497.90 as a trailing stop pivot given the OI wall concentration.
Large Gap (>0.5%) — Gap Direction Dominant
A large gap exceeding 0.5% opens NIFTY above approximately 23,531 — above OI-R 23,500, H5 23,546.72, and potentially approaching R2 23,550.63 — a zone where CE writing pressure is extreme and gap-fill probability is high within the first 60 minutes. The straddle value of 132.90 points with max pain at 23,400 means a large gap-up of this magnitude creates an immediate structural tension: option writers at 23,500 and 23,600 strikes will force hedging that compresses premium, and the gravitational pull of max pain 23,400 is strong. If price cannot sustain above H5 23,546.72 on two consecutive 15-minute candles, aggressive fade setups targeting TC 23,406.46 and BC 23,390.80 become high-probability; the abort for any fade trade is a decisive 15-minute close above H6 23,566.95, which would signal a genuine breakout targeting R3 23,634.46.
|
▲ Upside Path → OI-R Confirmed bull path: **TC 23,406.46 → H3 23,456.10 → PDH 23,466.80 → R1 23,482.46 → H4 23,497.90 → OI-R 23,500** — H3 at 23,456.10 is the first Camarilla mean-reversion stall zone where scalpers should book partial profits; H4 23,497.90 is the Camarilla breakout trigger that, if breached on volume, signals a genuine trend extension toward H5 23,546.72 and R2 23,550.63. Volume confirmation at each breakout level is mandatory — price at H4 23,497.90 without expanding OI or volume is a fade signal, while surging volume through OI-R 23,500 signals short-covering acceleration. |
▼ Downside Path → OI-S If TC 23,406.46 fails to hold after the initial gap-up, the failure sequence is **TC 23,406.46 → P 23,398.63 → BC 23,390.80 → L3 23,372.50 → OI-S 23,400** — importantly, OI-S at 23,400 sits between BC and L3, meaning PE writers will defend 23,400 aggressively, making it a potential intraday bounce zone. Loss of BC 23,390.80 on a 15-minute close fundamentally changes the day's structure from bullish to neutral-bearish, and a subsequent breach of L3 23,372.50 opens the path to PDL 23,314.80, S1 23,330.46, and L4 23,330.70. |
| 🔴 OI-R: OI-R at **23,500** is the dominant CE writing wall for the weekly expiry — thousands of 23,500 CE contracts are short, meaning market makers and option sellers will aggressively supply stock/index futures near 23,500 to delta-hedge their short call exposure, creating a natural ceiling that is extremely difficult to breach without exceptional buying volume. In a gap-up scenario where price approaches 23,500 early, the first test of OI-R is almost always met with a pullback; only a second test on higher volume with time pressure (approaching noon) signals a genuine breakout that can push toward H5 23,546.72. | 🟢 OI-S: OI-S at **23,400** (PE max OI) sits fractionally below the CPR band and serves as a psychological and structural floor in a gap-up session — PE writers at 23,400 who are short puts will buy futures aggressively if NIFTY dips toward 23,400, creating a self-reinforcing bid that makes 23,400 a near-impenetrable support in bullish conditions. Only a catastrophic macro event would push NIFTY through 23,400 OI-S in a gap-up day; for practical trading purposes, any dip toward 23,400 in a gap-up session is a high-probability long entry with a tight stop below 23,372.50 (L3). |
⚡ Key Trigger: The primary trigger for the gap-up scenario is the **first 15-minute candle close above TC 23,406.46** — since CPR width is only 0.07% (15.66 points), this level is the structural fulcrum that separates CPR-as-launch-pad from CPR-as-resistance. A confirmed close above TC 23,406.46 with above-average volume activates the bull path toward H3 23,456.10, R1 23,482.46, and OI-R 23,500; failure to hold TC 23,406.46 and a reversal through P 23,398.63 signals distribution and initiates the bear path toward BC 23,390.80 and L3 23,372.50.
▼ Lower Open (Gap Down) — Open < Prev Close
▼ Bearish
Open lands: For an Ascending CPR, a gap-down open places price below BC 23,390.80 — below the entire CPR band — meaning the CPR structure that was designed to offer support is now immediately overhead as resistance from the first trade of the day.
CPR role: Overhead resistance — the CPR band (BC 23,390.80 to TC 23,406.46) transforms into a supply zone that bulls must reclaim to neutralize bearish pressure; failure to recover BC within 30 minutes confirms the bearish day structure.
Minor Gap (0.05–0.25%) — Structure Dominant
A minor gap-down of 0.05–0.25% opens NIFTY between approximately 23,355 and 23,402, placing price just below BC 23,390.80 or at the lower boundary of the CPR band — a zone where the Ascending CPR creates immediate overhead friction at BC 23,390.80, P 23,398.63, and TC 23,406.46. Minor gaps in an Ascending Narrow CPR often resolve with a recovery attempt within the first 15–30 minutes, as buyers defend the CPR base; if the first 15-minute candle closes back above BC 23,390.80, the gap-fill toward PDC 23,414.30 and TC 23,406.46 becomes the primary play. However, if price opens near 23,355–23,370 and immediately finds L3 23,372.50 acting as resistance rather than support, the bear case accelerates toward PDL 23,314.80, S1 23,330.46, and L4 23,330.70.
Significant Gap (0.25–0.5%) — Balanced
A significant gap-down of 0.25–0.5% opens NIFTY between approximately 23,298 and 23,356, placing price below L3 23,372.50 and approaching the S1/L4 cluster at 23,330.46/23,330.70 — a zone with strong overlap between Traditional and Camarilla support. The bearish case is reinforced when OI-S at 23,400 becomes overhead resistance (inverted from its typical support role), as PE writers at 23,400 who are short puts now face delta loss and may unwind, removing the natural bid that normally underpins 23,400. Recovery requires a 30-minute candle close back above BC 23,390.80, which would confirm a false breakdown and invite gap-fill buying toward PDC 23,414.30; failure to reclaim BC within 30 minutes with expanding volume below L3 23,372.50 signals the bear sequence extending toward L4 23,330.70, L5 23,281.88, and eventually OI-S 23,400 becomes unreachable as a floor.
Large Gap (>0.5%) — Gap Direction Dominant
A large gap-down exceeding 0.5% opens NIFTY below approximately 23,297, breaching L4 23,330.70, S1 23,330.46, and potentially testing L5 23,281.88 — this is a high-panic opening where the straddle's downside limit of ~23,267 (23,400 – 132.90) aligns almost exactly with L5/L6 territory at 23,281.88/23,261.65. In such a scenario, the max pain of 23,400 exerts extreme gravitational pull, but the initial selling pressure from stop-loss triggers below PDL 23,314.80 and L4 23,330.70 can temporarily overwhelm this pull. Recovery potential is highest after the first 30-minute candle completes — if price stabilizes and prints a reversal candle at or above L5 23,281.88, a recovery trade targeting BC 23,390.80 (then TC 23,406.46) becomes viable; straddle buyers will look to monetize put profits near L5-L6 territory and exit.
|
▲ Upside Path → OI-R Recovery path: **L3 23,372.50 → BC 23,390.80 → P 23,398.63 → TC 23,406.46 → H3 23,456.10 → OI-S 23,400 (as support restored) → OI-R 23,500** — the most critical step is the reclaim of BC 23,390.80, which must be followed by a hold above P 23,398.63 to confirm genuine recovery versus a dead-cat bounce. Volume must expand on the reclaim of BC and TC; a low-volume recovery that stalls at P 23,398.63 is a distribution trap and should be treated as a sell opportunity. |
▼ Downside Path → OI-S Bear extension path: **L3 23,372.50 → PDL 23,314.80 → S1 23,330.46 → L4 23,330.70 → L5 23,281.88 → L6 23,261.65 → S2 23,246.63** — retail stop-losses clustered below PDL 23,314.80 and the L4/S1 cluster at 23,330 will be triggered mechanically, accelerating the move; institutional puts become deeply in-the-money and their delta approaches 1, creating a compounding gamma-driven sell cascade. The week's OI-S at 23,400 becomes an overhead resistance zone rather than a floor, fundamentally altering the session's options dynamics. |
| 🔴 OI-R: In a gap-down scenario, OI-R at **23,500** is distant overhead resistance that is essentially irrelevant for the first half of the session — CE writers at 23,500 are comfortably positioned and not under pressure, which actually removes the forced hedging bid that sometimes supports the market. The gamma pressure from 23,500 CE shorts will not create meaningful buying unless price somehow recovers to the 23,480–23,500 zone, making OI-R a secondary reference point that only becomes relevant if a dramatic V-shaped recovery materializes in the afternoon session. | 🟢 OI-S: OI-S at **23,400** is the critical battleground in a gap-down session — PE writers at 23,400 (short puts) will begin forced delta-hedging by selling futures as soon as NIFTY breaches 23,400, paradoxically worsening the downside pressure through mechanical delta-hedging flows. However, the sheer concentration of PE open interest at 23,400 also means that the zone will eventually attract put buyers taking profit and PE writers covering, creating a bounce pocket; traders should watch for high-volume reversal candles at 23,400 and below as the primary long re-entry signal in bear sessions. |
⚡ Key Trigger: In a gap-down scenario, the dual trigger is: **bull recovery** = first 30-minute candle close back above BC 23,390.80, confirming the gap as a false breakdown with buyers absorbing supply; **bear confirmation** = failure to reclaim BC 23,390.80 within 30 minutes with a subsequent candle close below L3 23,372.50, which signals professional selling and activates the L4 23,330.70 → L5 23,281.88 path. The specific level BC 23,390.80 is the structural fulcrum because it marks the bottom of the entire Ascending CPR — reclaiming it means the trend structure is intact, losing it means the trending bias has inverted for the session.
◆ Near Flat Open — Open ≈ Prev Close (±0.05%)
◆ Neutral
Open lands: A ±0.05% flat open places NIFTY between approximately 23,403 and 23,426, landing directly inside the CPR band (BC 23,390.80 to TC 23,406.46) or fractionally above TC — since prev_close 23,414.30 is already above TC 23,406.46, a flat open essentially straddles the TC level, creating an immediate tension between bullish (above TC) and the CPR decision zone.
CPR role: Decision zone / compression band — with CPR width of only 0.07% (15.66 points), a flat open inside or at the CPR boundary is a maximum information setup; the entire day's directional bias will be established within the first 15-minute candle.
Near Flat (±0.05%)
A flat open in NIFTY's Ascending Narrow CPR (0.07% width) is the highest-probability trending-day setup of all three scenarios — the CPR band between BC 23,390.80 and TC 23,406.46 is only 15.66 points wide, meaning price compression at this level is extreme and the energy release, once the 15-minute candle closes directionally, will be fast and decisive. A flat open near prev_close 23,414.30 means price opens approximately 7.84 points above TC 23,406.46, which in a strict Ascending CPR reading means the CPR is already support and bulls have structural advantage — however, the proximity to TC makes it a decision zone rather than a confirmed bull launch. If the first 15-minute candle closes above TC 23,406.46 with conviction (ideally also above H3 23,456.10), the Ascending Narrow CPR confirms a trending bull day targeting R1 23,482.46, H4 23,497.90, and the critical OI-R wall at 23,500; conversely, if the first 15-minute candle reverses and closes below BC 23,390.80, the Ascending CPR's bullish promise is negated for the session and the bear path toward L3 23,372.50 and OI-S 23,400 (as reclaimed support level) opens. The max pain at 23,400 (exactly at OI-S) adds a third dimension: a flat open day with max pain so close to the current price creates a magnetic pin scenario where price oscillates between 23,372.50 (L3) and 23,456.10 (H3) for much of the session before the final hour breakout — this is the 'CPR magnet' setup that scalpers favor but swing traders should avoid entering until a decisive breakout.
|
▲ Upside Path → OI-R Bull path from flat open: **TC 23,406.46 → H3 23,456.10 (first partial profit) → PDH 23,466.80 → R1 23,482.46 (second partial) → H4 23,497.90 → OI-R 23,500 (primary ceiling)** — H3 23,456.10 is the Camarilla mean-reversion zone where the first wave of short-covering will stall; only a candle close above H3 on volume confirms the move is genuine and not a mean-reversion scalp. Above H4 23,497.90, the OI-R 23,500 wall is the dominant structural barrier, and a breach on large volume signals a short-squeeze extending toward H5 23,546.72 and R2 23,550.63. |
▼ Downside Path → OI-S Bear path from flat open: **BC 23,390.80 → L3 23,372.50 → OI-S 23,400 (inverted, now overhead) → PDL 23,314.80 → L4 23,330.70 → S1 23,330.46 → L5 23,281.88** — below BC 23,390.80, L3 at 23,372.50 is the first mean-reversion support where bears should book partial profits on shorts; the S1/L4 cluster at 23,330.46/23,330.70 is a high-confluence support that may slow the decline, but a candle close below L4 23,330.70 opens free space to L5 23,281.88 and L6 23,261.65. |
| 🔴 OI-R: In a flat-open session, OI-R at **23,500** serves as the primary upside destination and CE-writing ceiling — with max pain at 23,400 and the straddle implying a maximum upside of ~23,533, the 23,500 strike is where option sellers have maximum incentive to defend, making it both the profit target for bulls and the primary resistance for any trending-up day. CE writers at 23,500 will become aggressive sellers of futures above 23,490, capping the first attempt; a second attack on 23,500 with higher volume and time pressure (afternoon session) increases the probability of a genuine breach. | 🟢 OI-S: In a flat-open session, OI-S at **23,400** is the gravitational pin zone that aligns almost exactly with max pain — PE writers who are short 23,400 puts have maximum incentive to keep NIFTY above 23,400, creating a natural support bid that makes the 23,390–23,400 zone (BC 23,390.80 to OI-S 23,400) an extremely high-probability bounce zone on any initial dip. Traders should use OI-S 23,400 as the hard stop anchor for long trades initiated above TC 23,406.46, since a breakdown through both TC and OI-S simultaneously would signal a structural failure requiring fresh bearish positioning. |
⚡ Key Trigger: Bull trigger: **First 15-minute candle close above TC 23,406.46** with volume expansion — this confirms that the Ascending CPR's structural promise is realized and activates the upside path toward H3 23,456.10, R1 23,482.46, and OI-R 23,500. Bear trigger: **First 15-minute candle close below BC 23,390.80** — this is the exact structural fulcrum because BC at 23,390.80 marks the base of the entire Ascending CPR; losing this level means the CPR's bullish positioning for the day has failed and sellers are in control, opening L3 23,372.50 and below; market psychology at BC is driven by option sellers at 23,400 who defend that strike actively, meaning any sustained breach of 23,390.80 triggers their stop-loss hedges and amplifies the move.
BANKNIFTY
Ascending — Narrow (Width 0%)
▲ Bullish
Market Structure Trending (up or down trend) | Straddle ATM 56,500 monthly straddle = Call 471.00 + Put 344.30 = **815.30 points** implied move, placing the expected range at approximately 55,655 on the downside and 57,315 on the upside for the monthly expiry; the asymmetry (Call 471.00 vs Put 344.30) shows heavier call premium, signaling elevated upside expectation but also significant call-side risk from CE writers who are aggressively positioned at the 58,000 OI-R wall. | Max Pain Monthly Max Pain = **57,000** — approximately 529 points above current close of 56,470.65, implying a meaningful gravitational pull toward 57,000 over the remaining monthly expiry sessions; this creates a structural upside bias in the absence of bearish catalysts, as option sellers benefit from BankNifty drifting toward 57,000. |
Tomorrow's Complete Level Map
OI-R: 58,000 R3: 57,068.04 H6: 56,870.72 H5: 56,817.96 R2: 56,868.12 H4 ▶: 56,689.91 R1: 56,669.39 PDH: 56,668.20 H3 ↩: 56,580.28
TC: 56,470.06 P: 56,469.47 BC: 56,468.88
L3 ↩: 56,361.02 PDL: 56,269.55 S1: 56,270.74 L4 ▶: 56,251.39 S2: 56,070.82 L5: 56,123.34 L6: 56,070.58 S3: 55,872.09 OI-S: 56,000
↩ = Camarilla reversal point | ▶ = Camarilla breakout/breakdown trigger | OI-R/OI-S = Options wall (CE/PE max OI)
▲ Higher Open (Gap Up) — Open > Prev Close
▲ Bullish
Open lands: For an Ascending CPR where BC=56,468.88 and TC=56,470.06 are effectively at the same point (0% width — ultra-compressed single-point CPR), a gap-up open places price above TC 56,470.06 immediately — the CPR is essentially a single price point at 56,469.47 (P), so any gap-up means price is above the entire CPR structure from the opening tick.
CPR role: Launch pad — the ultra-narrow 0% width CPR at 56,469.47 acts as a single-point springboard; the fact that BC, P, and TC are all within 1.18 points of each other means this CPR is the most compressed possible signal, and a gap-up above it is an extremely high-conviction bullish structural confirmation.
Minor Gap (0.05–0.25%) — Structure Dominant
A minor gap-up of 0.05–0.25% opens BankNifty between approximately 56,499 and 56,612, placing price above the entire CPR (TC 56,470.06) and inside the Camarilla H3 zone at 56,580.28 — since the CPR width is 0% (BC 56,468.88, TC 56,470.06 are virtually identical), even the smallest gap-up is structurally significant and confirms bullish control from the opening bell. The 0% CPR width is a rare occurrence that signals maximum compression and typically precedes a high-velocity trending day; the first 15-minute candle direction will be followed by strong momentum. First target is H3 56,580.28 (partial profit), then PDH 56,668.20 and R1 56,669.39 (near-identical, high-confluence resistance), with OI-R 58,000 as the distant but directional ceiling; trigger is any candle close above TC 56,470.06 — which is satisfied at the open.
Significant Gap (0.25–0.5%) — Balanced
A significant gap-up of 0.25–0.5% opens BankNifty between approximately 56,612 and 56,753, placing price directly between H3 56,580.28 and H4 56,689.91 — the Camarilla breakout zone — which creates immediate risk of a gap-fill back to TC 56,470.06 if H3 56,580.28 fails to hold as support on the first retest. The 0% CPR width amplifies this dynamic: the CPR offers no band cushion, so a failed hold of H3 56,580.28 means price falls directly to the single-point CPR at 56,469.47, a drop of over 100 points. If H3 56,580.28 holds on the first 15-minute retest and a candle closes above H4 56,689.91, the gap-fill risk is neutralized and the upside path extends to R1 56,669.39, PDH 56,668.20, R2 56,868.12, and H5 56,817.96, with delta-hedging flows from CE writers at 57,000 and 57,500 adding momentum.
Large Gap (>0.5%) — Gap Direction Dominant
A large gap-up exceeding 0.5% opens BankNifty above approximately 56,753, potentially clearing H4 56,689.91 and approaching R2 56,868.12 and H5 56,817.96 in the pre-market range — a zone where the straddle's upside of ~57,315 becomes a realistic session target. Given the 0% CPR width, a large gap represents an extreme compression release; historically, zero-width CPR gaps of this magnitude tend to run in one direction without significant retracement in the first hour. However, the OI-R at 58,000 is 1,530 points away, meaning there is ample room before the dominant CE wall is tested; partial profits should be taken at R1 56,669.39, R2 56,868.12, and R3 57,068.04 (which aligns with max pain 57,000), with the abort level for any long being a 15-minute candle close back below H3 56,580.28.
|
▲ Upside Path → OI-R Bull path: **TC 56,470.06 → H3 56,580.28 → PDH 56,668.20 → R1 56,669.39 → H4 56,689.91 → R2 56,868.12 → H5 56,817.96 → R3 57,068.04 → OI-R 58,000** — H3 56,580.28 is the first Camarilla mean-reversion zone for partial profit; the PDH/R1 cluster at 56,668.20/56,669.39 is a major confluence resistance where the first significant pause is expected. H4 56,689.91 is the Camarilla breakout trigger; a 15-minute close above H4 with expanding volume signals the R2/H5 zone at 56,817–56,868 as the next target, and R3 57,068.04 aligns with max pain 57,000, making it the primary day-session exit. |
▼ Downside Path → OI-S Failure path from gap-up: **TC 56,470.06 → P 56,469.47 → BC 56,468.88 → L3 56,361.02 → PDL 56,269.55 → S1 56,270.74 → L4 56,251.39 → OI-S 56,000** — given the 0% CPR width, the entire BC-P-TC zone collapses to a single point at 56,469; a candle close below 56,468 is therefore the immediate bear signal. L3 56,361.02 is the first downside target (approximately 109 points below CPR), and the PDL/S1 cluster at 56,269.55/56,270.74 provides the second major support zone; OI-S at 56,000 is the dominant PE wall where put writers will defend aggressively. |
| 🔴 OI-R: OI-R at **58,000** is the dominant monthly CE writing wall, positioned 1,529 points above current close — in a gap-up scenario, this level is the distant horizon target and will not be approached intraday unless a catastrophic short-squeeze event occurs. The CE writing concentration at 58,000 does, however, create a directional signal: the fact that CE writers are positioned at 58,000 (not 56,500 or 57,000) tells traders that institutional option sellers expect BankNifty to stay below 58,000 for the monthly expiry, implying that any move toward 57,000–57,500 is speculative upside. | 🟢 OI-S: OI-S at **56,000** is the monthly PE writing floor — put writers at 56,000 represent a massive options position that creates a powerful support bid approximately 471 points below current price. In a gap-up session, OI-S 56,000 is the ultimate abort level for all long positions — no rational long trade in a gap-up scenario should be held below 56,000, and any approach toward 56,000 in a gap-up session signals a complete reversal of the day's structure requiring fresh risk assessment. |
⚡ Key Trigger: The primary trigger in BankNifty's 0% Ascending CPR gap-up scenario is **any 15-minute candle close above TC 56,470.06** — which, given the 0% width, is equivalent to saying above the CPR at 56,469.47 (P=BC=TC essentially). Since the CPR is a single point, there is no band to traverse; the first 15-minute close above 56,470 on above-average volume activates the full bull sequence, while a reversal back below 56,468.88 (BC) on the same candle signals a bull trap and initiates the bear path. The 0% width makes this the cleanest binary trigger in today's analysis — there is no 'inside band' ambiguity.
▼ Lower Open (Gap Down) — Open < Prev Close
▼ Bearish
Open lands: For an Ascending 0% CPR, a gap-down open places price below BC 56,468.88 — below the entire (single-point) CPR structure — meaning bearish pressure is in control from the first tick, with the CPR at 56,469 acting as immediate overhead resistance that must be reclaimed.
CPR role: Overhead resistance — the 0% CPR at P=56,469.47 (BC=56,468.88, TC=56,470.06) sits as a near-single-point resistance ceiling directly above the gap-down open; reclaiming even 56,470 on the first 15-minute candle is a decisive bull recovery signal.
Minor Gap (0.05–0.25%) — Structure Dominant
A minor gap-down of 0.05–0.25% opens BankNifty between approximately 56,329 and 56,441, placing price below BC 56,468.88 and inside the zone between L3 56,361.02 and the CPR single-point resistance. Given the 0% CPR width, even a minor gap-down means the entire CPR is overhead resistance — unlike a wide CPR where price might open inside the band, here there is no band cushion. The probability of a gap-fill recovery toward TC 56,470.06 within 15–30 minutes is moderate if L3 56,361.02 holds as support; if price opens below L3 56,361.02, the bear case accelerates toward PDL 56,269.55 and the S1/L4 cluster at 56,270.74/56,251.39.
Significant Gap (0.25–0.5%) — Balanced
A significant gap-down of 0.25–0.5% opens BankNifty between approximately 56,329 and 56,188, placing price near or below L3 56,361.02 and approaching the PDL/S1/L4 cluster at 56,269.55/56,270.74/56,251.39 — a high-confluence support zone that, if breached, opens a clear path to OI-S 56,000. The 0% CPR width means there is no soft landing zone between the open and the CPR resistance at 56,469; recovery requires a powerful buying surge. A 30-minute candle close back above BC 56,468.88 is the recovery trigger; failure to reclaim 56,468.88 within 30 minutes with additional selling below L3 56,361.02 confirms the bearish sequence toward L4 56,251.39, L5 56,123.34, L6 56,070.58, and the monthly OI-S at 56,000.
Large Gap (>0.5%) — Gap Direction Dominant
A large gap-down exceeding 0.5% opens BankNifty below approximately 56,188, potentially near L4 56,251.39 or below — a zone where the S1/L4 cluster (56,270.74/56,251.39) and OI-S 56,000 become the primary reference levels. With the straddle implying a downside of ~55,655 (56,470 – 815), even OI-S 56,000 could be tested in an extreme move. The max pain at 57,000 creates an opposing force: option sellers need BankNifty to recover toward 57,000, so there will be aggressive institutional bidding near 56,000; however, the initial panic selling triggered by stop-losses below L4 56,251.39 can temporarily overwhelm this bid. Straddle buyers should look to monetize put profits near L5 56,123.34 and L6 56,070.58, with the recovery trade triggered only on a 30-minute candle close back above L3 56,361.02.
|
▲ Upside Path → OI-R Recovery path: **L3 56,361.02 → BC 56,468.88 → TC 56,470.06 → H3 56,580.28 → PDH 56,668.20 → R1 56,669.39** — the recovery from a gap-down depends entirely on the speed of the BC 56,468.88 reclaim; a slow, volume-light recovery that takes more than 45 minutes to reach BC is typically a dead-cat bounce that fails at H3 56,580.28. A fast, volume-surge recovery through BC 56,468.88 on the 15-minute candle signals genuine institutional buying and targets R1 56,669.39 and PDH 56,668.20 as the first-session recovery objective. |
▼ Downside Path → OI-S Bear path: **BC 56,468.88 → L3 56,361.02 → PDL 56,269.55 → S1 56,270.74 → L4 56,251.39 → L5 56,123.34 → L6 56,070.58 → S2 56,070.82 → OI-S 56,000** — the S2/L6 cluster at 56,070.58/56,070.82 is a critical double-Camarilla confluence that will produce the day's most significant intraday bounce; traders should cover 50% of short positions at this cluster and the remaining 50% at OI-S 56,000, where PE writing support is at maximum concentration. |
| 🔴 OI-R: OI-R at **58,000** is completely irrelevant in a gap-down scenario — the 1,529-point distance to OI-R means CE writers at 58,000 face no hedging pressure whatsoever, removing any upside gamma-driven buying from the market. This actually worsens the gap-down scenario: without CE writers being forced to buy futures for delta-hedging, the natural institutional bid is absent until price approaches OI-S 56,000, meaning the sell-off can be steeper than expected. | 🟢 OI-S: OI-S at **56,000** is the supreme monthly PE writing floor — in a gap-down session, PE writers at 56,000 (short puts) begin aggressively buying futures as BankNifty approaches 56,200–56,000 to delta-hedge their accelerating losses, creating a powerful mechanical bid that typically produces the session's most explosive bounce. Intraday traders should treat 56,000 as the primary short-covering exit and long re-entry zone; any approach toward 56,000 with a reversal candle on high volume is the session's highest-probability long setup. |
⚡ Key Trigger: Dual trigger for gap-down: **Bull recovery** = 30-minute candle close above BC 56,468.88 (the single-point CPR threshold) — this is the only confirmation that the gap-down is a false move and that bulls are back in control, targeting TC 56,470.06, H3 56,580.28, and R1 56,669.39. **Bear confirmation** = failure to close above BC 56,468.88 within 30 minutes AND a 15-minute candle close below L3 56,361.02 — this dual signal activates the bear sequence toward L4 56,251.39, S1 56,270.74, L5 56,123.34, and OI-S 56,000; the 0% CPR width means these trigger levels are binary with no ambiguity.
◆ Near Flat Open — Open ≈ Prev Close (±0.05%)
◆ Neutral
Open lands: A ±0.05% flat open places BankNifty between approximately 56,442 and 56,499 — directly straddling the 0% CPR (BC 56,468.88, P 56,469.47, TC 56,470.06); since all three CPR levels are within 1.18 points, a flat open is essentially an open ON the CPR single point, making this the most compressed decision-zone setup possible.
CPR role: Maximum compression decision zone — a 0% width CPR means BC, P, and TC are all at 56,469; a flat open directly on this level creates a pure binary trigger with no band ambiguity whatsoever; the first 15-minute candle is the entire trading decision.
Near Flat (±0.05%)
A flat open on BankNifty's 0% Ascending CPR is the rarest and most powerful CPR setup — when CPR width is exactly 0%, the three CPR levels (BC 56,468.88, P 56,469.47, TC 56,470.06) are essentially a single price point at 56,469, and a flat open directly on this level means the market has opened in a state of absolute price equilibrium. The first 15-minute candle is not just important — it IS the trade: there is no band to traverse, no gradual bias shift, only an immediate binary outcome where a close above 56,470.06 (TC) is fully bullish and a close below 56,468.88 (BC) is fully bearish, with literally 1.18 points separating the two outcomes. In a trending market structure (as stated), a 0% Ascending CPR with a flat open historically produces the day's most powerful trending moves — the compression energy has no outlet except a directional breakout, and once the 15-minute trigger fires, the move to H3 56,580.28 (bullish) or L3 56,361.02 (bearish) is typically completed within 30–45 minutes. Bull trigger: **first 15-minute candle close above TC 56,470.06** targets H3 56,580.28, PDH 56,668.20, R1 56,669.39, and ultimately R3 57,068.04 (aligned with max pain 57,000); Bear trigger: **first 15-minute candle close below BC 56,468.88** targets L3 56,361.02, PDL 56,269.55, L4 56,251.39, and ultimately OI-S 56,000.
|
▲ Upside Path → OI-R Bull path from flat open: **TC 56,470.06 → H3 56,580.28 (first partial, 110 points above open) → PDH 56,668.20 → R1 56,669.39 (second partial, high-confluence) → H4 56,689.91 → R2 56,868.12 → H5 56,817.96 → R3 57,068.04 → max pain 57,000 zone** — the PDH/R1 cluster at 56,668.20/56,669.39 is the primary resistance for the first bull leg; a candle close above H4 56,689.91 opens the second leg toward R2/H5 at 56,817–56,868. The max pain at 57,000 and R3 57,068.04 are the session's ultimate targets in a pure trending bull day. |
▼ Downside Path → OI-S Bear path from flat open: **BC 56,468.88 → L3 56,361.02 (first partial, 108 points below open) → PDL 56,269.55 → S1 56,270.74 → L4 56,251.39 (second partial, high-confluence) → L5 56,123.34 → L6 56,070.58 → S2 56,070.82 → OI-S 56,000** — L3 56,361.02 is the first Camarilla mean-reversion zone where partial short profits should be taken; the triple-confluence at PDL/S1/L4 (56,251–56,270) is the major intraday support cluster that, if breached, opens a rapid move to the OI-S 56,000 floor. |
| 🔴 OI-R: In a flat-open 0% CPR session, OI-R at **58,000** is the distant but directionally important ceiling — its position 1,529 points above the open signals that institutional CE writers are comfortable with upside risk up to 58,000, meaning there is no meaningful options-driven resistance between current price and 57,000–57,500. This is actually bullish for intraday bulls: the absence of major CE walls between 56,470 and 58,000 means upside moves face only technical Camarilla and Traditional levels as obstacles, with no gamma-wall compression until 58,000. | 🟢 OI-S: In a flat-open session, OI-S at **56,000** is the primary downside anchor — PE writers at 56,000 who are short puts will defend this level with increasing aggression as price falls toward it, creating a mechanical bid floor approximately 470 points below the open. Flat-open days in BankNifty that break bearishly rarely reach OI-S 56,000 in a single session unless a macro shock is involved; traders should treat L5 56,123.34 and L6 56,070.58 as the realistic bear-day targets and reserve 56,000 as the abort level for all longs. |
⚡ Key Trigger: Bull trigger: **First 15-minute candle close above TC 56,470.06** — given the 0% CPR width, this requires only the smallest price movement above 56,470 on a candle close, making it an extremely sensitive trigger that fires quickly; volume above the 20-period average on this candle is critical to distinguish genuine breakout from noise. Bear trigger: **First 15-minute candle close below BC 56,468.88** — again, only 1.18 points below TC, making this a hair-trigger level; the structural importance is that the 0% Ascending CPR has positioned the CPR AS the day's opening price, so any directional close is immediately a structural break with no ambiguity.
SENSEX
Ascending — Medium (Width 0.12%)
▲ Bullish
Market Structure Balanced or transitional | Straddle ATM 74,900 weekly/monthly straddle = Call 366.95 + Put 314.00 = **680.95 points** implied move, placing the expected range at approximately 74,219 on the downside and 75,581 on the upside for the expiry session; the near-symmetrical premium (Call 366.95 vs Put 314.00) signals a relatively balanced market with only modest upside bias, consistent with the 'balanced or transitional' market structure label. | Max Pain Weekly and Monthly Max Pain = **74,800** — approximately 58.99 points below current close of 74,858.99, suggesting a mild gravitational pull downward toward the 74,800 pin; however, the proximity of max pain to current price means option sellers are broadly neutral and a 58-point drift is within normal session noise. |
Tomorrow's Complete Level Map
OI-R: 77,000 R3: 75,612.76 H6: 75,395.11 H5: 75,323.52 R2: 75,300.08 H4 ▶: 75,152.26 R1: 75,079.54 PDH: 74,987.40 H3 ↩: 75,005.63
TC: 74,812.93 P: 74,766.86 BC: 74,720.79
L3 ↩: 74,712.35 PDL: 74,454.18 S1: 74,546.32 L4 ▶: 74,565.72 S2: 74,233.64 L5: 74,394.46 L6: 74,322.87 S3: 74,013.10 OI-S: 74,500
↩ = Camarilla reversal point | ▶ = Camarilla breakout/breakdown trigger | OI-R/OI-S = Options wall (CE/PE max OI)
▲ Higher Open (Gap Up) — Open > Prev Close
▲ Bullish
Open lands: For an Ascending Medium CPR where BC=74,720.79 and TC=74,812.93, a gap-up open from prev_close 74,858.99 places price inside the CPR band (between BC and TC) or above TC 74,812.93 — since prev_close is already above TC by 46 points, even a flat/minor gap-up maintains position above TC, with the CPR acting as support below.
CPR role: Launch pad with retest potential — the CPR band (BC 74,720.79 to TC 74,812.93, width 92.14 points) in a Medium configuration means first retests of TC are common before the primary move extends; the band provides a cushioned support zone rather than a single-point trigger.
Minor Gap (0.05–0.25%) — Structure Dominant
A minor gap-up of 0.05–0.25% opens SENSEX between approximately 74,897 and 75,046, placing price above TC 74,812.93 and inside the zone approaching H3 75,005.63 — the first Camarilla mean-reversion resistance. The Ascending Medium CPR (0.12%) in a balanced or transitional market structure means the CPR provides a reliable support shelf below the open at BC 74,720.79, but the Medium width requires a 30-minute candle confirmation before committing to a trend trade rather than the 15-minute rule. The first upside target is H3 75,005.63 (partial profit), followed by PDH 74,987.40 (slightly below H3, making the 74,987–75,005 zone a high-confluence resistance cluster), then R1 75,079.54; stop for longs should be placed below TC 74,812.93 with a 30-minute confirmation rule before entry.
Significant Gap (0.25–0.5%) — Balanced
A significant gap-up of 0.25–0.5% opens SENSEX between approximately 75,046 and 75,233, placing price above H3 75,005.63 and approaching H4 75,152.26 — a zone that is already 293 points above prev_close, creating immediate gap-fill risk back to TC 74,812.93. The balanced market structure label amplifies this risk: in transitional markets, significant gaps frequently mean-revert within the first 30–60 minutes, especially when the open is above a Camarilla H3 zone where institutional mean-reversion sellers are positioned. If H3 75,005.63 holds as support on the first 30-minute retest (30-minute close confirmation required for Medium CPR), the upside path extends to H4 75,152.26 and R2 75,300.08; failure of H3 75,005.63 on the 30-minute close triggers a gap-fill toward TC 74,812.93 and P 74,766.86.
Large Gap (>0.5%) — Gap Direction Dominant
A large gap-up exceeding 0.5% opens SENSEX above approximately 75,233, potentially at H4 75,152.26 or above — a zone where the 680.95-point straddle's upside (~75,581) and R3 75,612.76 converge as the extreme session target. The balanced/transitional market structure creates a heightened probability of gap-fill in large gaps because institutional positioning is not fully committed to either direction; a large gap-up in this structure is often a liquidity event that gets faded. Traders should watch two consecutive 30-minute candles above H4 75,152.26 before confirming a genuine breakout; if the second 30-minute candle closes below H4 75,152.26, the fade trade targeting TC 74,812.93 and P 74,766.86 is the primary setup.
|
▲ Upside Path → OI-R Bull path: **TC 74,812.93 → H3 75,005.63 → PDH 74,987.40 (note: PDH is below H3, so H3 75,005 is the primary resistance) → R1 75,079.54 → H4 75,152.26 → R2 75,300.08 → H5 75,323.52 → H6 75,395.11 → R3 75,612.76 → OI-R 77,000** — the PDH at 74,987.40 is actually slightly below H3 75,005.63, making the 74,987–75,005 zone a triple-resistance confluence (PDH, H3, and approaching R1); a 30-minute close above 75,005.63 is required to confirm the bull breakout rather than a PDH resistance rejection. OI-R at 77,000 is 2,141 points above current price and is the monthly/weekly ceiling, not a realistic intraday target. |
▼ Downside Path → OI-S Failure path from gap-up: **TC 74,812.93 → P 74,766.86 → BC 74,720.79 → L3 74,712.35 → OI-S 74,500 → S1 74,546.32 → PDL 74,454.18 → L4 74,565.72** — note that L4 74,565.72 is actually above PDL 74,454.18 in this data set, creating an unusual ordering; OI-S at 74,500 sits between S1 74,546.32 and PDL 74,454.18, making the 74,454–74,546 zone the primary intraday support cluster. Loss of BC 74,720.79 on a 30-minute candle close changes the day structure from bullish to bearish, and a subsequent breach of L3 74,712.35 confirms the bear trend. |
| 🔴 OI-R: OI-R at **77,000** is the dominant weekly and monthly CE writing wall — positioned 2,141 points above current close, it is not a realistic intraday session target and functions as a macro ceiling for the weekly/monthly expiry period rather than an intraday reference. In a gap-up scenario, OI-R 77,000 signals that option sellers are supremely confident SENSEX will not reach 77,000 this week, creating a range-compression dynamic where the effective upside ceiling for intraday moves is closer to R2 75,300.08 and H5 75,323.52. | 🟢 OI-S: OI-S at **74,500** aligns closely with the S1 74,546.32 and PDL 74,454.18 zone, creating a powerful triple confluence support approximately 359 points below current close — in a gap-up session, this zone is the primary downside abort level for all longs. PE writers at 74,500 will aggressively buy futures if SENSEX dips toward 74,500, creating a structural floor; any long position initiated after a gap-up should use OI-S 74,500 as the hard stop level, with L3 74,712.35 as the intermediate warning level. |
⚡ Key Trigger: The primary trigger for SENSEX in a gap-up scenario is the **first 30-minute candle close above TC 74,812.93** — Medium CPR width (0.12%) mandates 30-minute confirmation before initiating trend trades, as the 92-point CPR band creates enough friction to produce false 15-minute breakouts. If the first 30-minute candle closes above TC 74,812.93 on above-average volume, the bull path toward H3 75,005.63 and R1 75,079.54 is confirmed; a 30-minute close that fails to hold above TC and reverses through P 74,766.86 signals distribution and the bear path toward BC 74,720.79 and L3 74,712.35.
▼ Lower Open (Gap Down) — Open < Prev Close
▼ Bearish
Open lands: For an Ascending Medium CPR, a gap-down open from prev_close 74,858.99 places price at or inside the CPR band (between BC 74,720.79 and TC 74,812.93) on a minor gap, or below BC 74,720.79 on a significant-to-large gap — the CPR structure becomes immediate overhead resistance.
CPR role: Overhead resistance / recovery battleground — the 92-point CPR band (BC 74,720.79 to TC 74,812.93) in a gap-down scenario becomes the recovery target; Medium width means a 30-minute close back above TC 74,812.93 is required to signal genuine bull recovery.
Minor Gap (0.05–0.25%) — Structure Dominant
A minor gap-down of 0.05–0.25% opens SENSEX between approximately 74,672 and 74,822, placing price at or just inside the CPR band — specifically near BC 74,720.79 or between BC and TC. In a Medium Ascending CPR, a minor gap-down that opens inside the band (above BC) creates an immediate CPR decision: if price holds above BC 74,720.79 on the first 30-minute candle close, the Ascending CPR retains its bullish bias and a recovery toward TC 74,812.93 and prev_close 74,858.99 is the primary scenario. However, if price opens below BC 74,720.79 and the first 30-minute candle closes below BC, the Ascending CPR's bullish promise is negated and the bear path toward L3 74,712.35 and OI-S 74,500 activates — the Medium width requires 30-minute confirmation to avoid false signals.
Significant Gap (0.25–0.5%) — Balanced
A significant gap-down of 0.25–0.5% opens SENSEX between approximately 74,672 and 74,484, placing price below BC 74,720.79 and inside the L3 74,712.35 to OI-S 74,500 zone — a critical support band that must hold to prevent a deeper selloff. The balanced/transitional market structure adds complexity: in transitional markets, significant gaps often produce a morning selloff followed by a sharp V-recovery, making premature short entries risky. The 30-minute candle rule for Medium CPR means traders should wait for a clear 30-minute close below L3 74,712.35 before committing to shorts, or a 30-minute close above BC 74,720.79 for recovery longs; the OI-S at 74,500 (PE writing wall) is the primary bounce zone and short-cover level.
Large Gap (>0.5%) — Gap Direction Dominant
A large gap-down exceeding 0.5% opens SENSEX below approximately 74,484, placing price at or below OI-S 74,500 and approaching S1 74,546.32 from above (crossed) — a scenario where the PE writing wall at 74,500 is immediately tested and delta-hedging by put writers (who are forced to sell futures as delta rises) compounds the selling. The straddle's downside of ~74,219 (74,900 – 680.95) aligns with S2 74,233.64, signaling that a large gap-down could reach the straddle's maximum implied move. Two 30-minute candle closes are required to confirm the Large gap bear trend (per Wide/Large gap rules); if both closes are below OI-S 74,500, the path to PDL 74,454.18, L4 74,565.72 (note: L4 is above PDL in this data), and S2 74,233.64 is confirmed.
|
▲ Upside Path → OI-R Recovery path: **L3 74,712.35 → BC 74,720.79 → P 74,766.86 → TC 74,812.93 → PDH 74,987.40 → H3 75,005.63 → R1 75,079.54** — the critical recovery milestone is a 30-minute close above TC 74,812.93; a low-volume, slow recovery that stalls at P 74,766.86 or BC 74,720.79 is a distribution trap and should not be chased. Volume must expand at or above the 20-period average on the TC reclaim candle to signal genuine institutional buying rather than short-covering into the CPR resistance. |
▼ Downside Path → OI-S Bear path: **BC 74,720.79 → L3 74,712.35 → OI-S 74,500 → S1 74,546.32 → PDL 74,454.18 → L4 74,565.72 → L5 74,394.46 → L6 74,322.87 → S2 74,233.64** — the OI-S/S1 cluster at 74,500/74,546 is the primary short-cover zone where 50% of short profits should be booked; the L5/L6 zone at 74,394.46/74,322.87 is the secondary target where remaining short positions should be fully exited, as the straddle's maximum downside at ~74,219 aligns with S2 74,233.64. |
| 🔴 OI-R: In a gap-down SENSEX session, OI-R at **77,000** is completely irrelevant — 2,141 points of distance means CE writers face zero hedging pressure and provide no natural buying support. The absence of meaningful CE wall pressure near current prices (the nearest CE concentration is at 77,000) means the gap-down is entirely a bearish technical and PE-driven event, with no counterbalancing gamma force from CE writers until a dramatic recovery occurs. | 🟢 OI-S: OI-S at **74,500** is the dominant PE writing floor and the single most important level in a gap-down scenario — PE writers at 74,500 (short puts) face accelerating delta losses as SENSEX falls toward 74,500, and their mechanical futures-buying (delta hedging) creates the session's most powerful support bid. In any gap-down session, the approach to OI-S 74,500 with a reversal candle on high volume is the highest-probability long entry of the day; conversely, if OI-S 74,500 is broken on a 30-minute close, the PE writers' hedging turns from buying to further selling, and the move to S2 74,233.64 becomes mechanically inevitable. |
⚡ Key Trigger: Dual 30-minute trigger: **Bull recovery** = 30-minute candle close back above TC 74,812.93 — this is the minimum requirement for the Ascending Medium CPR to restore bullish bias, and requires price to traverse the full 92-point CPR band from below; a clean 30-minute close above TC with volume confirms recovery toward H3 75,005.63. **Bear confirmation** = 30-minute candle close below BC 74,720.79, followed by a 30-minute close below L3 74,712.35 — the dual confirmation (two closes) is required because the Medium CPR width and balanced market structure both increase the probability of false breakdown signals; only when both closes confirm bearish does the L4 74,565.72 → OI-S 74,500 → S1 74,546.32 sequence activate.
◆ Near Flat Open — Open ≈ Prev Close (±0.05%)
◆ Neutral
Open lands: A ±0.05% flat open places SENSEX between approximately 74,822 and 74,896, landing above TC 74,812.93 (since prev_close 74,858.99 is already 46 points above TC); a flat open is therefore an open already above the entire CPR band, with the CPR acting as a support shelf below.
CPR role: Support shelf / decision zone — with CPR width of 0.12% (92 points, Medium), a flat open 46–84 points above TC creates a scenario where the CPR band is well-positioned below as support, but the 'balanced or transitional' market structure means the bullish advantage from the Ascending CPR must still be confirmed by 30-minute price action above TC 74,812.93.
Near Flat (±0.05%)
A flat open in SENSEX's Ascending Medium CPR (0.12% width, 92 points) is a nuanced setup because prev_close at 74,858.99 is already 46 points above TC 74,812.93 — meaning a flat open automatically places price above the entire CPR band, giving bulls the structural advantage from the first minute. However, the Medium CPR width (0.12%) mandates 30-minute candle confirmation before initiating trend trades, and the 'balanced or transitional' market structure label warns that the session may oscillate before committing to a direction, especially with max pain at 74,800 only 59 points below prev_close. A flat open that holds above TC 74,812.93 through the first 30-minute candle confirms the Ascending CPR's bullish structural promise and activates the upside path toward H3 75,005.63 and R1 75,079.54; a flat open that retraces through TC 74,812.93 and closes the first 30-minute candle below TC signals a reversal of the multi-session bullish structure, making BC 74,720.79 the next support test and L3 74,712.35 the bear trigger. With max pain at 74,800 sitting 12 points below TC 74,812.93, a flat open creates a magnetic 'pin zone' scenario where the market may oscillate between L3 74,712.35 and H3 75,005.63 (a 293-point range) for much of the morning before committing; the first 30-minute close is the critical decision point that determines whether the CPR support holds or fails.
|
▲ Upside Path → OI-R Bull path from flat open: **TC 74,812.93 (support confirmed) → PDH 74,987.40 → H3 75,005.63 (first partial profit, 30-min close above required) → R1 75,079.54 (second partial) → H4 75,152.26 → R2 75,300.08 → H5 75,323.52 → H6 75,395.11 → R3 75,612.76 → OI-R 77,000 (distant weekly ceiling)** — the PDH/H3 cluster at 74,987/75,005 is the first major resistance where the initial bull wave will stall; a 30-minute close above H3 75,005.63 is required to confirm the move is genuine and not a PDH-resistance rejection. R1 75,079.54 is the primary Traditional target where second partial profits should be booked. |
▼ Downside Path → OI-S Bear path from flat open: **TC 74,812.93 (fails) → P 74,766.86 → BC 74,720.79 (bear trigger) → L3 74,712.35 → OI-S 74,500 → S1 74,546.32 → PDL 74,454.18 → L4 74,565.72 (above PDL, noted) → L5 74,394.46 → L6 74,322.87 → S2 74,233.64** — L3 74,712.35 sits only 8.44 points below BC 74,720.79, meaning the BC and L3 form a near-confluent support cluster; a 30-minute close below this cluster activates the OI-S 74,500 target with high momentum. The S1/PDL zone at 74,454–74,546 is the intermediate major support where 50% short profits should be booked in a bear day. |
| 🔴 OI-R: In a flat-open SENSEX session, OI-R at **77,000** is the macro weekly/monthly CE writing ceiling — its extreme distance (2,141 points) means it provides no meaningful gamma pressure on intraday trading and should not be used as a target for any single-day trade. The practical implication for flat-open bulls is that between TC 74,812.93 and OI-R 77,000, the only resistance is technical (Camarilla and Traditional levels), creating clear air for trending moves without the CE-wall compression that typically caps intraday moves near OI-R. | 🟢 OI-S: In a flat-open SENSEX session, OI-S at **74,500** (PE max OI) is the week's and month's primary defensive floor — PE writers at 74,500 represent maximum open interest concentration on the put side, and their delta-hedging buying creates a natural intraday bid approximately 359 points below the flat open level. For flat-open traders, OI-S 74,500 defines the maximum downside for any bear day without a macro catalyst; all short positions initiated below TC 74,812.93 should have profit targets at or before OI-S 74,500, and the level should be respected as a high-probability reversal zone rather than a break-through target. |
⚡ Key Trigger: Bull trigger: **First 30-minute candle close above TC 74,812.93** — since the flat open is already above TC, this trigger confirms that buyers are absorbing any intraday dip to TC and the Ascending CPR remains a support structure; 30-minute confirmation (not 15-minute) is required due to the Medium width, which creates enough band friction to produce false 15-minute breakouts. Bear trigger: **First 30-minute candle close below BC 74,720.79** — this requires a decline of at least 138 points from the flat open level (~74,859), which is meaningful and typically associated with institutional selling; a close below BC 74,720.79 signals that the Ascending CPR's bullish positioning has been rejected and the bear path toward L3 74,712.35 and OI-S 74,500 is activated.
📊 VIX Insight: India VIX data is unavailable for this session, which removes the direct implied volatility input from sizing and conviction calculations — traders should treat this as a neutral VIX environment and rely on CPR width, straddle pricing, and OI concentration as the primary risk-calibration tools. The NIFTY weekly straddle at 132.90 points (±0.57% of ATM) and SENSEX straddle at 680.95 points (±0.91% of ATM) suggest moderate volatility expectations that are consistent with narrow-to-medium CPR widths; BankNifty's monthly straddle at 815.30 points (±1.44% of ATM) reflects the higher beta and wider range expected in banking.
Overall View:
All three indices head into 22 Sep 2026 with **Ascending CPR structures** — NIFTY (Narrow 0.07%), BankNifty (Narrow 0%), and SENSEX (Medium 0.12%) — creating a high-probability trending-day environment where the opening gap direction will set the tone for the entire session, particularly for the two zero-to-ultra-narrow CPR indices. The dominant OI walls — NIFTY weekly OI-R 23,500 / OI-S 23,400, BankNifty monthly OI-R 58,000 / OI-S 56,000, and SENSEX OI-R 77,000 / OI-S 74,500 — define the intraday ranges and suggest a day where option sellers have maximum control, making over-extension beyond the first Camarilla H3/L3 zones risky without volume confirmation. Traders should prioritize the 15-minute trigger rule for NIFTY and BankNifty (Narrow CPR) and the 30-minute rule for SENSEX (Medium CPR), use OI walls as primary profit targets and stop anchors, and avoid chasing gaps beyond the straddle-implied move limits.
All three indices head into 22 Sep 2026 with **Ascending CPR structures** — NIFTY (Narrow 0.07%), BankNifty (Narrow 0%), and SENSEX (Medium 0.12%) — creating a high-probability trending-day environment where the opening gap direction will set the tone for the entire session, particularly for the two zero-to-ultra-narrow CPR indices. The dominant OI walls — NIFTY weekly OI-R 23,500 / OI-S 23,400, BankNifty monthly OI-R 58,000 / OI-S 56,000, and SENSEX OI-R 77,000 / OI-S 74,500 — define the intraday ranges and suggest a day where option sellers have maximum control, making over-extension beyond the first Camarilla H3/L3 zones risky without volume confirmation. Traders should prioritize the 15-minute trigger rule for NIFTY and BankNifty (Narrow CPR) and the 30-minute rule for SENSEX (Medium CPR), use OI walls as primary profit targets and stop anchors, and avoid chasing gaps beyond the straddle-implied move limits.
Disclaimer: KRV Prime provides educational and informational content relating to financial markets. Articles, research, examples, charts, strategies and tools are provided for educational purposes and should not be interpreted as personalised investment advice or a guarantee of financial performance. Markets involve risk, including possible loss of capital. Past performance does not guarantee future results. KRV Prime is not a SEBI Registered Investment Adviser or Research Analyst.