
Index Analysis
Intraday Analysis for 23 Oct 2026
KRV Prime22 October 202661 min
Educational/Derived AnalysisSource: KRV Prime Market Insights (End-of-Day)As of 22 Oct 2026, 03:34 PM IST
Intraday Analysis for 23 Oct 2026
Markets closed on a soft note on 22 Oct 2026, with NIFTY shedding 0.54% to 22,687.65, SENSEX dropping 0.62% to 73,249.39, and BANKNIFTY relatively resilient at -0.09% closing 54,925.70. All three indices are printing Descending CPR formations for 23 Oct 2026, signalling that the pivot structure has shifted below yesterday's price action, placing the entire CPR band as overhead resistance for the upcoming session — a structurally bearish configuration that favours continuation of selling unless price reclaims TC levels decisively. India VIX data is unavailable for this session, which adds uncertainty to premium pricing and means traders must rely more heavily on OI walls, straddle-implied moves, and CPR structure to calibrate risk — with NIFTY's 306.2-point straddle and BANKNIFTY's 804.7-point straddle defining the day's expected volatility envelope.
Key Market Signals — Intraday Setup
All three indices — NIFTY, BANKNIFTY, and SENSEX — are printing Descending CPR formations on 23 Oct 2026, with each index closing below its respective new CPR band, confirming multi-index selling pressure and a structurally bearish opening bias that demands bulls reclaim TC levels before any sustainable intraday upside can be expected.
Deep Technical Analysis & Levels
NIFTY
Descending — Narrow (0.05%)
▼ Bearish
Market Structure Trending (up or down trend) | Straddle ATM 22700 straddle = 306.2 pts (Call 160.3 + Put 145.9), implying an expected intraday move of approximately ±306 pts, placing the upper range near 23,006 and lower range near 22,394 from the ATM strike | Max Pain Max Pain at 22,850 for the 27-Oct-2026 expiry, sitting well above the current close of 22,687.65 — this 162-point gap suggests option sellers have significant interest in pulling price upward toward 22,850 into expiry, creating a gravitational pull that could support any intraday dip-buying attempts during the week |
Tomorrow's Complete Level Map
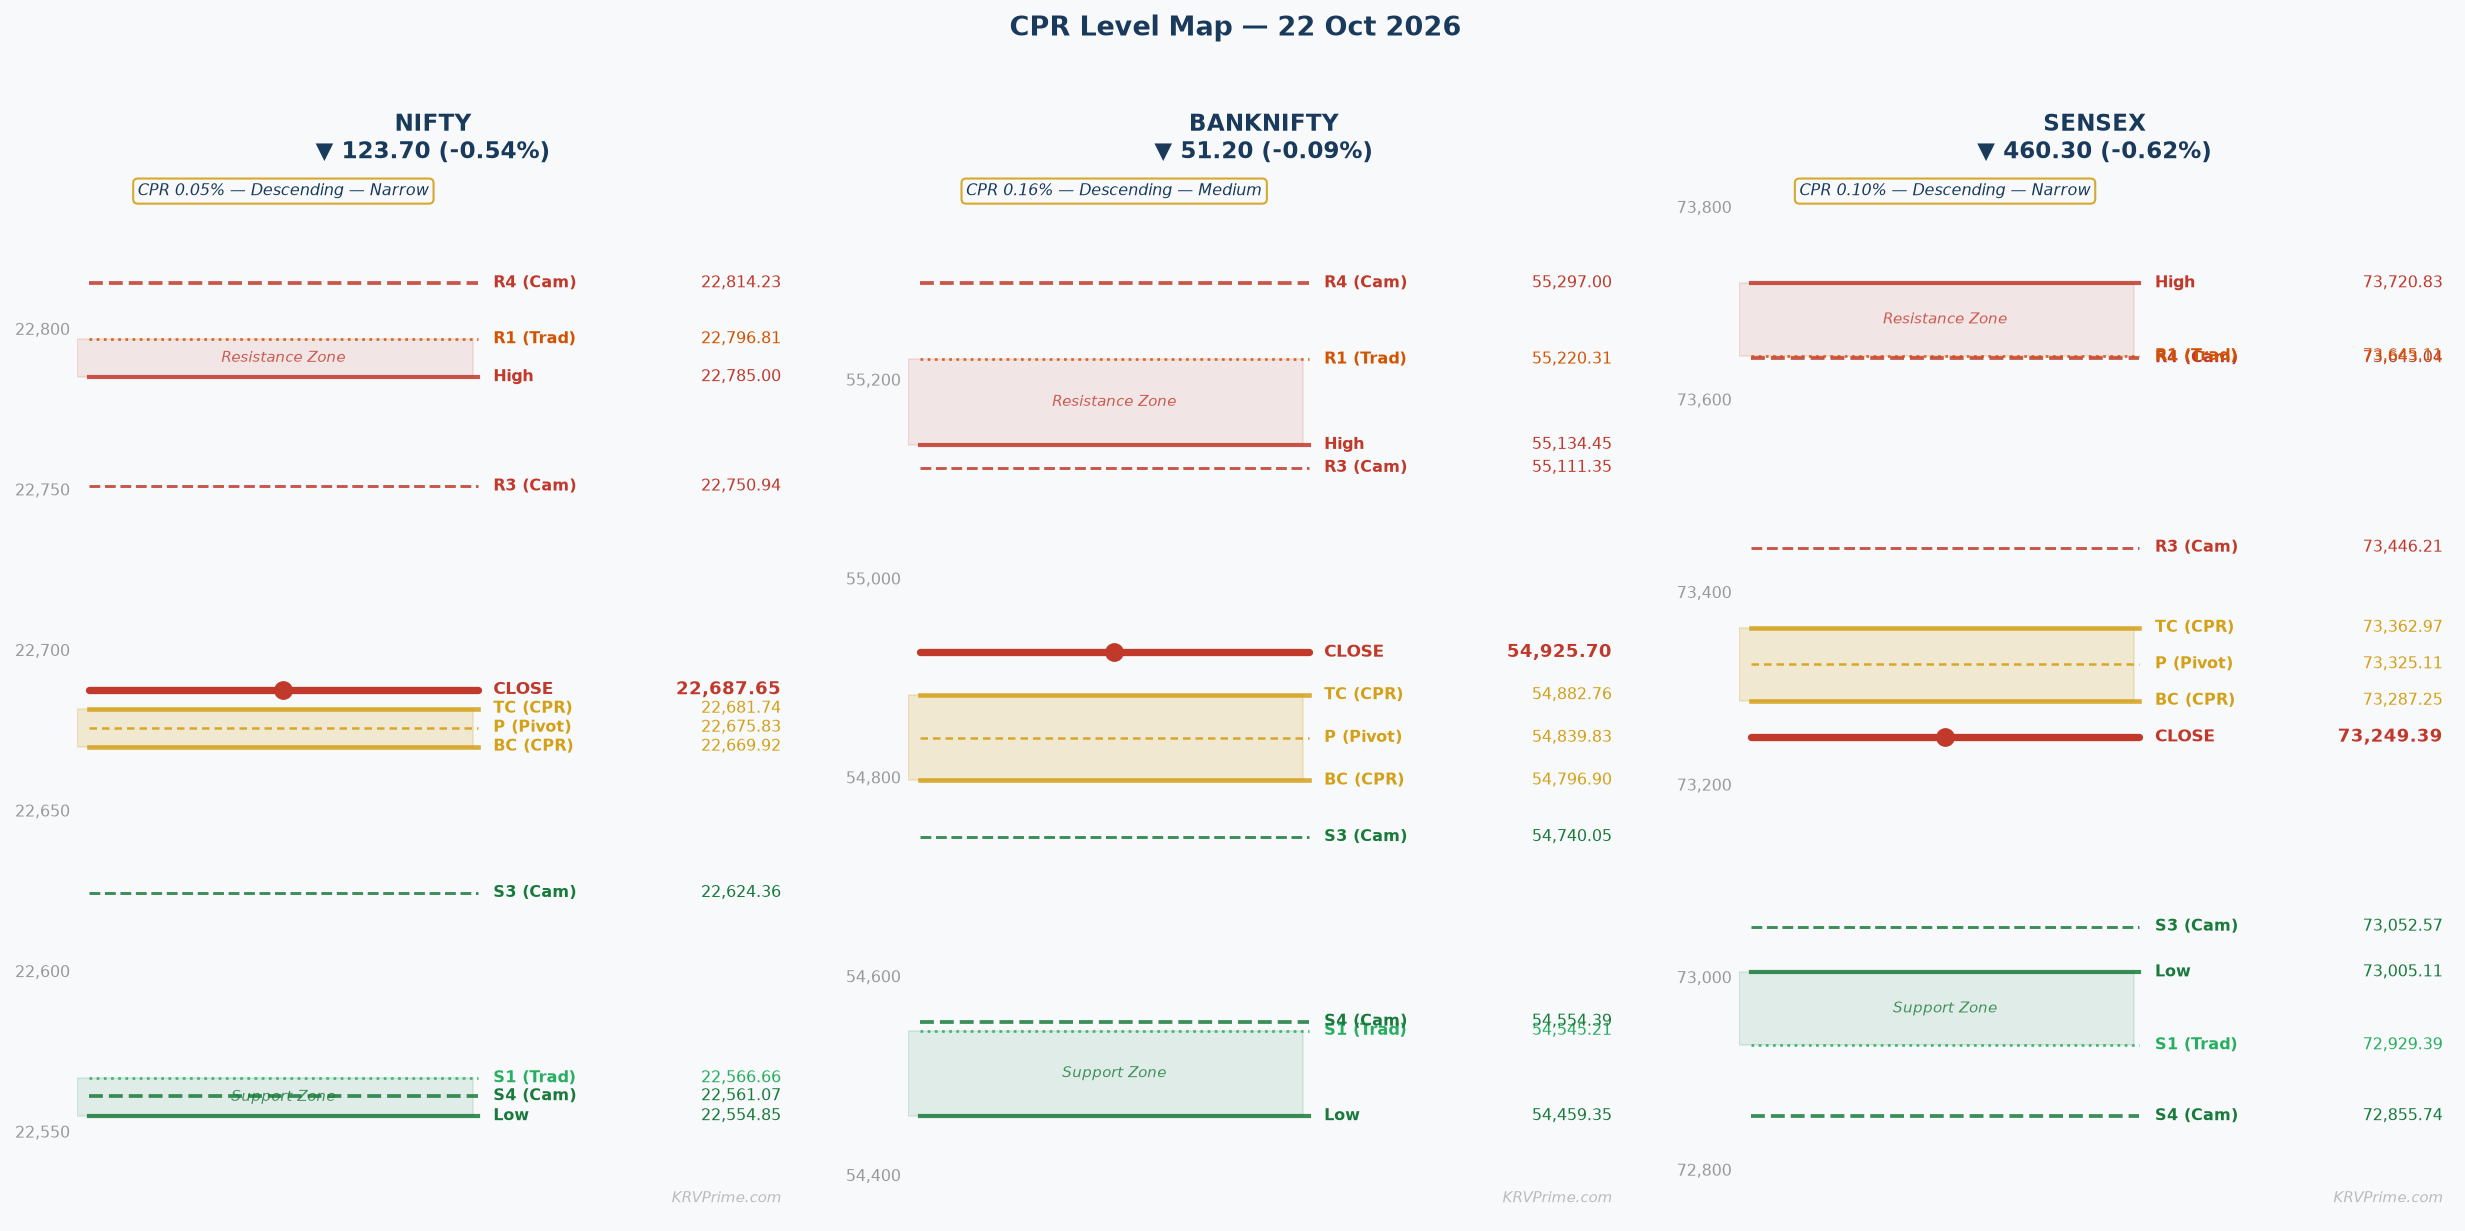
OI-R: 24,000 R3: 23,026.96 H6: 22,919.16 H5: 22,888.15 R2: 22,905.98 H4 ▶: 22,814.23 R1: 22,796.81 PDH: 22,785 H3 ↩: 22,750.94
TC: 22,681.74 P: 22,675.83 BC: 22,669.92
L3 ↩: 22,624.36 PDL: 22,554.85 S1: 22,566.66 L4 ▶: 22,561.07 S2: 22,445.68 L5: 22,487.15 L6: 22,456.14 S3: 22,336.51 OI-S: 22,000
↩ = Camarilla reversal point | ▶ = Camarilla breakout/breakdown trigger | OI-R/OI-S = Options wall (CE/PE max OI)
▲ Higher Open (Gap Up) — Open > Prev Close
▲ Bullish
Open lands: In a Descending CPR setup, a gap-up open on 23 Oct places price ABOVE TC 22,681.74 — the entire CPR band (BC 22,669.92 to TC 22,681.74) now sits below the opening price, acting as immediate support rather than resistance. This is the classic Descending CPR gap-up scenario where the CPR transforms into a launch pad if held.
CPR role: Launch pad / immediate support band — CPR (BC 22,669.92 to TC 22,681.74) transitions from overhead resistance to upside launch platform; a pullback to TC 22,681.74 and hold confirms bullish intent for the session
Minor Gap (0.05–0.25%) — Structure Dominant
A minor gap up of 0.05–0.25% places NIFTY opening between approximately 22,699 and 22,744, landing just above TC 22,681.74 but well below H3 22,750.94, meaning the open is in the no-man's land between the CPR band and the first Camarilla resistance. In this configuration, the Descending CPR structure adds a lean toward bullishness — the CPR now sits below price and acts as immediate support — but the minor gap alone is insufficient to signal a trending day, and the structure remains dominant over the gap signal. The first 15-min candle close (Narrow CPR confirmation rule) above TC 22,681.74 with hold is the trigger; initial target is H3 22,750.94, then PDH 22,785 and R1 22,796.81 — failure to hold TC on a pullback turns the open into a bull trap setup targeting L3 22,624.36.
Significant Gap (0.25–0.5%) — Balanced
A significant gap up of 0.25–0.5% opens NIFTY between approximately 22,744 and 22,801, placing price at or just above H3 22,750.94 and approaching PDH 22,785 and R1 22,796.81, meaning the gap is opening directly into the first layer of meaningful overhead resistance. Gap-fill risk is elevated here because price is stretching toward H3 22,750.94–R1 22,796.81 in the opening minutes without any base-building, and delta-hedging flows from market makers adjusting short-gamma positions can amplify both the initial spike and the subsequent pullback. The balanced approach is to wait for a 15-min candle close and retest of H3 22,750.94 as support before entering longs targeting H4 22,814.23 and R2 22,905.98; if price fails to hold H3 22,750.94 after the initial spike, the gap-fill back toward TC 22,681.74 becomes the high-probability intraday scalp.
Large Gap (>0.5%) — Gap Direction Dominant
A large gap up exceeding 0.5% opens NIFTY above approximately 22,801, potentially at or above PDH 22,785 and R1 22,796.81, making the gap dominant over all CPR signals and placing price in a zone where short-covering and momentum-chasing are the primary drivers. The probability of a full gap-fill is significantly reduced in large gap scenarios as institutional momentum desks and algo-driven breakout buyers continue to push into H4 22,814.23 and R2 22,905.98; however, if price opens above H4 22,814.23 and fails to sustain above it within the first 15 minutes, the mean-reversion case toward H3 22,750.94 and TC 22,681.74 becomes compelling. The straddle implies a 306.2-point move from ATM 22,700, so a large gap up that opens near 22,900+ would already be consuming a significant portion of the implied move, making fresh long initiation at elevated levels high-risk — the abort level for gap-up longs is a close below TC 22,681.74, and targets extend toward H5 22,888.15 and H6 22,919.16 only if H4 22,814.23 is decisively cleared.
|
▲ Upside Path → OI-R The upside path from a confirmed gap-up hold above TC 22,681.74 runs sequentially through H3 22,750.94 (Camarilla mean-reversion resistance — first partial profit zone for scalpers), then PDH 22,785 and R1 22,796.81 (traditional first target cluster where intraday swing traders should book partial profits), then H4 22,814.23 (Camarilla breakout trigger — a 15-min close above this level signals a potential trending day extension) and R2 22,905.98, with the ultimate momentum target at H5 22,888.15 and H6 22,919.16 for intraday trend riders. The OI resistance at 24,000 is far above the day's implied range and should be treated as a weekly/monthly reference rather than an intraday target — CE writing at 24,000 provides structural ceiling context but will not come into play in a single intraday session. |
▼ Downside Path → OI-S In a gap-up failure scenario where price opens above TC 22,681.74 but cannot sustain it, the failure path begins with a close below BC 22,669.92, which triggers short entries targeting L3 22,624.36 (Camarilla mean-reversion support and first bear target), followed by PDL 22,554.85 and the clustered support zone at S1 22,566.66 and L4 22,561.07 — this is a high-conviction bear target cluster where retail stop-losses below PDL can accelerate the move. A break below L4 22,561.07 opens the path toward L5 22,487.15 and L6 22,456.14, with S2 22,445.68 providing the next traditional support, while the OI support at 22,000 remains the ultimate downside floor for the current expiry cycle. |
| 🔴 OI-R: The OI resistance at **24,000** (highest CE OI for both week and month expiry) is approximately 1,312 points above the current close and 1,318 points above the ATM strike of 22,700, placing it entirely outside the straddle-implied move of 306.2 points and making it irrelevant as an intraday target for 23 Oct. However, the massive CE writing at 24,000 by option sellers creates a structural ceiling for the entire expiry cycle, meaning any rally attempts during the week will face progressively stronger call delta-hedging pressure as price approaches this level, and it should be viewed as a multi-session reference that keeps the overall market range anchored. | 🟢 OI-S: The OI support at **22,000** (highest PE OI for both week and month expiry) is approximately 687 points below the current close, also outside the straddle-implied range of 306.2 points, making it a distant support floor that will not come into play in a single session unless there is a catastrophic external shock. In a gap-up scenario specifically, 22,000 is entirely irrelevant as an intraday reference — PE writers at 22,000 are comfortable that price will not reach their strikes, and the base of PE OI at 22,000 provides medium-term structural floor context for the week/month cycle rather than any actionable intraday signal. |
⚡ Key Trigger: The primary trigger for 23 Oct in a gap-up scenario is the **first 15-min candle close above TC 22,681.74** — given the Narrow CPR width of 0.05%, a single 15-min candle is sufficient to confirm directional intent, and a sustained hold above TC 22,681.74 confirms that the Descending CPR has been conquered and the session is structurally bullish. A failure of price to sustain above TC 22,681.74 within the first 15 minutes — even after a gap-up open — signals a Descending CPR overhead resistance scenario playing out, where the gap has been absorbed but sellers are defending the CPR zone, and the trade flips to short below BC 22,669.92 targeting L3 22,624.36.
▼ Lower Open (Gap Down) — Open < Prev Close
▼ Bearish
Open lands: In a Descending CPR configuration, a gap-down open on 23 Oct places price BELOW BC 22,669.92 — and since the entire CPR band (BC 22,669.92 to TC 22,681.74) is already below yesterday's close of 22,687.65, a gap-down means price opens below the complete CPR structure, making the entire CPR band overhead resistance. This is the most bearish of the three scenarios for a Descending CPR setup.
CPR role: Overhead resistance / trap door — the CPR band (BC 22,669.92 to TC 22,681.74) now sits above the opening price and acts as a resistance ceiling; any bounce into the CPR zone is a selling opportunity unless price reclaims TC 22,681.74 with conviction
Minor Gap (0.05–0.25%) — Structure Dominant
A minor gap down of 0.05–0.25% opens NIFTY between approximately 22,631 and 22,676, placing price inside or just below the CPR band near BC 22,669.92 to P 22,675.83 — this is a critical zone because a minor gap down in a Descending CPR setup means price is still hovering near the CPR, and the first 30–60 minutes will determine whether the gap fills (reclaiming TC 22,681.74) or the bearish structure asserts itself (breaking below L3 22,624.36). Minor gaps in Descending CPR setups have a moderate fill probability because the CPR is nearby and acts as a magnetic zone, but the structure is bearish, so any bounce that stalls at BC 22,669.92 or TC 22,681.74 without closing above it is a fresh short opportunity. The bear trade setup is a 15-min close below L3 22,624.36 after failing to reclaim BC 22,669.92, targeting S1 22,566.66 and the L4 22,561.07 / PDL 22,554.85 cluster; bulls need a 15-min close above TC 22,681.74 to neutralise the gap-down structure.
Significant Gap (0.25–0.5%) — Balanced
A significant gap down of 0.25–0.5% opens NIFTY between approximately 22,574 and 22,631, placing price at or below L3 22,624.36 and critically near the clustered support zone of S1 22,566.66, PDL 22,554.85, and L4 22,561.07 — this is a high-significance opening because price is gapping into established support infrastructure. The failure-and-resume vs recovery dynamic here is clear: if the 30-min candle (Medium confirmation rule, though NIFTY is Narrow so use 15-min) fails to reclaim L3 22,624.36, it confirms a bearish breakdown and activates L4 22,561.07 and L5 22,487.15 as sequential targets, while PUT writers at these levels will begin unwinding and amplifying the downward move. Recovery trade requires a 15-min close back above L3 22,624.36 with volume confirmation, targeting a reclaim of BC 22,669.92 and P 22,675.83; the absence of VIX data makes it important to use the straddle's 306.2-point implied move as the maximum volatility envelope, with S2 22,445.68 as the lower boundary of realistic intraday risk.
Large Gap (>0.5%) — Gap Direction Dominant
A large gap down exceeding 0.5% opens NIFTY below approximately 22,574, potentially breaching the critical support cluster of S1 22,566.66, PDL 22,554.85, and L4 22,561.07 simultaneously — this is a panic-open scenario where gap-dominance overrides all CPR signals. In a large gap-down, the immediate priority is to identify whether L4 22,561.07 holds as support in the first 15 minutes, because a 15-min close below L4 22,561.07 with elevated volume signals a structured breakdown toward L5 22,487.15, L6 22,456.14, and S2 22,445.68 — the straddle PUT premiums will be monetising rapidly in this zone. Recovery targets from a large gap down are L3 22,624.36 (first resistance), then BC 22,669.92, with the abort level for any recovery trade being a close below L5 22,487.15, which would suggest the market is targeting the OI support floor at 22,000 over the coming sessions — straddle sellers should avoid initiating new positions at the open in large gap-down scenarios due to maximum gamma risk.
|
▲ Upside Path → OI-R The recovery upside path from a gap-down scenario begins with reclaiming BC 22,669.92 (bottom of CPR — converts overhead resistance to support), then P 22,675.83 (pivot midpoint — confirms recovery momentum), then TC 22,681.74 (top of CPR — full CPR reclaim triggers short-covering), then H3 22,750.94 (Camarilla mean-reversion target — first genuine upside objective post-recovery) and PDH 22,785 / R1 22,796.81 (traditional first resistance and key partial profit zone for recovery longs). Each level in this path must hold as support on any retest to confirm genuine recovery rather than a dead-cat bounce engineered by stop-loss hunting above BC 22,669.92. |
▼ Downside Path → OI-S The bear continuation path from a gap-down failure to reclaim CPR runs from below BC 22,669.92 through L3 22,624.36 (Camarilla mean-reversion downside zone — first systematic sell target where retail long stop-losses cluster), then PDL 22,554.85 / S1 22,566.66 / L4 22,561.07 (triple-confluence support zone — breakdown below this activates L5 22,487.15 and accelerates the move), then L5 22,487.15 and L6 22,456.14 with S2 22,445.68 providing the traditional second support. The OI support at 22,000 remains the ultimate floor for the expiry cycle, and PE writers at that level will begin defending aggressively if price approaches 22,200–22,300 in subsequent sessions. |
| 🔴 OI-R: In a gap-down scenario, the OI resistance at **24,000** is even further removed from intraday price action and serves purely as a psychological ceiling confirming that the options market's major supply is positioned far above current levels — this means option sellers are not under gamma pressure and are unlikely to fuel any additional hedging-driven selling near current prices. The 24,000 CE wall's primary role in a gap-down session is to confirm that the market's structural ceiling is intact and that any bounce will meet progressively stronger resistance well before reaching significant CE OI concentration, keeping bulls anchored near the CPR and Camarilla levels rather than targeting distant resistance. | 🟢 OI-S: The OI support at **22,000** becomes the most critical reference in a sustained gap-down scenario — PE writers at 22,000 have accumulated significant exposure and will defend this level through delta-hedging (buying futures as price falls), creating a natural support buffer approximately 687 points below current close. If intraday selling pressure pushes toward the 22,200–22,300 zone during the session, PE writers will begin delta-adjusting, potentially triggering a sharp mean-reversion bounce — traders should watch for accelerating PUT premium expansion below L5 22,487.15 as an early signal that the market is beginning to price in a move toward the 22,000 OI support floor. |
⚡ Key Trigger: The primary trigger in a gap-down scenario is **failure to reclaim BC 22,669.92 within the first 15 minutes (Narrow CPR rule)** — if price opens below the CPR and the first 15-min candle cannot close above BC 22,669.92, the Descending CPR overhead resistance is confirmed and the bear thesis is active, targeting L3 22,624.36, then L4 22,561.07. The bull trigger — the recovery scenario — requires a 15-min close **above TC 22,681.74**, which represents a full reclaim of the Descending CPR band and neutralises the bearish opening structure, shifting the day's bias toward a mean-reversion recovery targeting H3 22,750.94 and PDH 22,785.
◆ Near Flat Open — Open ≈ Prev Close (±0.05%)
◆ Neutral
Open lands: A flat open of ±0.05% from yesterday's close of 22,687.65 places NIFTY opening between approximately 22,676 and 22,699 — in the Descending CPR configuration, the flat open lands squarely at or just above TC 22,681.74, which is the exact scenario the CPR framework predicts: 'Flat = near prev_close = at or near TC, CPR = resistance below.' This makes the flat-open the most information-rich and high-probability scenario for 23 Oct.
CPR role: Decision zone / compression launch pad — the ultra-narrow CPR band of just 11.82 points (BC 22,669.92 to TC 22,681.74) is a compression band where the first directional 15-min close defines the entire session's structure; this is a textbook trend-day setup
Near Flat (±0.05%)
A flat open in a Descending Narrow CPR setup is the highest-probability trend-day configuration available in F&O technical analysis — the CPR width of just 0.05% (11.82 points) means that the market's short-term supply-demand equilibrium is in an extreme compression state, and the first 15-min candle will act as a coiled spring release that defines the session's dominant direction with very high confidence. The specific CPR values — TC 22,681.74 and BC 22,669.92 — create a 11.82-point decision band where price will spend minimal time before committing directionally: a 15-min close above TC 22,681.74 means bulls have conquered the Descending CPR overhead resistance and the session is structurally bullish, while a 15-min close below BC 22,669.92 means bears have confirmed the Descending CPR's bearish architecture and the breakdown is validated. In Narrow CPR setups (width ≤0.10%), trend-day probability is statistically elevated because the compressed equilibrium represents a market where participants are in maximum indecision, and the resolution — when it comes — tends to produce a clean directional sweep rather than a choppy range session; with NIFTY's trending market structure already flagged in the data, this compression is occurring within an established directional context, making the eventual breakout more likely to align with the prevailing trend. The dual trigger framework for 23 Oct flat open is: Bull trigger = **first 15-min candle close above TC 22,681.74** targeting H3 22,750.94, R1 22,796.81, H4 22,814.23, and ultimately R2 22,905.98 with max pain at 22,850 acting as a gravitational pull; Bear trigger = **first 15-min candle close below BC 22,669.92** targeting L3 22,624.36, L4 22,561.07, S1 22,566.66, and the PDL 22,554.85 cluster — in both cases, NEVER initiate the trade until the 15-min candle has fully closed outside the CPR band.
|
▲ Upside Path → OI-R From a confirmed bull trigger (15-min close above TC 22,681.74), the upside path runs through H3 22,750.94 (Camarilla mean-reversion resistance — first partial profit for scalpers, book 30–40% of position here), then PDH 22,785 and R1 22,796.81 (traditional first target cluster — second partial profit zone at approximately 115 points above TC), then H4 22,814.23 (Camarilla breakout trigger — a 15-min close above this activates H5 22,888.15 and H6 22,919.16 as the intraday extended targets), with max pain at 22,850 acting as the gravitational pull for option sellers who will actively defend their positions near that level and potentially amplify the move toward it. The OI resistance at 24,000 is the weekly/monthly ceiling and is not an intraday target for this session. |
▼ Downside Path → OI-S From a confirmed bear trigger (15-min close below BC 22,669.92), the downside path runs through L3 22,624.36 (Camarilla mean-reversion downside zone — first systematic sell target and partial profit level for intraday shorts), then the high-significance triple-confluence zone of PDL 22,554.85 / S1 22,566.66 / L4 22,561.07 (where retail stop-losses and PUT delta-hedging flows concentrate — breakdown below L4 22,561.07 triggers L5 22,487.15 and L6 22,456.14 as the extended downside targets within the straddle's implied 306.2-point move envelope). The OI support at 22,000 is the ultimate floor for the expiry cycle and would only be tested in a multi-session trending breakdown scenario well beyond the scope of a single intraday session. |
| 🔴 OI-R: The OI resistance at **24,000** (maximum CE OI for both week and month expiry) serves as the structural ceiling for the entire expiry cycle, and in a flat-open scenario its role is to cap the maximum upside ambition for bulls across multiple sessions — CE writers at 24,000 are extremely comfortable with the current price location approximately 1,312 points below their strike, meaning they will not initiate defensive delta-hedging unless price begins a multi-day trending move toward 23,500+, and their presence provides psychological assurance that the broader market range is anchored well above current levels. Intraday traders should use 24,000 as context for understanding that the market's primary options-driven resistance is distant, meaning intraday moves toward R1 22,796.81, R2 22,905.98, and R3 23,026.96 can proceed without hitting major CE writing walls. | 🟢 OI-S: The OI support at **22,000** (maximum PE OI for both week and month expiry) is the primary floor for the current expiry cycle, positioned approximately 687 points below yesterday's close, and in a flat-open scenario its role is to confirm that PE writers are comfortable with the current price location and are not aggressively hedging — this means the downside has a safety net at 22,000 that will create natural buying support as price approaches through delta-adjustments by PUT sellers. For a flat-open intraday session, 22,000 is not an actionable target but provides crucial context: as long as NIFTY remains above 22,300 (the outer straddle boundary), PUT writers at 22,000 are inactive, and the day's downside targets remain bounded by L5 22,487.15 and L6 22,456.14 within the 306.2-point implied move envelope. |
⚡ Key Trigger: The exact structural fulcrum for 23 Oct flat-open is the **first 15-min candle close above TC 22,681.74 for bulls or below BC 22,669.92 for bears** — given the Narrow CPR width of 0.05%, the Narrow confirmation rule requires only a single 15-min candle close to confirm direction, and this is non-negotiable because premature entries inside the 11.82-point CPR band will be stopped out by the compression noise. The market psychology driving this level is straightforward: option sellers, scalpers, and systematic algorithms all have their directional triggers clustered around this 11.82-point band, meaning that once one side's stop-losses are triggered, a cascade of orders amplifies the initial move — making the first 15-min close outside the CPR band a self-fulfilling prophecy of sorts.
BANKNIFTY
Descending — Medium (0.16%)
▼ Bearish
Market Structure Balanced or transitional | Straddle ATM 54900 straddle = 804.7 pts (Call 420.1 + Put 384.6), implying an expected intraday move of approximately ±805 pts, placing the upper range near 55,705 and lower range near 54,095 from the ATM strike — a significantly wider expected move relative to NIFTY, reflecting BANKNIFTY's inherent volatility | Max Pain Max Pain at 55,500 for the 27-Oct-2026 month expiry, sitting 574.30 points above yesterday's close of 54,925.70 — this substantial gap between current price and max pain creates strong upward gravitational pull from option sellers who have significant P&L at risk, suggesting dip-buying appetite from institutional participants defending their short-PUT positions near the 55,000–55,500 zone |
Tomorrow's Complete Level Map
OI-R: 56,000 R3: 55,895.41 H6: 55,606.58 H5: 55,513.84 R2: 55,514.93 H4 ▶: 55,297 R1: 55,220.31 PDH: 55,134.45 H3 ↩: 55,111.35
TC: 54,882.76 P: 54,839.83 BC: 54,796.90
L3 ↩: 54,740.05 PDL: 54,459.35 S1: 54,545.21 L4 ▶: 54,554.39 S2: 54,164.73 L5: 54,337.54 L6: 54,244.82 S3: 53,870.11 OI-S: 52,000
↩ = Camarilla reversal point | ▶ = Camarilla breakout/breakdown trigger | OI-R/OI-S = Options wall (CE/PE max OI)
▲ Higher Open (Gap Up) — Open > Prev Close
▲ Bullish
Open lands: In a Descending CPR setup for BANKNIFTY, a gap-up open on 23 Oct places price ABOVE TC 54,882.76 — since the entire CPR band (BC 54,796.90 to TC 54,882.76) sits below yesterday's close of 54,925.70, a gap-up open above the close means price is also above the complete CPR structure, making the CPR band immediate support below the open. The Descending CPR has been overcome at the open itself, creating a bullish initial configuration.
CPR role: Launch pad / immediate support band — CPR (BC 54,796.90 to TC 54,882.76) sits below the gap-up opening price and acts as the primary support zone; the 85.86-point wide Medium CPR means retests back into the band are expected and should be used as entry opportunities rather than treated as failures
Minor Gap (0.05–0.25%) — Structure Dominant
A minor gap up of 0.05–0.25% opens BANKNIFTY between approximately 54,952 and 55,063, placing price above TC 54,882.76 but below H3 55,111.35 — the first 30-minute candle (Medium CPR confirmation rule) will determine whether this gap-up hold is genuine or a fakeout, as the 85.86-point CPR band (BC 54,796.90 to TC 54,882.76) acts as an intermediate support that will be retested during the first 30 minutes. The Descending CPR structure confirms a bullish lean when price holds above TC 54,882.76, but Medium width dictates that retests of TC 54,882.76 are expected and healthy — traders should use a 30-min close above TC 54,882.76 as the confirmation trigger rather than chasing the gap at the open. The first target from a confirmed hold above TC 54,882.76 is H3 55,111.35, then PDH 55,134.45 and R1 55,220.31 (traditional first target — first partial profit zone); if H3 55,111.35 rejects on the first touch, a pullback to P 54,839.83 and TC 54,882.76 for a higher-low retest is the optimal re-entry pattern.
Significant Gap (0.25–0.5%) — Balanced
A significant gap up of 0.25–0.5% opens BANKNIFTY between approximately 55,063 and 55,200, placing price at or near H3 55,111.35 and PDH 55,134.45 simultaneously — this is a high-risk opening position because price is gapping directly into the Camarilla mean-reversion zone and the previous day's high, both of which are natural overhead resistance levels where institutional sellers will initiate short positions. Gap-fill risk is significant here: price has covered 55,111.35 to 55,200 at the open without any consolidation, and the Medium CPR's first 30-min confirmation rule is especially important — a 30-min candle that fails to close above PDH 55,134.45 with volume suggests the gap was a fakeout and a gap-fill toward TC 54,882.76 and BC 54,796.90 is imminent. The delta-hedging dynamic here is notable: as BANKNIFTY gaps into PDH 55,134.45, call option writers at R1 55,220.31 and H4 55,297 will begin defensive hedging by buying futures, temporarily adding fuel to the rally, but this effect reverses sharply if price fails to sustain above PDH 55,134.45 and the delta unwind adds selling pressure back toward TC 54,882.76.
Large Gap (>0.5%) — Gap Direction Dominant
A large gap up exceeding 0.5% opens BANKNIFTY above approximately 55,200, placing price at or above PDH 55,134.45 and R1 55,220.31, potentially approaching H4 55,297 — in this scenario, gap dominance takes full precedence and the session is structurally bullish, with the primary question being whether the gap triggers a continuing momentum move or a sharp mean-reversion. The key upside targets from a large gap-up are H4 55,297 (Camarilla breakout trigger — a 30-min close above here is required for Medium CPR confirmation of a breakout day), R2 55,514.93 and H5 55,513.84 (near-identical high-confluence resistance zone approximately 312 points above R1 — the most important resistance cluster for intraday BANKNIFTY trading on 23 Oct), and ultimately H6 55,606.58 and R3 55,895.41 as extended targets approaching the OI resistance at 56,000. The straddle-implied move of 804.7 points from ATM 54,900 places the upper bound near 55,705, making H6 55,606.58 and R3 55,895.41 the outer limits of the implied range — abort large-gap longs below TC 54,882.76 and note that max pain at 55,500 creates a gravitational target for the large gap-up session.
|
▲ Upside Path → OI-R The confirmed upside path from a gap-up hold above TC 54,882.76 progresses through H3 55,111.35 (Camarilla mean-reversion resistance — first partial profit for scalpers, book 25–30% here given Medium CPR expectation of retests), PDH 55,134.45 (previous session high — second partial profit trigger), R1 55,220.31 (traditional first resistance target — book second partial here), then H4 55,297 (Camarilla breakout trigger — 30-min close above required for trend extension), and the critical confluence zone of R2 55,514.93 / H5 55,513.84 (within 1 point of each other — maximum intraday resistance cluster and optimal profit-booking zone for intraday traders), with H6 55,606.58 and OI resistance at 56,000 as the terminal upside reference. Max pain at 55,500 aligns almost perfectly with the R2/H5 confluence at 55,513.84–55,514.93, confirming this as the session's highest-probability reversal zone for gap-up longs. |
▼ Downside Path → OI-S A gap-up failure below BC 54,796.90 activates the downside path through L3 54,740.05 (Camarilla mean-reversion downside reference — first bear target and partial profit for shorts), then the PDL 54,459.35 / S1 54,545.21 / L4 54,554.39 support cluster (a triple-confluence zone that must hold to prevent a trending breakdown — retail stop-losses below this level accelerate the move rapidly), then L5 54,337.54 and L6 54,244.82 with S2 54,164.73 as the next traditional support, and ultimately S3 53,870.11 approaching the outer boundary of the straddle's downside implied range of approximately 54,095. The OI support at 52,000 is the major PUT writing floor for the month expiry and will only be approached in a sustained multi-session bearish move. |
| 🔴 OI-R: The OI resistance at **56,000** (highest CE OI for BANKNIFTY month expiry) is approximately 1,074 points above yesterday's close and 1,100 points above ATM 54,900, placing it just above the straddle's upper implied boundary of approximately 55,705 — this means the 56,000 CE wall is at the very edge of the 804.7-point implied move, creating a scenario where a sustained large gap-up day could actually approach CE writer territory near 55,706+ and trigger defensive delta-hedging from CE writers that temporarily accelerates the upside. The 56,000 CE resistance is the primary ceiling for the month expiry, and any intraday move toward H6 55,606.58 and R3 55,895.41 will encounter progressively stronger gamma resistance from CE writers defending their positions below 56,000. | 🟢 OI-S: The OI support at **52,000** (highest PE OI for BANKNIFTY month expiry) is approximately 2,925 points below yesterday's close and entirely outside the straddle-implied range of 804.7 points — in a gap-up scenario, 52,000 is completely irrelevant as an intraday reference and simply provides the medium-term floor context confirming that PE writers are extremely comfortable with current price levels and are not in any gamma-pressure zone. The 52,000 PE base's primary significance is psychological: it tells intraday traders that there is a substantial options-derived safety net far below current prices, meaning institutional PUT sellers will not begin defensive buying until price drops below approximately 53,500–54,000, giving bears room to work between TC 54,882.76 and L5 54,337.54 without triggering reflexive PE-writer support. |
⚡ Key Trigger: For BANKNIFTY gap-up scenarios, the **first 30-min candle close above TC 54,882.76** is the confirmation trigger (Medium CPR width 0.16% requires 30-min confirmation), and this is the structural fulcrum because a 30-min close above TC 54,882.76 confirms that the gap-up is not a fakeout and that the Descending CPR overhead resistance has been converted into support — at this point, institutional buyers who were waiting for confirmation will initiate fresh longs targeting H3 55,111.35 and PDH 55,134.45. If the first 30-min candle fails to sustain above TC 54,882.76 after a gap-up open, this signals a bull trap where the gap has been absorbed by waiting sellers, and the trade reverses to short below BC 54,796.90 targeting L3 54,740.05 and L4 54,554.39 — this failure pattern is particularly dangerous because gap-up traders who are stopped out below BC 54,796.90 become forced sellers who amplify the downside move.
▼ Lower Open (Gap Down) — Open < Prev Close
▼ Bearish
Open lands: In a Descending CPR configuration for BANKNIFTY, a gap-down open on 23 Oct places price BELOW BC 54,796.90 — and since the entire CPR band (BC 54,796.90 to TC 54,882.76) already sits below yesterday's close of 54,925.70, a gap-down open means price launches below the complete CPR structure, establishing the full CPR band as overhead resistance for the session. This is the most structurally bearish configuration for BANKNIFTY on 23 Oct.
CPR role: Overhead resistance / recovery ceiling — the 85.86-point CPR band (BC 54,796.90 to TC 54,882.76) sits above the gap-down opening price; any bounce that stalls inside the CPR band or below TC 54,882.76 is a selling opportunity, while only a 30-min close above TC 54,882.76 neutralises the bearish structure
Minor Gap (0.05–0.25%) — Structure Dominant
A minor gap down of 0.05–0.25% opens BANKNIFTY between approximately 54,788 and 54,843, placing price inside the CPR band itself — between BC 54,796.90 and P 54,839.83 — which is a nuanced and important position because price is technically inside a Descending CPR rather than below it, creating a brief period of ambiguity before the 30-min candle resolves direction. In Minor gap-down scenarios where the open is inside the CPR band, the CPR acts as a decision zone rather than pure resistance, and the 30-min candle will determine whether buyers use BC 54,796.90 as support to push toward TC 54,882.76 (gap-fill attempt) or whether price breaks below BC 54,796.90 decisively to trigger the bear case targeting L3 54,740.05. The specific bear setup is a 30-min close below BC 54,796.90 after failing to reach TC 54,882.76, targeting L3 54,740.05 first, then the PDL 54,459.35 / S1 54,545.21 / L4 54,554.39 triple-confluence zone — the bull setup requires a 30-min close above TC 54,882.76 to reclaim the full CPR and target H3 55,111.35.
Significant Gap (0.25–0.5%) — Balanced
A significant gap down of 0.25–0.5% opens BANKNIFTY between approximately 54,650 and 54,788, placing price below BC 54,796.90 and approaching the proximity of L3 54,740.05 — a meaningful break of the CPR floor that puts the Descending CPR structure firmly in control and positions the entire CPR band as overhead resistance. The failure-and-resume dynamic here requires two analytical steps using the Medium CPR's 30-min confirmation rule: first, check if the opening 30-min candle can recover above BC 54,796.90 (if yes, it's a recovery trade toward TC 54,882.76); second, if BC 54,796.90 is not recovered in 30 minutes, the bear case accelerates through L3 54,740.05 toward the PDL 54,459.35 / L4 54,554.39 / S1 54,545.21 cluster. PUT writers at S1 54,545.21 and L4 54,554.39 will begin selective unwinding below the PDL 54,459.35, creating temporary air pockets that can produce sharp 200–300 point moves in BANKNIFTY futures — this is the straddle PUT premium monetisation window, and options traders should consider taking partial profits on PUT positions at the L4/S1 cluster.
Large Gap (>0.5%) — Gap Direction Dominant
A large gap down exceeding 0.5% opens BANKNIFTY below approximately 54,650, potentially reaching toward L3 54,740.05 or even L4 54,554.39 at the open — this is a panic-open scenario where gap dominance overrides the CPR framework and the session becomes a volatility event driven by external news flows. In a large gap-down, the critical support test is at L4 54,554.39 / S1 54,545.21 / PDL 54,459.35 — if this triple-confluence zone holds within the first 30 minutes (Medium CPR confirmation window), a sharp recovery bounce of 300–400 points is plausible toward the CPR band and H3 55,111.35; if L4 54,554.39 fails on the first test with high volume, the path to L5 54,337.54, L6 54,244.82, and S2 54,164.73 opens rapidly within the straddle's 804.7-point implied downside envelope of approximately 54,095 from ATM 54,900. Straddle positions initiated prior to this gap-down will be significantly profitable on the PUT side, and the priority is to monetise PUT premiums at L4/S1 cluster rather than over-holding for S2 54,164.73 in a single session — the max pain gravitational pull at 55,500 also suggests that any session-opening panic may find recovery buyers entering aggressively below 54,700.
|
▲ Upside Path → OI-R The recovery upside path from a gap-down scenario (assuming 30-min close above TC 54,882.76) progresses through P 54,839.83 (pivot — confirms recovery momentum), TC 54,882.76 (top of CPR — full CPR reclaim triggers short-covering cascade), H3 55,111.35 (Camarilla mean-reversion target — first genuine upside objective and partial profit zone for recovery trades), PDH 55,134.45 (previous session high — second partial profit zone), and R1 55,220.31 (traditional first resistance — final target for conservative recovery traders). Each level must hold as support on any retest to confirm the recovery is structural rather than a bear-market dead-cat bounce, and the Balanced market structure means that recovery attempts may face multiple retests before sustaining directional momentum. |
▼ Downside Path → OI-S The bear continuation path from confirmed CPR resistance (failure to reclaim BC 54,796.90) runs from below BC 54,796.90 through L3 54,740.05 (Camarilla mean-reversion downside zone — first partial profit for bears initiated at open), then the high-significance triple-confluence zone of PDL 54,459.35 / S1 54,545.21 / L4 54,554.39 (where retail long stop-losses, PUT delta-hedging unwinds, and momentum stops all cluster simultaneously — breakdown below L4 54,554.39 triggers algorithmic selling toward L5 54,337.54 and L6 54,244.82), with S2 54,164.73 as the straddle-implied lower boundary target for the session. The OI support at 52,000 is the month-expiry floor and will not be tested intraday, but its presence provides context that sustained selling below 54,000 in subsequent sessions would start activating PE writer defensive buying. |
| 🔴 OI-R: In a gap-down scenario, the OI resistance at **56,000** is even further removed from intraday price action — at over 1,074 points above yesterday's close — and its role is to confirm that the market's structural CE writing wall is well above any intraday recovery target, meaning short-covering bounces will not face meaningful CE-writer gamma pressure before reaching H3 55,111.35 and R1 55,220.31. The 56,000 CE wall provides psychological comfort to recovery buyers who can pursue the upside toward R1 55,220.31, R2 55,514.93, and H5 55,513.84 without worrying about a CE-writer-driven reversal — the primary resistance for recovery trades is the CPR band itself (BC 54,796.90 to TC 54,882.76), not the distant OI resistance. | 🟢 OI-S: The OI support at **52,000** (highest PE OI for BANKNIFTY month expiry) is approximately 2,925 points below current close, but its significance in a large gap-down scenario is elevated because it defines the absolute maximum downside tolerance for PUT sellers — as price moves toward 53,500–54,000 in a sustained downtrend, PE writers at 52,000 will initiate significant delta-hedging by buying BANKNIFTY futures, creating a natural support buffer well before the 52,000 strike is reached. In a minor or significant gap-down intraday session, 52,000 remains entirely outside the straddle-implied range of 804.7 points, but it provides critical context: the 52,000 PE base means BANKNIFTY has substantial institutional support on every dip below 54,000, and aggressive short-sellers should be cautious about over-extending bearish positions below L5 54,337.54 as PE writers may step in to defend. |
⚡ Key Trigger: In a gap-down scenario for BANKNIFTY, the primary trigger is **failure to reclaim BC 54,796.90 within the first 30 minutes (Medium CPR confirmation rule)** — if the first 30-min candle closes below BC 54,796.90, the Descending CPR overhead resistance is fully active and the bear thesis is confirmed, targeting L3 54,740.05, PDL 54,459.35, L4 54,554.39, and S1 54,545.21 in sequence. The bull recovery trigger requires a **30-min close above TC 54,882.76**, which represents a complete reclaim of the Descending CPR band and invalidates the gap-down bearish structure — at this point, short-covering flows from trapped bears who sold the gap-down will amplify the recovery toward H3 55,111.35 and PDH 55,134.45, making the recovery trade particularly explosive if triggered.
◆ Near Flat Open — Open ≈ Prev Close (±0.05%)
◆ Neutral
Open lands: A flat open of ±0.05% from yesterday's close of 54,925.70 places BANKNIFTY opening between approximately 54,898 and 54,953 — in the Descending CPR configuration, the flat open lands above TC 54,882.76, confirming the framework's prediction: 'Flat = near prev_close = at or near TC, CPR = resistance below.' Price is hovering just above the top of the Descending CPR, making the TC 54,882.76 the single most critical level for 23 Oct.
CPR role: Decision zone with immediate support at TC 54,882.76 — the 85.86-point Medium CPR band (BC 54,796.90 to TC 54,882.76) sits just below the flat open and acts as a compression band; the first 30-min candle determines whether TC becomes a launch pad (bullish hold) or a trap door (bearish breach)
Near Flat (±0.05%)
A flat open in a Descending Medium CPR setup is a high-information intraday setup for BANKNIFTY — price is opening at or just above TC 54,882.76, the top of a Descending CPR band, which means it is in the precise location where the CPR framework predicts the highest structural tension between bulls and bears in a Descending configuration. The specific CPR values — TC 54,882.76 and BC 54,796.90 — create an 85.86-point decision band where the first 30-minute candle (Medium CPR width 0.16% requires 30-min confirmation, NOT 15-min) is the definitive directional arbiter: a 30-min close above TC 54,882.76 means bulls have defended the flat open and the Descending CPR overhead resistance has been conquered, opening the path to H3 55,111.35 and PDH 55,134.45; a 30-min close below BC 54,796.90 means bears have driven price below the full CPR structure, validating the Descending CPR bearish architecture and targeting L3 54,740.05. Medium CPR width (0.16%) means the session is less likely to be a pure trend day compared to NIFTY's Narrow CPR — retests of the CPR band are expected even after an initial directional break, and the Balanced or transitional market structure reinforces this expectation of multiple price oscillations before a sustained trend emerges. The dual trigger framework for 23 Oct BANKNIFTY flat open: Bull trigger = **30-min candle close above TC 54,882.76** targeting H3 55,111.35, PDH 55,134.45, R1 55,220.31, H4 55,297, and the high-confluence R2/H5 zone at 55,513.84–55,514.93 (also near max pain at 55,500); Bear trigger = **30-min candle close below BC 54,796.90** targeting L3 54,740.05, then L4 54,554.39 / S1 54,545.21 / PDL 54,459.35 triple-confluence zone — wait for the full 30-min candle to close before initiating any directional trade.
|
▲ Upside Path → OI-R From a confirmed bull trigger (30-min close above TC 54,882.76), the upside path for BANKNIFTY runs through H3 55,111.35 (Camarilla mean-reversion resistance — first partial profit zone for scalpers at approximately 229 points above TC, book 30% here), PDH 55,134.45 (previous session high — second partial profit for intraday traders), R1 55,220.31 (traditional first target — book second partial, approximately 338 points above TC), H4 55,297 (Camarilla breakout trigger — 30-min close above activates extended targets), and the critical R2 55,514.93 / H5 55,513.84 near-identical confluence zone (highest-probability intraday reversal zone for bulls, aligned with max pain at 55,500 — this is where options writers will defend aggressively and the day's upside is most likely to exhaust). The OI resistance at 56,000 is the ultimate ceiling for the month expiry. |
▼ Downside Path → OI-S From a confirmed bear trigger (30-min close below BC 54,796.90), the downside path runs through L3 54,740.05 (Camarilla mean-reversion downside zone — first partial profit for bears, approximately 57 points below BC), then the high-significance triple-confluence support at PDL 54,459.35 / L4 54,554.39 / S1 54,545.21 (where retail stop-losses below PDL, PUT delta-hedging flows, and momentum algorithm triggers concentrate — this is the primary bear target zone for 23 Oct, offering approximately 338–400 points of downside from TC 54,882.76), and then L5 54,337.54 and L6 54,244.82 as extended targets within the straddle's 804.7-point implied downside range of approximately 54,095 from ATM 54,900. The Balanced market structure increases the probability that the L4/S1 cluster will provide at least a temporary bounce before any further extension, so bears should book meaningful profits at L4 54,554.39. |
| 🔴 OI-R: The OI resistance at **56,000** (maximum CE OI for BANKNIFTY month expiry) is positioned approximately 1,074 points above current price in a flat-open scenario, sitting above the straddle's upper implied boundary of approximately 55,705 — in a flat-open session, 56,000 is not an intraday target but serves as the structural ceiling that CE writers are defending for the month expiry, meaning that any intraday move toward H6 55,606.58 and R3 55,895.41 will encounter mounting gamma resistance from CE writers who will short futures to hedge their exposure as BANKNIFTY approaches 55,700–56,000. For flat-open intraday trading, the actionable OI reference on the upside is the R2/H5 confluence at 55,513.84–55,514.93 (aligned with max pain 55,500), not 56,000. | 🟢 OI-S: The OI support at **52,000** (maximum PE OI for BANKNIFTY month expiry) is approximately 2,925 points below the flat-open price and is entirely outside the straddle's 804.7-point implied range — it is not an actionable intraday target but provides critical structural context confirming that PUT writers are extremely comfortable with current price levels and will only begin defensive delta-buying if price drops below approximately 53,500 over multiple sessions. For the flat-open intraday session, the relevant downside reference is the straddle's lower implied boundary near 54,095, the L5 54,337.54 / L6 54,244.82 Camarilla zone, and S2 54,164.73 — not 52,000, which remains a month-expiry floor reference for portfolio-level risk management rather than intraday trading. |
⚡ Key Trigger: The exact structural fulcrum for 23 Oct BANKNIFTY flat-open is the **first 30-min candle close above TC 54,882.76 for bulls or below BC 54,796.90 for bears** — the Medium CPR width of 0.16% mandates 30-min confirmation (not 15-min), and this distinction is critical because BANKNIFTY's intraday volatility means false breaks of the CPR band within the first 15 minutes are common, and premature entries often result in stop-outs before the genuine directional move begins. The market psychology at this level is driven by the proximity to TC 54,882.76: institutional desks, HFT algorithms, and options market-makers all have their directional models anchored to the CPR pivot zone, meaning the 30-min candle close is the consensus confirmation signal that triggers a wave of aligned orders and creates the characteristic BANKNIFTY trending move of 300–500 points in the confirmed direction.
SENSEX
Descending — Narrow (0.10%)
▼ Bearish
Market Structure Trending (up or down trend) | Straddle ATM 73200 month straddle = 1306.95 pts (Call 781.95 + Put 525.0), implying a significant expected move of approximately ±1307 pts for the month expiry; the week straddle at ATM 73200 is only 49.35 pts (Call 49.3 + Put 0.05), suggesting near-zero remaining time value on the week expiry — note the SENSEX week expiry appears to have been on 22 Oct 2026 (max pain data confirms 22-Oct expiry), meaning the week Put premium of 0.05 reflects an essentially expired contract | Max Pain SENSEX week max pain at 73,300 (expiry 22-Oct-2026 — already expired as of yesterday's close); SENSEX month max pain at 73,500 (expiry 29-Oct-2026), sitting 250.61 points above yesterday's close of 73,249.39 — the month max pain creates upward gravitational pull toward 73,500, suggesting option sellers will support dips toward 73,000 and resist rallies above 73,500 during the remaining week of the month expiry |
Tomorrow's Complete Level Map
OI-R: 73,300 R3: 74,360.83 H6: 73,967.50 H5: 73,872.94 R2: 74,040.83 H4 ▶: 73,643.04 R1: 73,645.11 PDH: 73,720.83 H3 ↩: 73,446.21
TC: 73,362.97 P: 73,325.11 BC: 73,287.25
L3 ↩: 73,052.57 PDL: 73,005.11 S1: 72,929.39 L4 ▶: 72,855.74 S2: 72,609.39 L5: 72,625.84 L6: 72,531.28 S3: 72,213.67 OI-S: 73,000
↩ = Camarilla reversal point | ▶ = Camarilla breakout/breakdown trigger | OI-R/OI-S = Options wall (CE/PE max OI)
▲ Higher Open (Gap Up) — Open > Prev Close
▲ Bullish
Open lands: In a Descending CPR setup for SENSEX, a gap-up open on 23 Oct places price ABOVE TC 73,362.97 — critically, this also means price opens ABOVE the OI resistance at 73,300 (highest CE OI for week expiry) and approaches the OI support-resistance transition zone between 73,000 PE and 73,300 CE. SENSEX has an unusual configuration on 23 Oct where OI-R at 73,300 is BELOW TC 73,362.97 — a gap-up that clears both the OI resistance and the CPR band simultaneously creates a particularly powerful bullish signal.
CPR role: Launch pad with OI resistance clearance — the CPR band (BC 73,287.25 to TC 73,362.97) sits below the gap-up opening price; crucially, this CPR band also contains the OI resistance at 73,300 within it, meaning a gap-up above TC 73,362.97 has simultaneously cleared both the CPR overhead resistance AND the major CE writing wall at 73,300
Minor Gap (0.05–0.25%) — Structure Dominant
A minor gap up of 0.05–0.25% opens SENSEX between approximately 73,286 and 73,433, placing price inside the CPR band (near BC 73,287.25 to TC 73,362.97) or just above TC 73,362.97 — this is the most nuanced gap-up scenario for SENSEX because the OI resistance at 73,300 sits inside the CPR band itself, meaning a minor gap-up that opens between 73,287 and 73,363 is fighting both CPR resistance and OI CE writing pressure simultaneously. The Narrow CPR confirmation rule (first 15-min candle) is critical here: a 15-min close above TC 73,362.97 AND above the OI resistance at 73,300 simultaneously signals a double-clearance of resistance that can trigger sharp CE writer delta-hedging flows (buying futures) that amplify the move toward H3 73,446.21 and H4 73,643.04. The first target from a confirmed 15-min close above TC 73,362.97 is H3 73,446.21 (Camarilla mean-reversion zone — 83 points above TC), then H4 73,643.04 (Camarilla breakout trigger) and R1 73,645.11 (virtually identical — high-confluence resistance zone at 73,643–73,645), with PDH 73,720.83 as the session high reference; failure to hold TC 73,362.97 after the gap-up confirms that OI resistance at 73,300 is still active and price fades back toward BC 73,287.25 and L3 73,052.57.
Significant Gap (0.25–0.5%) — Balanced
A significant gap up of 0.25–0.5% opens SENSEX between approximately 73,433 and 73,616, placing price above TC 73,362.97, above OI resistance 73,300, and approaching H3 73,446.21 to H4 73,643.04 in the opening minutes — this is a powerful gap configuration because price has cleared all known resistance below TC 73,362.97 and is launching directly into the Camarilla resistance zone. Gap-fill risk in SENSEX is elevated by the proximity of the OI resistance at 73,300: the week expiry's OI structure means CE writers at 73,300 who are forced to delta-hedge by buying as price rises above their strike will create temporary momentum, but CE writers at 73,500 (month expiry OI resistance) will begin defensive hedging above 73,362.97, creating a layered resistance zone between TC 73,362.97 and R1 73,645.11. The specific target from a significant gap-up that holds above TC 73,362.97 for the first 15-min candle is H3 73,446.21 (first partial profit), then the near-identical H4/R1 cluster at 73,643.04–73,645.11 (high-confluence resistance — maximum intraday target for gap-up trades), with the month max pain at 73,500 acting as the gravitational midpoint of this range.
Large Gap (>0.5%) — Gap Direction Dominant
A large gap up exceeding 0.5% opens SENSEX above approximately 73,616, placing price at or above H3 73,446.21 and approaching the critical H4 73,643.04 / R1 73,645.11 confluence zone at the open — in this scenario, gap dominance takes full precedence, and the primary risk is that price is opening directly into the highest-probability intraday reversal zone for SENSEX where Camarilla H4 and Traditional R1 nearly coincide. A large gap-up SENSEX scenario is particularly important to analyze against the month max pain at 73,500 and the month OI resistance at 73,500: if price opens above 73,616 and approaches 73,643–73,645 (H4/R1) within the first 15 minutes, option sellers defending the 73,500 month expiry max pain will initiate selling and CE delta-hedging that creates a natural reversal zone. The abort level for large gap-up longs is a 15-min close below TC 73,362.97, and only a sustained close above H4 73,643.04 with volume opens the extended path toward H5 73,872.94, H6 73,967.50, and R2 74,040.83 — straddle month premium implies a ±1307-point move, suggesting large gap-up sessions can potentially target R2 74,040.83 if H4 73,643.04 is cleared.
|
▲ Upside Path → OI-R The confirmed upside path from a gap-up hold above TC 73,362.97 progresses through H3 73,446.21 (Camarilla mean-reversion resistance — first partial profit zone, 83 points above TC), then the month max pain zone at 73,500 (gravitational target where option sellers will defend — expect temporary pause or reversal here), then the near-identical H4 73,643.04 / R1 73,645.11 cluster (highest-probability intraday reversal zone and maximum target for conservative gap-up trades — book most of the position here), and extended targets at PDH 73,720.83, H5 73,872.94, H6 73,967.50, and R2 74,040.83 only for confirmed trending breakout sessions with 15-min closes above H4 73,643.04. The OI resistance at 73,300 (week expiry, now expired or expiring) transitions from a resistance to a cleared level, and the month OI resistance at 73,500 (max pain) becomes the primary options-derived ceiling. |
▼ Downside Path → OI-S A gap-up failure — 15-min close below BC 73,287.25 after opening above TC 73,362.97 — reactivates the OI resistance at 73,300 and confirms a bull trap, with the downside path running from BC 73,287.25 through L3 73,052.57 (Camarilla mean-reversion downside zone — 235 points below BC and near the OI support at 73,000, making this the most important intraday bear target for 23 Oct), then PDL 73,005.11 and S1 72,929.39 (clustered support zone with the 73,000 PE OI wall providing a natural floor), and L4 72,855.74 / S2 72,609.39 as extended targets below the OI support floor. The convergence of L3 73,052.57 and OI support 73,000 creates a double-confluence support zone that is the highest-probability intraday reversal point for bears to take partial profits. |
| 🔴 OI-R: The OI resistance at **73,300** (highest CE OI for SENSEX week expiry) is unique among the three indices analyzed today because it sits INSIDE the CPR band between BC 73,287.25 and TC 73,362.97 — this means CE writers at 73,300 are actively defending a level that is within 75 points of the current close (73,249.39), making this OI resistance the most immediately relevant and impactful intraday resistance level for any gap-up scenario. In a gap-up scenario, a 15-min close above TC 73,362.97 represents a decisive clearance of the 73,300 CE wall, and CE writers at this strike will be forced to delta-hedge by buying SENSEX futures — this creates a self-reinforcing bullish squeeze as the OI wall is breached, and the initial momentum above 73,362.97 may be sharper than fundamental factors alone would suggest. | 🟢 OI-S: The OI support at **73,000** (highest PE OI for SENSEX week expiry) is approximately 249 points below yesterday's close of 73,249.39 — this is an extremely close and immediately relevant support level compared to NIFTY's 22,000 and BANKNIFTY's 52,000. In a gap-up scenario, 73,000 serves as the primary downside abort level: if a gap-up fails and price returns toward L3 73,052.57, the proximity of 73,000 PE writing creates a natural buying floor where PUT sellers will delta-hedge by buying futures aggressively, making the 73,000–73,052 zone a high-probability reversal point for bear-to-bull intraday trade flips. |
⚡ Key Trigger: For SENSEX gap-up scenarios, the **first 15-min candle close above TC 73,362.97** is the primary trigger (Narrow CPR width 0.10% requires only 15-min confirmation), and this level is the structural fulcrum because TC 73,362.97 simultaneously serves as the top of the Descending CPR and sits above the OI resistance at 73,300 — a 15-min close above TC 73,362.97 means SENSEX has cleared both the CPR overhead resistance and the week expiry's primary CE wall in a single candle, triggering systematic long entries from momentum models and short-covering from CE writers who sold 73,300 calls. If the first 15-min candle fails to close above TC 73,362.97 after a gap-up — especially if price opened between 73,300 and 73,363 — it confirms that the OI resistance at 73,300 is still active and the gap-up has been trapped inside the CPR band, with the trade reversing to short below BC 73,287.25 targeting L3 73,052.57 and S1 72,929.39.
▼ Lower Open (Gap Down) — Open < Prev Close
▼ Bearish
Open lands: In a Descending CPR configuration for SENSEX, a gap-down open places price BELOW BC 73,287.25 — and since the entire CPR band (BC 73,287.25 to TC 73,362.97) sits below yesterday's close of 73,249.39 (wait — note that BC 73,287.25 is actually ABOVE the close of 73,249.39, meaning the CPR band partially straddles the close). Correcting for exact values: yesterday's close is 73,249.39; BC is 73,287.25; this means the close is BELOW BC already, confirming a Descending CPR Trend Reversal setup where prev_close < today's BC — a gap-down amplifies this structure further below.
CPR role: Overhead resistance / extended bear pressure — with the close already below BC 73,287.25, a gap-down opens even further below the complete CPR band, making the entire BC 73,287.25–TC 73,362.97 range a resistance ceiling; crucially, the OI resistance at 73,300 also sits inside this resistance band
Minor Gap (0.05–0.25%) — Structure Dominant
A minor gap down of 0.05–0.25% opens SENSEX between approximately 73,212 and 73,213 to 73,249, placing price below BC 73,287.25 and even further below TC 73,362.97 — since yesterday's close was already below BC 73,287.25 in this Descending CPR Trend Reversal setup, a minor gap-down confirms two consecutive sessions below the CPR, creating significant structural bearish pressure. In the Narrow CPR confirmation framework (15-min candle required), a minor gap-down that opens near 73,212–73,249 is positioned approximately 38–75 points below BC 73,287.25, and the probability of a gap-fill to BC 73,287.25 within 30 minutes is moderate but declining given the second-session-below-CPR signal. The specific bear setup is a 15-min close below L3 73,052.57 after failing to recover BC 73,287.25, targeting the OI support zone at 73,000 and PDL 73,005.11, then S1 72,929.39 and L4 72,855.74 — the proximity of the 73,000 OI support to PDL 73,005.11 creates a high-significance support cluster that should provide at least a temporary bounce.
Significant Gap (0.25–0.5%) — Balanced
A significant gap down of 0.25–0.5% opens SENSEX between approximately 73,065 and 73,212, placing price approaching or at L3 73,052.57 and critically near the OI support at 73,000 and PDL 73,005.11 — this is a particularly significant gap configuration for SENSEX because the gap is opening directly into the highest-density options support zone in the market. The proximity of L3 73,052.57 (73,052.57), PDL 73,005.11 (73,005.11), and OI support 73,000 (73,000) within a 53-point range means that a significant gap-down opening in this zone triggers immediate PE writer delta-hedging (buying futures near 73,000), creating powerful natural support that can arrest the decline quickly. However, the 30-min confirmation rule (SENSEX is Narrow, use 15-min) applies: if the first 15-min candle closes below L3 73,052.57 AND the 73,000 OI support fails to hold, the path to S1 72,929.39, L4 72,855.74, and S2 72,609.39 opens — a significant gap-down through the 73,000 OI support floor would be an unusually bearish event that suggests a structural shift in the expiry's option positioning.
Large Gap (>0.5%) — Gap Direction Dominant
A large gap down exceeding 0.5% opens SENSEX below approximately 72,882, potentially breaching L4 72,855.74 and approaching S1 72,929.39 at the open — this is a panic-open scenario where the 73,000 OI support, PDL 73,005.11, and L3 73,052.57 have all been gapped through before market participants can react, creating maximum gamma stress for PUT sellers at 73,000. In a large SENSEX gap-down, the PE writers at 73,000 are immediately underwater and will engage in emergency delta-hedging (buying futures aggressively), which can create a sharp 200–400 point spike from the opening lows before the true directional session begins — this opening spike is a fade opportunity for intraday traders who wait for the 15-min candle to stabilize below L3 73,052.57 before shorting. The primary recovery reference is L3 73,052.57 and the 73,000 OI support zone — a 15-min close above 73,000 after a large gap-down triggers aggressive short-covering toward BC 73,287.25 and TC 73,362.97, while failure to recover 73,000 in 30 minutes targets L4 72,855.74, S2 72,609.39, and L5 72,625.84 as sequential intraday bear targets within the month straddle's 1306.95-point implied envelope.
|
▲ Upside Path → OI-R The recovery upside path from a SENSEX gap-down (assuming 15-min close above BC 73,287.25) runs through P 73,325.11 (pivot midpoint — confirms recovery momentum), then the OI resistance at 73,300 (CE writers at this level may provide temporary resistance on the way up — note this level sits between BC and TC), TC 73,362.97 (full CPR reclaim — triggers short-covering cascade), H3 73,446.21 (Camarilla mean-reversion target — first genuine upside objective and partial profit zone), and the month max pain at 73,500 as the gravitational target for option sellers to defend, with H4 73,643.04 / R1 73,645.11 as the maximum recovery target for the session. Each level should be treated as a partial profit zone given SENSEX's Trending market structure which can produce clean directional sweeps once the CPR is reclaimed. |
▼ Downside Path → OI-S The bear continuation path from confirmed CPR resistance (failure to reclaim BC 73,287.25) and OI support failure (close below 73,000) runs through L3 73,052.57 (Camarilla downside zone — first partial profit for bears), PDL 73,005.11 and OI support 73,000 (high-confluence double floor — if broken, triggers PUT writer panic selling and stop-loss cascades from weak long holders), then S1 72,929.39 (traditional first support — second partial profit zone), L4 72,855.74 (Camarilla breakdown trigger — close below activates L5 72,625.84), and S2 72,609.39 / L5 72,625.84 (near-identical values — maximum intraday bear target within the straddle's 1306.95-point month implied range). Bears should note that the month OI support at 73,000 (week expiry) and 71,000 (month expiry) provide layered floors below which institutional PUT sellers will defend aggressively. |
| 🔴 OI-R: In a SENSEX gap-down scenario, the OI resistance at **73,300** (week expiry CE max OI, sitting inside the CPR band between BC 73,287.25 and TC 73,362.97) becomes the primary overhead resistance ceiling for any recovery attempt — CE writers who sold 73,300 calls will aggressively defend this level by shorting SENSEX futures if price approaches from below, making the 73,287.25–73,362.97 CPR zone doubly resistant in a recovery scenario. For gap-down recovery trades, the bear zone ends and the bull zone begins only when a 15-min candle closes above BOTH OI resistance 73,300 and TC 73,362.97 — until then, every bounce into this zone is a selling opportunity for intraday traders positioned short. | 🟢 OI-S: The OI support at **73,000** (highest PE OI for SENSEX week expiry) is the most critical intraday reference for any SENSEX gap-down scenario because at only approximately 249 points below yesterday's close, it can be reached within a single moderate-sized gap or the first 60 minutes of trading — PE writers at 73,000 with significant open interest will begin delta-buying futures as price approaches this level, creating a reflexive support dynamic that makes 73,000–73,005 (OI support / PDL confluence) the highest-probability intraday reversal zone for SENSEX on 23 Oct. Traders should watch for a PUT premium spike at 73,000 strike alongside rapid volume increase in SENSEX futures near 73,000–73,005 as the signal that PE delta-hedging is active, and be prepared for a 150–250 point bounce from this zone even in a structurally bearish session. |
⚡ Key Trigger: The critical trigger for SENSEX gap-down scenarios on 23 Oct is the **interaction between the 15-min candle and both BC 73,287.25 AND the OI support at 73,000** — specifically, failure to recover BC 73,287.25 within the first 15 minutes confirms CPR overhead resistance, while failure to hold L3 73,052.57 above the 73,000 OI support confirms a structural breakdown through the options floor. The dual-level nature of SENSEX's trigger framework (CPR at 73,287.25 and OI support at 73,000) means bears need BOTH levels to fail before committing to extended downside targets, while bulls need only a 15-min close above BC 73,287.25 to initiate a recovery trade targeting TC 73,362.97, H3 73,446.21, and the month max pain at 73,500.
◆ Near Flat Open — Open ≈ Prev Close (±0.05%)
◆ Neutral
Open lands: A flat open of ±0.05% from yesterday's close of 73,249.39 places SENSEX opening between approximately 73,212 and 73,286 — in the Descending CPR configuration with prev_close (73,249.39) already below BC (73,287.25), a flat open places SENSEX below the entire CPR band for the second consecutive session, confirming the Descending CPR Trend Reversal signal: 'Flat = near prev_close = below BC, two sessions below CPR = compounding bearish pressure.' This is the most structurally significant flat-open scenario of the three indices on 23 Oct.
CPR role: Overhead resistance / compounding bear pressure — with two consecutive sessions (prev_close and today's flat open) below BC 73,287.25, the CPR band is firmly established as overhead resistance; the OI resistance at 73,300 sits within this band, adding a second layer of resistance to any bullish recovery attempt
Near Flat (±0.05%)
A flat open for SENSEX on 23 Oct creates the most analytically rich intraday setup because SENSEX is experiencing a Descending CPR Trend Reversal condition — yesterday's close of 73,249.39 is already below today's BC of 73,287.25, meaning price has printed below the entire CPR band for two sessions, which the CPR framework explicitly identifies as 'compounding weakness.' The specific CPR values — TC 73,362.97 and BC 73,287.25 — create a 75.72-point decision band (Narrow CPR at 0.10%), and the flat open placing price at approximately 73,212–73,286 means price is BELOW the CPR band entirely from the first tick, making the bear thesis structurally dominant unless price can recover above BC 73,287.25 with conviction. The Narrow CPR width (0.10%) triggers the 15-min confirmation rule — a single 15-min candle above BC 73,287.25 is required to validate any bull thesis, and the compounding bearish pressure from two-sessions-below-CPR means bulls face a steeper climb, needing to reclaim BC 73,287.25 first, then OI resistance 73,300, and finally TC 73,362.97 before the session can be classified as bullish. The dual trigger framework for 23 Oct SENSEX flat open: Bear trigger = **15-min candle close below L3 73,052.57** (no need to first breach BC since open is already below BC — the 15-min close below L3 73,052.57 confirms the bear trend is accelerating) targeting OI support 73,000 / PDL 73,005.11, S1 72,929.39, L4 72,855.74, and S2 72,609.39 / L5 72,625.84; Bull trigger = **15-min candle close above BC 73,287.25** (initiating CPR recovery) followed by confirmation above TC 73,362.97 targeting H3 73,446.21, month max pain 73,500, H4 73,643.04 / R1 73,645.11.
|
▲ Upside Path → OI-R From a confirmed bull trigger (15-min close above BC 73,287.25), the SENSEX upside path — noting that this is a recovery against a bearish structure — proceeds through the OI resistance at 73,300 (CE writers here will slow the rally temporarily but should be overcome on strong volume), TC 73,362.97 (full CPR reclaim — critical confirmation that the Descending CPR Trend Reversal has been neutralised), H3 73,446.21 (Camarilla mean-reversion resistance — first partial profit zone, approximately 159 points above BC), month max pain 73,500 (gravitational target for option sellers — expect deceleration near this level), and H4 73,643.04 / R1 73,645.11 (near-identical high-confluence resistance zone — maximum intraday target for recovery longs, approximately 358 points above BC, within the 75.72-point Narrow CPR launch momentum). PDH 73,720.83 and H5 73,872.94 are extended targets for a confirmed trending recovery day. |
▼ Downside Path → OI-S From the flat-open bear trigger (15-min close below L3 73,052.57 after failing to recover BC 73,287.25), the SENSEX downside path runs through L3 73,052.57 (Camarilla mean-reversion downside zone — first partial profit for bears), then the triple-confluence support of PDL 73,005.11 / OI support 73,000 / approximately 73,000 (where PE writer delta-buying will create a reflex bounce — partial profit zone for intraday bears and scalp long entry for contrarians), then S1 72,929.39 (traditional first support — second partial profit if 73,000 fails), L4 72,855.74 (Camarilla breakdown trigger for deeper downside), and the near-identical S2 72,609.39 / L5 72,625.84 cluster as the maximum intraday bear target within the month straddle's 1306.95-point implied downside envelope. Bears must note that the month OI support at 71,000 provides a deep floor and PE writers at 73,000 (week) will be extremely active near the OI support zone. |
| 🔴 OI-R: The OI resistance at **73,300** (week expiry CE max OI, sitting inside the CPR band between BC 73,287.25 and TC 73,362.97) is a uniquely important and immediately impactful level for SENSEX on 23 Oct — with the flat open at approximately 73,212–73,286, the OI resistance at 73,300 is only 14–88 points above the opening price, meaning it will be tested within the first few minutes of trading and CE writers here will actively defend through short futures positions. In a flat-open scenario, the OI resistance at 73,300 acts as the first checkpoint for bulls: if price can trade above 73,300 with the first 15-min candle, CE writer gamma exposure forces defensive buying that pushes price toward BC 73,287.25 and TC 73,362.97; if 73,300 rejects price, the CE wall is confirmed active and bears gain momentum toward L3 73,052.57. | 🟢 OI-S: The OI support at **73,000** (week expiry PE max OI, sitting approximately 249 points below yesterday's close) is the defining downside reference for SENSEX on 23 Oct given its proximity to both PDL 73,005.11 and L3 73,052.57 — PE writers at 73,000 who sold puts and collected premium will be aggressively buying SENSEX futures as price approaches this level to limit their delta losses, creating a natural buying wall that makes the 73,000–73,052 zone the highest-probability intraday support and reversal zone for any selling scenario. In the flat-open bear scenario, 73,000 is both the primary bear target AND the maximum downside for conservative short trades — bears should take most of their profits at 73,000–73,005 (OI support / PDL confluence) rather than pressing for S1 72,929.39, and should watch for a sharp reversal bounce of 150–300 points from this zone once PE delta-hedging flows activate, potentially creating a profitable second long entry for intraday mean-reversion trades. |
⚡ Key Trigger: The exact structural fulcrum for 23 Oct SENSEX flat-open is the **first 15-min candle close above BC 73,287.25 for bulls or below L3 73,052.57 for bears** — unlike typical flat-open setups where price is inside the CPR band, SENSEX's flat open below BC 73,287.25 means the bear trigger is not the CPR itself but the next major support at L3 73,052.57, which coincides with PDL 73,005.11 and OI support 73,000 as a triple-confluence floor just below it. The market psychology driving this bifurcated trigger level is clear: SENSEX bears have two sessions of structural confirmation (two closes below CPR), and will press the advantage at L3 73,052.57 knowing that a close below this level breaks the last line of defense before the 73,000 OI support floor, while SENSEX bulls must reclaim BC 73,287.25 decisively to invalidate the Descending CPR Trend Reversal signal and shift the session structure to neutral-to-bullish.
📊 VIX Insight: India VIX data is unavailable for the 22 Oct 2026 closing session, which introduces meaningful uncertainty into premium calibration for 23 Oct intraday trading — without a VIX reading, traders cannot quantify whether implied volatility is expanding or contracting, and must instead rely on straddle-implied move proxies: NIFTY's 306.2-point straddle defines the expected range of approximately 22,394 to 23,006, BANKNIFTY's 804.7-point straddle defines approximately 54,095 to 55,705, and SENSEX's month straddle of 1306.95 points defines the broader monthly range. The absence of VIX data makes CPR structure, OI walls, and Camarilla levels even more critical as the primary navigation framework for 23 Oct — traders should treat the straddle-implied moves as the definitive range boundaries and avoid initiating directional positions beyond those boundaries without explicit level-based confirmation.
Overall View:
All three indices are printing Descending CPR formations on 23 Oct 2026, creating a uniformly bearish opening structure across NIFTY, BANKNIFTY, and SENSEX — NIFTY's Narrow Descending CPR (BC 22,669.92 / TC 22,681.74) favours a trend day with the first 15-min candle defining direction, BANKNIFTY's Medium Descending CPR (BC 54,796.90 / TC 54,882.76) creates a balanced session with 30-min confirmation required, and SENSEX's Narrow Descending CPR (BC 73,287.25 / TC 73,362.97) with the additional Trend Reversal signal (close below BC) adds the most compounding bearish pressure of the three. Cross-index bearish confluence is significant: if all three indices fail to reclaim their respective TC levels within the first 15–30 minutes of 23 Oct trading, the probability of a sustained bearish session targeting NIFTY L3 22,624.36, BANKNIFTY L3 54,740.05, and SENSEX L3 73,052.57 / OI support 73,000 is high — conversely, any coordinated gap-up or TC-reclaim across all three indices would signal a powerful reversal trade toward max pain levels of NIFTY 22,850, BANKNIFTY 55,500, and SENSEX 73,500.
All three indices are printing Descending CPR formations on 23 Oct 2026, creating a uniformly bearish opening structure across NIFTY, BANKNIFTY, and SENSEX — NIFTY's Narrow Descending CPR (BC 22,669.92 / TC 22,681.74) favours a trend day with the first 15-min candle defining direction, BANKNIFTY's Medium Descending CPR (BC 54,796.90 / TC 54,882.76) creates a balanced session with 30-min confirmation required, and SENSEX's Narrow Descending CPR (BC 73,287.25 / TC 73,362.97) with the additional Trend Reversal signal (close below BC) adds the most compounding bearish pressure of the three. Cross-index bearish confluence is significant: if all three indices fail to reclaim their respective TC levels within the first 15–30 minutes of 23 Oct trading, the probability of a sustained bearish session targeting NIFTY L3 22,624.36, BANKNIFTY L3 54,740.05, and SENSEX L3 73,052.57 / OI support 73,000 is high — conversely, any coordinated gap-up or TC-reclaim across all three indices would signal a powerful reversal trade toward max pain levels of NIFTY 22,850, BANKNIFTY 55,500, and SENSEX 73,500.
Disclaimer: KRV Prime provides educational and informational content relating to financial markets. Articles, research, examples, charts, strategies and tools are provided for educational purposes and should not be interpreted as personalised investment advice or a guarantee of financial performance. Markets involve risk, including possible loss of capital. Past performance does not guarantee future results. KRV Prime is not a SEBI Registered Investment Adviser or Research Analyst.