
Index Analysis
Intraday Analysis for 24 Sep 2026
KRV Prime23 September 202657 min
Educational/Derived AnalysisSource: KRV Prime Market Insights (End-of-Day)As of 23 Sep 2026, 04:38 PM IST
Intraday Analysis for 24 Sep 2026
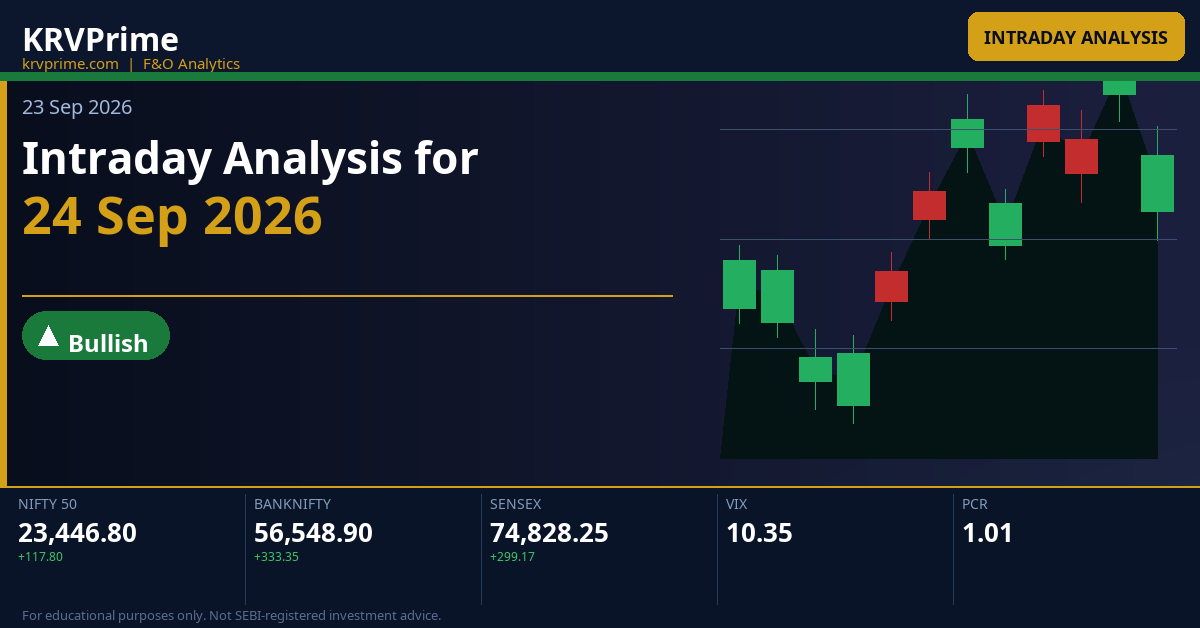
Markets closed on a positive note on 23 Sep 2026 with NIFTY at **23,446.80** (+0.50%), BANKNIFTY at **56,548.90** (+0.59%), and SENSEX at **74,828.25** (+0.40%), reflecting a broad-based mild recovery. India VIX data is unavailable for this session, making it essential to rely on structural CPR signals and OI positioning rather than implied volatility direction for tomorrow's bias. All three indices carry Ascending Medium or Ascending Narrow CPR structures into 24 Sep 2026, signalling that the CPR band will sit above yesterday's closing price — creating a situation where price must work its way into the CPR band for any bullish continuation or risk sliding below the BC for a directional bearish move.
Key Market Signals — Intraday Setup
All three indices — NIFTY, BANKNIFTY, and SENSEX — enter 24 Sep 2026 with Ascending CPR structures, meaning the entire CPR band lies above the respective closing prices, placing immediate overhead structure as the first key test for bulls. The OI data shows well-defined resistance walls at NIFTY 24,000 CE and BANKNIFTY 57,500 CE while strong PE bases sit at NIFTY 23,000 and BANKNIFTY 56,000, suggesting the market is in a defined range with bulls needing to break ascending CPR ceilings and bears needing to crack the large OI floors below.
Deep Technical Analysis & Levels
NIFTY
Ascending — Medium (Width 0.11%)
◆ Neutral
Market Structure Balanced or transitional | Straddle ATM 23,450 straddle priced at **208.2 pts** (Call 108.8 + Put 99.4), implying an expected intraday move of approximately ±208 points from 23,450, defining a range of roughly **23,242 to 23,658** for the session — traders should note this as the options-market's probabilistic boundary for the day. | Max Pain Max Pain at **23,500** for both Week and Month expiry (29-Sep-2026) — price gravitates toward 23,500 into expiry, meaning option sellers benefit from NIFTY settling near this level; intraday traders should note that a close near 23,500 would be the path of least resistance for market makers. |
Tomorrow's Complete Level Map
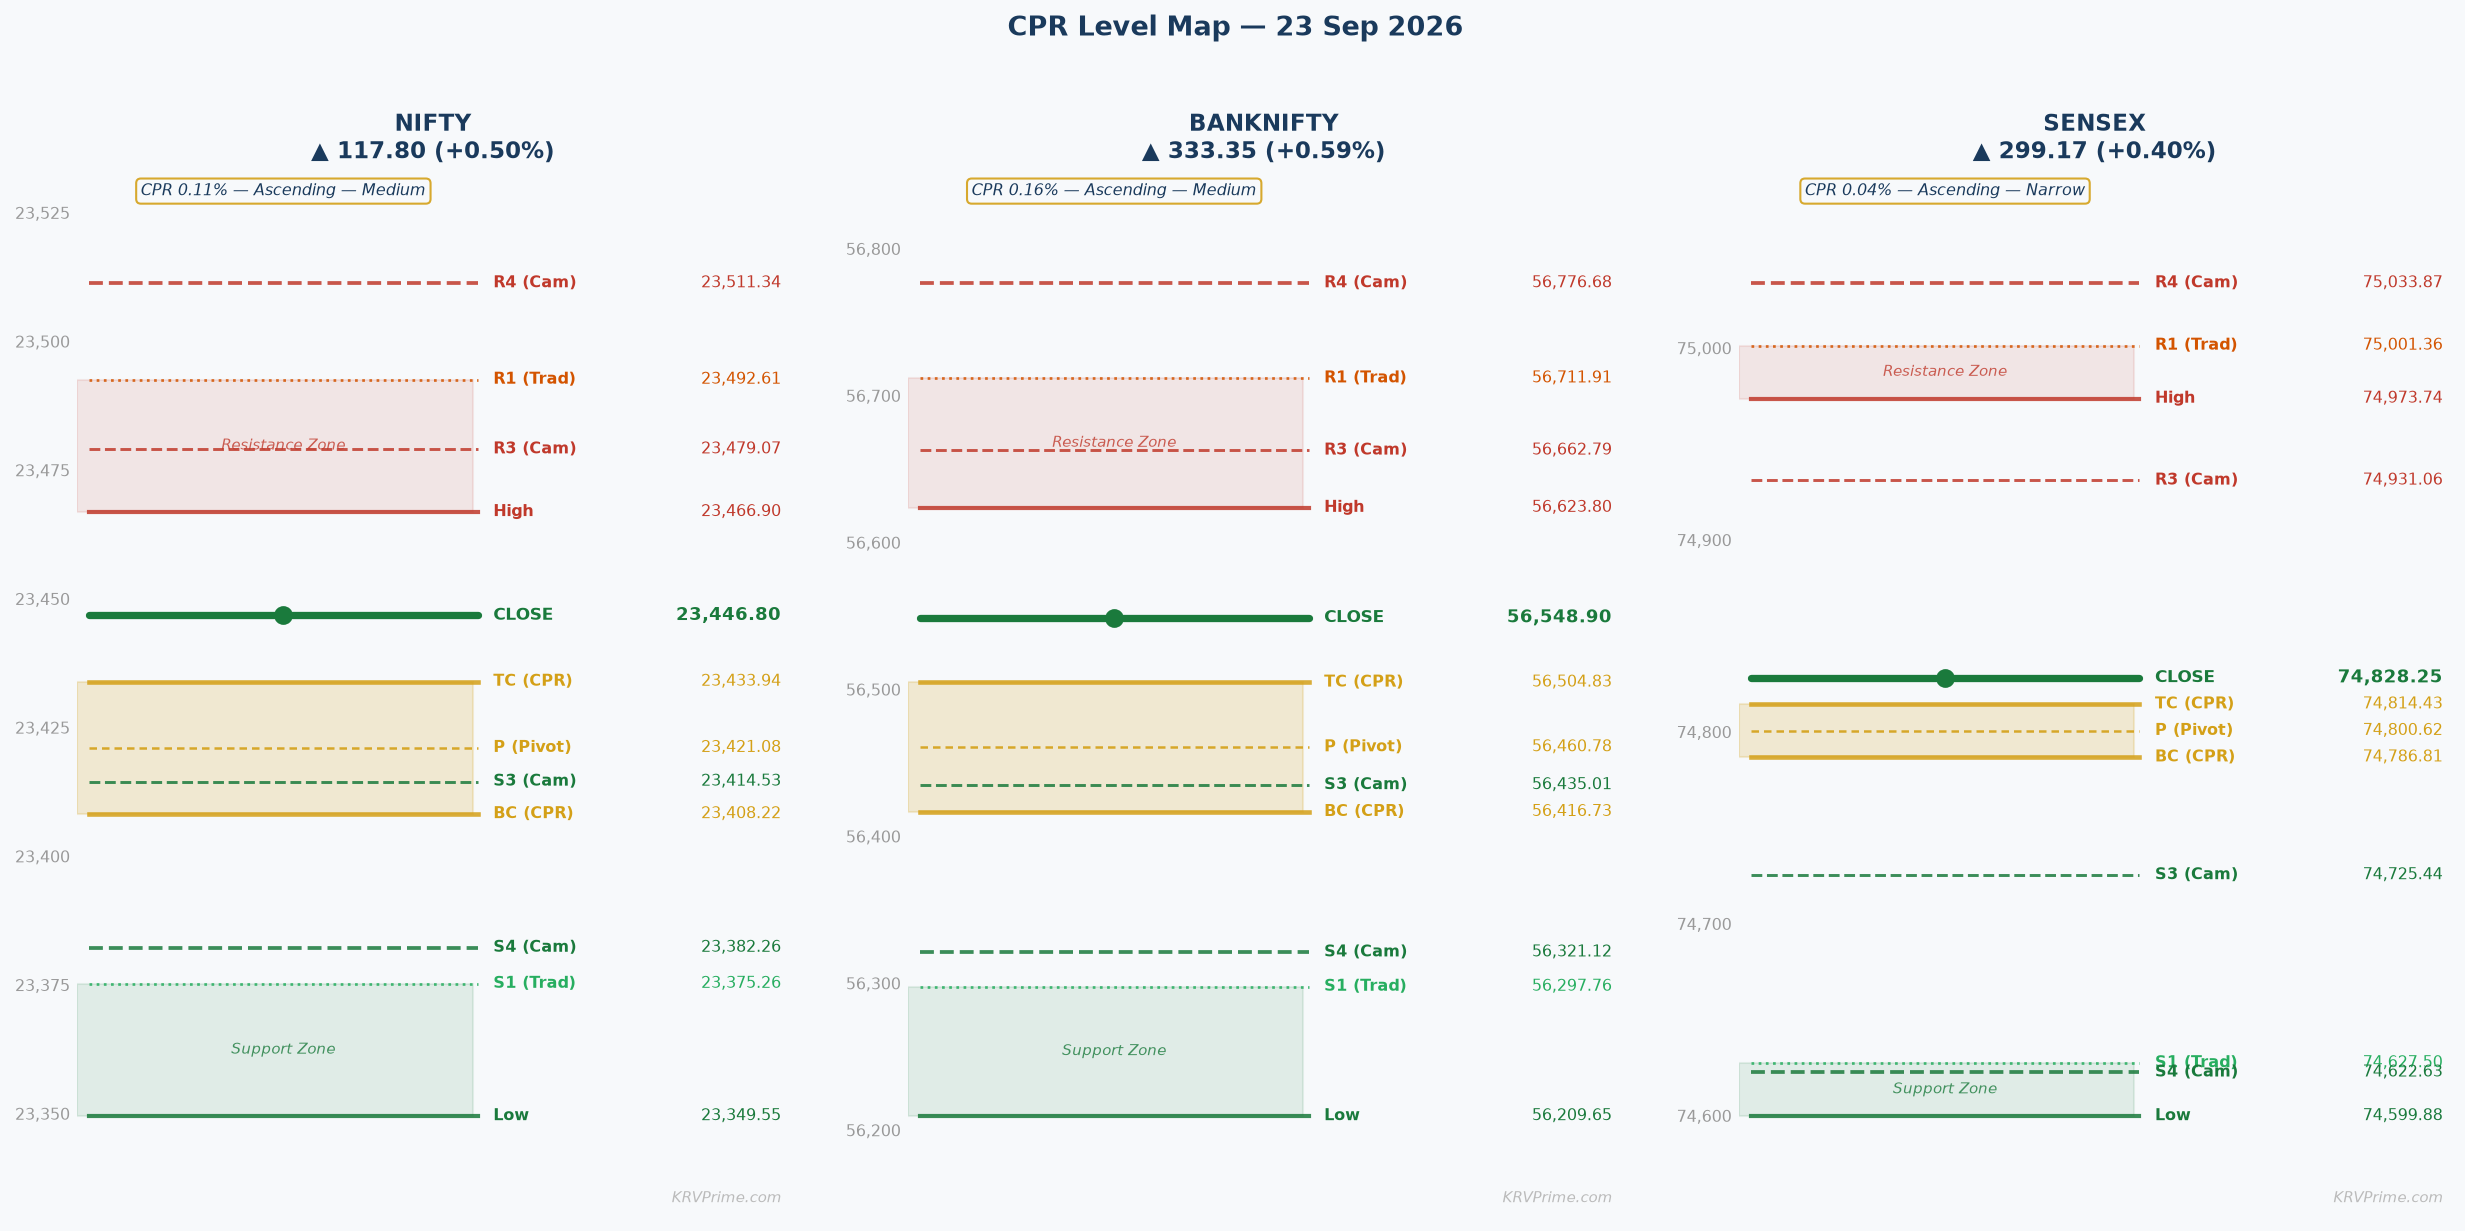
OI-R: 24,000 R3: 23,609.96 H6: 23,564.64 H5: 23,549.03 R2: 23,538.43 H4 ▶: 23,511.34 R1: 23,492.61 PDH: 23,466.90 H3 ↩: 23,479.07
TC: 23,433.94 P: 23,421.08 BC: 23,408.22
L3 ↩: 23,414.53 PDL: 23,349.55 S1: 23,375.26 L4 ▶: 23,382.26 S2: 23,303.73 L5: 23,344.57 L6: 23,328.96 S3: 23,257.91 OI-S: 23,000
↩ = Camarilla reversal point | ▶ = Camarilla breakout/breakdown trigger | OI-R/OI-S = Options wall (CE/PE max OI)
▲ Higher Open (Gap Up) — Open > Prev Close
▲ Bullish
Open lands: With an Ascending CPR where BC is 23,408.22 and TC is 23,433.94 — both above yesterday's close of 23,446.80 — a gap-up open would place price inside the CPR band (between BC 23,408.22 and TC 23,433.94) or above TC 23,433.94 depending on gap magnitude, effectively launching the session from within or above the ascending CPR band.
CPR role: Launch pad — the ascending CPR band (BC 23,408.22 to TC 23,433.94) acts as a springboard for bullish continuation if price holds above TC; any early pullback that finds support at BC and reclaims TC within the first 30 minutes confirms the band as a demand zone.
Minor Gap (0.05–0.25%) — Structure Dominant
A minor gap up of 0.05–0.25% would open NIFTY in the range of approximately **23,458 to 23,505**, placing price just above TC 23,433.94 and near or just above PDH 23,466.90. The Ascending Medium CPR structure adds meaningful confirmation to this gap — price is now above the entire CPR band, which immediately flips the BC-TC zone from potential overhead to active support, giving bulls a structural foundation to build on. The first target in this scenario is H3 at **23,479.07** — a 30-min close above this Camarilla level confirms the move; first partial profit should be taken at R1 **23,492.61** with the second partial at H4 **23,511.34**, using BC **23,408.22** as the stop-loss anchor.
Significant Gap (0.25–0.5%) — Balanced
A significant gap of 0.25–0.50% would open NIFTY between approximately **23,505 and 23,564**, placing price above PDH 23,466.90, near H4 23,511.34 or even approaching H5 23,549.03 — this is an important zone because both Camarilla H4 and H5 are primary breakout triggers and a gap into this range demands caution about gap-fill risk. The CPR band (BC 23,408.22 to TC 23,433.94) now sits well below the open, meaning the CPR flips to a distant support rather than an active launch pad — initial momentum may drive toward R2 **23,538.43** and H5 **23,549.03**, but delta-hedging flows by market makers selling CE above these levels will create friction. If the gap does not sustain and price begins to fade in the first 30 minutes, expect a pullback toward R1 **23,492.61** first, then TC **23,433.94** — a 30-min close back below PDH **23,466.90** is the warning sign that a gap-fill toward the CPR band is underway.
Large Gap (>0.5%) — Gap Direction Dominant
A large gap exceeding 0.50% would open NIFTY above approximately **23,564**, potentially at or above H6 23,564.64 — this is a rare scenario where the gap magnitude overrides most CPR structure signals and price enters extreme Camarilla territory. At this level, the probability of gap-fill rises sharply as institutional option sellers (who have written large CE positions at the 24,000 OI wall) become active sellers on the way up, creating significant overhead resistance; the straddle of 208.2 points also implies the market did not price in a move of this magnitude, making overextension more likely. The strategy in a large gap-up is to wait for the first 15-min candle to complete — if it closes below H6 **23,564.64**, the gap-fill toward H4 **23,511.34** and then TC **23,433.94** is the high-probability trade, while a sustained close above H6 with follow-through volume targets R3 **23,609.96** as the next swing level.
|
▲ Upside Path → OI-R The upside path in a gap-up scenario moves from TC **23,433.94** → H3 **23,479.07** → PDH **23,466.90** (already above in gap-up; serves as a confirmation flip to support) → R1 **23,492.61** → H4 **23,511.34** → R2 **23,538.43** → H5 **23,549.03** → OI-R **24,000** — each Camarilla level (H3, H4, H5) represents a stall zone where partial profits should be booked, and genuine momentum is confirmed when price trades a 15-min candle above each level with above-average delivery. The OI-R at **24,000** is the ultimate ceiling for the session — CE writers will defend this aggressively via delta-hedging, and any attempt to breach it requires an extraordinary catalyst well above what the current straddle of 208.2 points implies. |
▼ Downside Path → OI-S The downside failure path in a gap-up begins with a loss of TC **23,433.94** on a 30-min close, which activates P **23,421.08** and then BC **23,408.22** as the next support tests — a breach of BC on a 30-min close completes a full CPR breakdown and changes the session from bullish to bearish. Once BC **23,408.22** gives way, price targets L4 **23,382.26** and S1 **23,375.26** in quick succession (these levels are only 33 points apart and represent a retail stop-loss cluster), after which the next significant support is PDL **23,349.55** and L5 **23,344.57**, and ultimately OI-S **23,000** as the macro floor where PE writers provide structural support. |
| 🔴 OI-R: The OI-R at **24,000** CE represents the single largest options open interest wall on the upside — CE writers at this strike are short gamma and will sell futures/spot aggressively as price approaches 24,000, acting as a hard ceiling that requires exceptional breadth and volume to break through in a single intraday session. In a gap-up scenario, this level is structurally irrelevant for intraday scalpers given that NIFTY would need to gain an additional 553+ points from the close at **23,446.80**, but it defines the maximum upside target for positional traders holding overnight longs and should be used as an ultimate profit target rather than a same-day realistic objective. | 🟢 OI-S: The OI-S at **23,000** PE represents the dominant put open interest floor where PE writers are sitting on large short-put positions — this level is very distant from current prices (approximately 447 points below close) in a gap-up scenario, making it the abort level rather than an active support reference for the intraday session. PE writers at 23,000 will only face pressure if markets sell off dramatically, and in a gap-up context, this level serves as the ultimate safety net that underpins bullish sentiment across NIFTY derivatives — its existence supports the view that any intraday dip is likely to find buyers before reaching this structural floor. |
⚡ Key Trigger: The primary trigger for the gap-up scenario is a **first 30-min candle close above TC 23,433.94** on above-average volume — since the CPR is Ascending Medium, a 30-min close is required to distinguish genuine continuation from a false breakout in a balanced-transitional market structure. If price holds above TC 23,433.94 for the first 30 minutes, it confirms bullish control with the CPR band as active support, targeting H3 **23,479.07** and then R1 **23,492.61**; a failure to hold TC and a 30-min close back below BC **23,408.22** signals that the gap-up is being sold and the session bias flips to bearish, with L3 **23,414.53** and S1 **23,375.26** becoming the next key levels to watch.
▼ Lower Open (Gap Down) — Open < Prev Close
▼ Bearish
Open lands: In an Ascending CPR where BC is 23,408.22 and TC is 23,433.94 — the entire CPR band lies above yesterday's close of 23,446.80 — wait, the close of 23,446.80 is actually ABOVE TC 23,433.94. A gap-down open below 23,446.80 would place price somewhere between TC 23,433.94 and BC 23,408.22 (minor gap), or below BC 23,408.22 (significant/large gap), meaning the CPR band immediately becomes overhead resistance.
CPR role: Overhead resistance — in a gap-down scenario the ascending CPR band (BC 23,408.22 to TC 23,433.94) switches from potential support to a resistance ceiling that bears will defend; a failure to reclaim BC 23,408.22 within the first 30 minutes signals that the gap-down has structural follow-through.
Minor Gap (0.05–0.25%) — Structure Dominant
A minor gap down of 0.05–0.25% would open NIFTY between approximately **23,388 and 23,435**, placing price inside the CPR band or just below BC **23,408.22** — this is a critical zone because the Ascending Medium CPR structure means the entire CPR sits as overhead resistance, and even a minor gap-down creates an immediate test of whether bulls can reclaim the band within the first 30 minutes. Minor gaps inside the CPR range often see gap-fill attempts within 30–60 minutes as intraday traders probe the overnight high; however, if price opens below BC **23,408.22** and fails to reclaim it on the first 30-min candle, this confirms bearish session bias with L3 **23,414.53** acting as the first Camarilla mean-reversion reference and S1 **23,375.26** as the first Traditional target. The confirmation rule for Medium CPR width (0.11%) is a 30-min close — a 30-min candle close back above TC **23,433.94** flips the session bullish, while a 30-min candle that stays below BC **23,408.22** confirms the downside with targets at L4 **23,382.26** and PDL **23,349.55**.
Significant Gap (0.25–0.5%) — Balanced
A significant gap-down of 0.25–0.50% would open NIFTY between approximately **23,330 and 23,388**, placing price clearly below BC **23,408.22** and potentially below PDL **23,349.55** at the lower end — this is a structurally bearish setup where the entire CPR band (BC 23,408.22 to TC 23,433.94) becomes overhead resistance with approximately 60–100 points of supply above the open. In this scenario, the gap-fill probability is lower than for a minor gap — a 30-min candle close back above BC **23,408.22** is required to confirm recovery, failing which price should be treated as in distribution with L4 **23,382.26** and S1 **23,375.26** as the immediate targets; PUT writing at 23,000 OI support creates a natural floor, and the L5 **23,344.57** and L6 **23,328.96** zone should be the key watch levels for potential PUT monetization. The 30-min reclaim rule for Medium CPR applies — if bears hold price below BC for 30 minutes, targets cascade to S2 **23,303.73** and S3 **23,257.91**, while a recovery above TC **23,433.94** within 60 minutes re-establishes neutral to bullish bias.
Large Gap (>0.5%) — Gap Direction Dominant
A large gap-down exceeding 0.50% would open NIFTY below approximately **23,330**, breaching PDL **23,349.55** immediately and entering extreme bearish Camarilla territory near L5 **23,344.57** and L6 **23,328.96** — at this level, panic selling from leveraged longs and stop-loss triggers below PDL accelerate the move significantly beyond what the straddle of 208.2 points priced in. The gap-fill scenario in a large gap-down is low probability in the first 30 minutes; instead, the strategy is to wait for a 15-min stabilization candle near L5 **23,344.57** or L6 **23,328.96** and look for a recovery toward PDL **23,349.55** as the first partial recovery target — the CPR band (BC 23,408.22 to TC 23,433.94) becomes a distant resistance that would require a multi-session recovery. Straddle monetization (selling the now-elevated ATM PUT premium near L5/L6) is the options strategy of choice in a large gap-down once price stabilizes, with OI-S at **23,000** acting as the ultimate structural floor below which PE writers will begin aggressive covering.
|
▲ Upside Path → OI-R The recovery path in a gap-down scenario follows: BC **23,408.22** → P **23,421.08** → TC **23,433.94** → PDH **23,466.90** → H3 **23,479.07** — each level must be reclaimed on a 30-min candle to confirm genuine recovery momentum rather than a dead-cat bounce driven by short-covering. A recovery above TC **23,433.94** with sustained volume would restore the session's bullish bias, and a move above PDH **23,466.90** toward R1 **23,492.61** would confirm that the gap-down was a false signal; however, without volume confirmation at each recovery level, these bounces should be treated as short-covering opportunities rather than fresh long entries. |
▼ Downside Path → OI-S The downside continuation path in a gap-down moves from below BC **23,408.22** → L4 **23,382.26** → S1 **23,375.26** → PDL **23,349.55** → L5 **23,344.57** → L6 **23,328.96** → S2 **23,303.73** → S3 **23,257.91** → OI-S **23,000** — retail stop-losses clustered just below PDL **23,349.55** accelerate the move into the L5/L6 zone (23,344.57–23,328.96) once that level breaks. The L5–L6 zone (23,344.57–23,328.96) is a high-probability intraday stall area where short-term PUT holders should take profits, and any session that reaches this zone in the first two hours without recovery should be monitored carefully for a potential reversal signal. |
| 🔴 OI-R: In a gap-down scenario, OI-R at **24,000** CE becomes completely irrelevant as an intraday ceiling — it is more than 550 points above the expected session range and serves only as a reminder of the longer-term supply zone that institutional CE writers will defend in future sessions. The more relevant overhead in a gap-down context is the CPR band itself (BC 23,408.22 to TC 23,433.94), which CE writers near the 23,500 strike will also defend intraday — the 24,000 OI wall simply confirms that no structural upside breakout is expected from the current market configuration. | 🟢 OI-S: OI-S at **23,000** PE is the primary structural floor for the session — a massive concentration of PE short positions (PE writers short puts at 23,000) means that these participants will aggressively defend this level by buying futures and spot if price approaches, creating a natural demand cushion that is unlikely to be breached without a major macro event. In a gap-down scenario, the **23,000** level serves as the ultimate bear target and PUT monetization zone — intraday traders holding bearish positions should book significant profits near this level as PE writer covering activity will create sharp reversals, and the risk/reward of initiating fresh shorts deteriorates sharply below **23,100**. |
⚡ Key Trigger: The critical trigger in a gap-down scenario is whether NIFTY can **reclaim BC 23,408.22 on a 30-min close** — this is the exact dividing line between a gap-fill recovery (bullish) and a confirmed bearish continuation for the full session, given the Medium CPR width requires a full 30-min bar for validation. A 30-min close above BC **23,408.22** activates the bull recovery path toward P **23,421.08** and then TC **23,433.94**, while a 30-min candle that closes below BC confirms that the CPR band is acting as overhead supply, and the bear targets of L4 **23,382.26**, S1 **23,375.26**, and PDL **23,349.55** become the path of least resistance.
◆ Near Flat Open — Open ≈ Prev Close (±0.05%)
◆ Neutral
Open lands: A flat open of ±0.05% from yesterday's close of 23,446.80 would place NIFTY between approximately **23,435 and 23,459** — importantly, yesterday's close of 23,446.80 already sits above TC 23,433.94, meaning a flat open also opens above the entire ascending CPR band, which is the highest-information setup possible in this structure.
CPR role: Decision zone with bullish lean — the CPR band (BC 23,408.22 to TC 23,433.94) acts as the key intraday support zone since price opens above it; if TC 23,433.94 holds as support on any first-hour dip, the session bias is clearly bullish, while a breach of TC and then BC converts the CPR into overhead resistance.
Near Flat (±0.05%)
A flat open in this Ascending Medium CPR structure is a high-information setup because price opens above the entire CPR band (above TC 23,433.94), meaning the first 15–30 minutes of trading will immediately reveal whether bulls are willing to defend the CPR as support or whether the ascending CPR was a one-day structure that fails to attract buying interest. The specific values to watch are TC **23,433.94** (the top of the CPR band) as first support and BC **23,408.22** (the bottom) as second support — a hold above TC **23,433.94** within the first 30 minutes confirms the CPR is a launch pad for an upside continuation targeting H3 **23,479.07** and then R1 **23,492.61**, while a close below BC **23,408.22** converts the ascending CPR to overhead resistance and targets L4 **23,382.26** and S1 **23,375.26** to the downside. Given the CPR width is 0.11% (Medium), this is a balanced setup — the day is unlikely to be a one-directional trend day like a Narrow CPR would suggest, but the Medium width still implies that the first 30-min directional break will carry the session's primary bias; expect at least one retest of the CPR band after the initial breakout or breakdown. The bull trigger is a **30-min close above PDH 23,466.90** (yesterday's high that represents the first real overhead level above the flat open area), confirming that buyers are absorbing the available supply and targeting H3 **23,479.07**; the bear trigger is a **30-min close below BC 23,408.22**, confirming that the ascending CPR has failed to attract buying and the session will be driven by sellers targeting L3 **23,414.53**, S1 **23,375.26**, and L4 **23,382.26**.
|
▲ Upside Path → OI-R The upside path from a flat open flows from TC **23,433.94** → H3 **23,479.07** → PDH **23,466.90** (already below H3; treat as first resistance confirmation) → R1 **23,492.61** → H4 **23,511.34** → Max Pain **23,500** (between H4 and R1; a gravitational target for options expiry on 29-Sep) → R2 **23,538.43** → H5 **23,549.03** → OI-R **24,000** as the ultimate ceiling. Volume confirmation is essential at each Camarilla level — a 15-min candle above H3 **23,479.07** on above-average volume signals genuine institutional buying, whereas a price touch without volume confirms it as a mean-reversion fade zone where intraday traders should book longs. |
▼ Downside Path → OI-S The downside path from a flat open begins with a breach of BC **23,408.22** on a 30-min close, which activates L3 **23,414.53** (note: L3 is above BC here at 23,414.53, meaning L3 is inside the CPR — this Camarilla quirk signals the CPR band is highly compressed around the mean-reversion zone) → L4 **23,382.26** → S1 **23,375.26** (these two levels are only 7 points apart — a powerful institutional support cluster) → PDL **23,349.55** → L5 **23,344.57** → L6 **23,328.96** → S2 **23,303.73** → OI-S **23,000**. The proximity of S1 (23,375.26) and L4 (23,382.26) creates a high-density support zone — retail stop-losses sitting just below PDL **23,349.55** will be the trigger for acceleration toward L5/L6 if that level breaks. |
| 🔴 OI-R: OI-R at **24,000** CE is the primary ceiling defined by CE writer positioning — in a flat-open scenario, this level is approximately 553 points above the open, making it a positional target rather than an intraday scalp target, and CE writers will begin gamma-hedging (selling futures) more aggressively as NIFTY approaches the 23,700–23,800 zone in the sessions ahead. For today's flat-open intraday context, OI-R at **24,000** serves as the macro resistance reminder that keeps institutional traders from aggressive call buying above R2 **23,538.43** — any CE positions above 23,600 will be lightly defended, but the 24,000 wall itself is a strong multi-session ceiling. | 🟢 OI-S: OI-S at **23,000** PE is the macro floor defined by PE writer positioning — in a flat-open scenario near 23,447, this level is 447 points below and serves as an options-market anchor that underpins bullish structural sentiment across the derivative chain. For the flat-open session, OI-S **23,000** means PE writers will not panic-buy protection below **23,100** without a major catalyst, providing a psychological safety net that prevents excessive bearish bets from gaining traction and supporting the view that the balanced-transitional market structure leans toward mean-reversion toward Max Pain **23,500** rather than a directional breakdown. |
⚡ Key Trigger: **First 30-min close above TC 23,433.94 sustained above PDH 23,466.90 = bull confirmation; first 30-min close below BC 23,408.22 = bear confirmation** — the TC at 23,433.94 is the structural fulcrum because it represents the top of the ascending CPR band, the exact level above which the entire day's CPR structure shifts from overhead resistance to active support. Market psychology around this level is driven by options market makers who are delta-hedging near the 23,450–23,500 strike cluster, creating a magnetic pull toward the Max Pain level of **23,500** — a flat open that slowly grinds toward 23,500 without a decisive 30-min break is the most common outcome for a Medium CPR flat-open structure in a balanced transitional market.
BANKNIFTY
Ascending — Medium (Width 0.16%)
◆ Neutral
Market Structure Balanced or transitional | Straddle ATM 56,500 straddle priced at **621.8 pts** (Call 410.95 + Put 210.85), implying an expected intraday move of approximately ±622 points from 56,500, defining a session range of roughly **55,878 to 57,122** — notably the straddle is asymmetric with Call premium nearly double the Put premium, suggesting the options market assigns a slightly higher probability to an upside move or elevated CE demand. | Max Pain Max Pain at **57,000** for Month expiry (29-Sep-2026) — price gravitates toward 57,000 into expiry, which is approximately **451 points above** current close of 56,548.90, suggesting a bullish drift is embedded in options market maker positioning as they benefit from BANKNIFTY settling near 57,000 on expiry. |
Tomorrow's Complete Level Map
OI-R: 57,500 R3: 57,126.06 H6: 56,965.55 H5: 56,909.70 R2: 56,874.93 H4 ▶: 56,776.68 R1: 56,711.91 PDH: 56,623.80 H3 ↩: 56,662.79
TC: 56,504.83 P: 56,460.78 BC: 56,416.73
L3 ↩: 56,435.01 PDL: 56,209.65 S1: 56,297.76 L4 ▶: 56,321.12 S2: 56,046.63 L5: 56,188.10 L6: 56,132.25 S3: 55,883.61 OI-S: 56,000
↩ = Camarilla reversal point | ▶ = Camarilla breakout/breakdown trigger | OI-R/OI-S = Options wall (CE/PE max OI)
▲ Higher Open (Gap Up) — Open > Prev Close
▲ Bullish
Open lands: BANKNIFTY's previous close of 56,548.90 is above TC 56,504.83, meaning a gap-up open will place price further above the entire ascending CPR band, with opening price likely in the range of **56,600 to 56,700+** depending on gap size — above PDH 56,623.80 for a significant or large gap, and between TC 56,504.83 and PDH 56,623.80 for a minor gap.
CPR role: Launch pad — the ascending CPR band (BC 56,416.73 to TC 56,504.83) becomes a distant but active support in a gap-up, confirming that any intraday dip that holds above TC 56,504.83 is a buying opportunity for continuation toward H3 56,662.79 and OI-R 57,500.
Minor Gap (0.05–0.25%) — Structure Dominant
A minor gap-up of 0.05–0.25% would open BANKNIFTY between approximately **56,577 and 56,690**, placing price above TC **56,504.83** and just above or near PDH **56,623.80** — the Ascending Medium CPR structure at 0.16% width adds meaningful confirmation since the entire CPR band is below the open, acting as a tiered support structure with P at **56,460.78** and BC at **56,416.73** as progressively stronger support levels below. The first key test is whether price can break above PDH **56,623.80** on a 30-min close — this level was yesterday's session high and represents the primary intraday resistance before the next cluster of levels at H3 **56,662.79** and R1 **56,711.91**; a 30-min close above PDH confirms bullish momentum and targets H3 **56,662.79** as the first Camarilla reference. First partial profit should be taken at R1 **56,711.91** with a second partial at H4 **56,776.68**, and the stop-loss should be placed below TC **56,504.83** to protect against a CPR breakdown.
Significant Gap (0.25–0.5%) — Balanced
A significant gap-up of 0.25–0.50% would open BANKNIFTY between approximately **56,690 and 56,832**, placing price above PDH **56,623.80** and into the H3 **56,662.79** to R1 **56,711.91** zone — this is a significant resistance cluster where Camarilla mean-reversion selling and Traditional R1 supply combine to create a natural stalling point. The straddle of 621.8 points implies the full day's expected range is roughly ±622 points from 56,500, and a significant gap-up already consumes a large portion of the upside straddle in the opening minutes, raising gap-fill risk toward TC **56,504.83** if buying volume does not sustain; delta-hedging by CE writers at the 57,000–57,500 zone creates additional overhead friction for any upside extension. A 30-min close above H3 **56,662.79** confirms the gap is sustained and targets R1 **56,711.91** and then H4 **56,776.68**, while a 30-min fade below PDH **56,623.80** signals the gap-fill trade toward TC **56,504.83** and P **56,460.78**.
Large Gap (>0.5%) — Gap Direction Dominant
A large gap-up exceeding 0.50% would open BANKNIFTY above approximately **56,832**, potentially in the H4 **56,776.68** to R2 **56,874.93** zone or higher — this is extreme Camarilla territory where the market opens directly into or above the H4 breakout trigger, a rare setup that creates both high-reward and high-risk intraday dynamics. The primary concern in a large gap-up for BANKNIFTY is the OI-R wall at **57,500** CE, which is now only 668 points above a large gap opening near 56,832 — CE writers at 57,500 and 57,000 will become aggressive sellers as BANKNIFTY approaches these strikes, creating powerful headwinds for any upside continuation. The recommended strategy is to wait for the first 15-min candle to complete — if it closes inside (below H4 **56,776.68** after opening above it), the gap-fill toward H3 **56,662.79** and PDH **56,623.80** is the primary trade; if it closes above H4 **56,776.68** with strong volume, the next target is R2 **56,874.93** and then H5 **56,909.70** toward the Max Pain level of **57,000**.
|
▲ Upside Path → OI-R The upside path in a gap-up scenario flows from PDH **56,623.80** → H3 **56,662.79** → R1 **56,711.91** → H4 **56,776.68** → R2 **56,874.93** → H5 **56,909.70** → Max Pain **57,000** → H6 **56,965.55** → R3 **57,126.06** → OI-R **57,500** — BANKNIFTY's larger intraday range (straddle 621.8 pts) means each Camarilla level is a genuine target rather than just a reference, and the Max Pain at **57,000** exerts gravitational pull especially in the last 90 minutes of trading given the 29-Sep expiry. Genuine momentum above H3 **56,662.79** is confirmed when BANKNIFTY posts two consecutive 15-min candles above that level with above-average volume, as this signals institutional participation rather than retail momentum chasing. |
▼ Downside Path → OI-S The downside failure path in a gap-up begins with a loss of TC **56,504.83** on a 30-min close, followed by a test of P **56,460.78** and then BC **56,416.73** — a break below BC on a 30-min close confirms that the entire ascending CPR has failed to provide support and the session's bullish structure collapses. Below BC **56,416.73**, the path targets L4 **56,321.12** and S1 **56,297.76** (these are within 24 points of each other, forming a strong institutional demand zone), then PDL **56,209.65** and OI-S **56,000** — the OI-S at 56,000 represents a massive PE writing position that will aggressively defend this level. |
| 🔴 OI-R: OI-R at **57,500** CE is the primary intraday ceiling defined by CE writers who have built large short-call positions at this strike — in a gap-up scenario, this level may be within reach as BANKNIFTY's larger range (straddle 621.8 pts) theoretically covers the distance, but gamma-hedging selling flows from CE writers at 57,000 and 57,500 will create strong resistance starting from R3 **57,126.06** onward. In a gap-up context, OI-R at **57,500** should be treated as the absolute upside ceiling for the full session — any positions held for a move toward 57,500 must be accompanied by very strong volume and a sustained break above R3 **57,126.06** on multiple 15-min closes. | 🟢 OI-S: OI-S at **56,000** PE is the critical downside floor in a gap-up scenario — it is approximately 549 points below the close and 300+ points below BC **56,416.73**, making it an abort-level reference rather than an active intraday support for bullish gap-up plays. PE writers at **56,000** represent strong institutional support that would only face pressure in a catastrophic intraday reversal; for gap-up traders, this level confirms that the market's options structure is skewed bullish (Max Pain 57,000, large PE writing at 56,000), supporting the view that gap-up momentum is unlikely to reverse all the way to OI-S without a major macro shock. |
⚡ Key Trigger: The primary trigger in a gap-up scenario is a **30-min candle close above PDH 56,623.80** confirming that the gap is being sustained with genuine buying interest and not just opening-range euphoria — this is the exact level that must be reclaimed and held to validate the Ascending Medium CPR's bullish structure for the full session. A 30-min close above PDH **56,623.80** activates the upside path toward H3 **56,662.79** and R1 **56,711.91** with a stop below TC **56,504.83**, while a 30-min close back below PDH signals that the gap is being faded and the focus shifts to the CPR band as the key support test.
▼ Lower Open (Gap Down) — Open < Prev Close
▼ Bearish
Open lands: BANKNIFTY's previous close of 56,548.90 is above TC 56,504.83 — a gap-down open below 56,548.90 would land price inside the CPR band (between TC 56,504.83 and BC 56,416.73) for a minor gap, or below BC 56,416.73 for a significant/large gap, immediately converting the ascending CPR band from a support structure into an overhead resistance zone.
CPR role: Overhead resistance — the CPR band (BC 56,416.73 to TC 56,504.83) acts as the key overhead resistance in a gap-down scenario; bears defend the TC 56,504.83 level and any 30-min close that fails to reclaim TC confirms the session as bearish.
Minor Gap (0.05–0.25%) — Structure Dominant
A minor gap-down of 0.05–0.25% would open BANKNIFTY between approximately **56,407 and 56,521**, placing price inside the CPR band (between BC **56,416.73** and TC **56,504.83**) or just below BC at the lower end — this is the most nuanced scenario because price opens inside the ascending CPR band, creating a decision zone where bulls and bears will contest control within the first 30 minutes. A minor gap-down inside the CPR band in a Medium width structure (0.16%) typically resolves with a 30-min close either above TC **56,504.83** (bull recovery) or below BC **56,416.73** (bear confirmation) — gap-fill attempts toward yesterday's close at **56,548.90** are common as intraday traders fade the minor gap. If price stays below BC **56,416.73** for the first 30 minutes, the bear case activates with targets at L3 **56,435.01** (note: L3 at 56,435.01 is inside the CPR, serving as the first Camarilla mean-reversion reference), then L4 **56,321.12** and S1 **56,297.76** as the primary downside cluster.
Significant Gap (0.25–0.5%) — Balanced
A significant gap-down of 0.25–0.50% would open BANKNIFTY between approximately **56,266 and 56,407**, placing price clearly below BC **56,416.73** and approaching or below PDL **56,209.65** at the lower end — this structurally confirms that the ascending CPR has been gapped below and now acts as a 88-point overhead resistance band (BC 56,416.73 to TC 56,504.83). The 30-min reclaim rule is paramount here — a 30-min close back above BC **56,416.73** suggests a false breakdown and recovery toward P **56,460.78** and TC **56,504.83**, but failure to reclaim BC within the first 60 minutes confirms a bearish session with L4 **56,321.12**, S1 **56,297.76**, and then PDL **56,209.65** as the cascading targets. The OI-S at **56,000** becomes the critical bear target in a significant gap-down — PUT holders will begin taking profits near **56,000–56,100**, and PE writer covering at this level will create strong buying, making it the zone to watch for reversal signals.
Large Gap (>0.5%) — Gap Direction Dominant
A large gap-down exceeding 0.50% would open BANKNIFTY below approximately **56,266**, potentially near or below PDL **56,209.65** and into the L4 **56,321.12** to L5 **56,188.10** zone — this is a structural breakdown that implies significant overnight negative catalysts (global markets, FII selling, or macro news) that the 621.8-point straddle did not fully price in. In a large gap-down, panic selling from leveraged long BANKNIFTY positions (which are typically high in a near-expiry week) accelerates the move — the L5 **56,188.10** and L6 **56,132.25** zone represents extreme Camarilla downside territory where mean-reversion buyers may attempt to step in, but only with a 15-min stabilization candle as confirmation. The OI-S at **56,000** becomes the primary intraday objective for bearish trades initiated at the open — straddle monetization (selling elevated ATM PUT premium near L5/L6) is the options play of choice once price stabilizes near these levels, and a close below **56,000** would trigger PE writer stop-losses creating a sharp downside extension.
|
▲ Upside Path → OI-R The recovery path in a gap-down scenario flows from below BC **56,416.73** → BC **56,416.73** → P **56,460.78** → TC **56,504.83** → PDH **56,623.80** → H3 **56,662.79** — each reclaimed level adds confidence that the recovery is genuine, and a 30-min close above TC **56,504.83** is the minimum threshold for calling the session bullish. Volume must confirm each recovery level — a low-volume drift back toward TC suggests short-covering rather than fresh buying, and such moves are prone to failure at PDH **56,623.80** where yesterday's sellers may re-emerge. |
▼ Downside Path → OI-S The downside continuation path moves from BC **56,416.73** → L3 **56,435.01** (inside CPR, first mean-reversion stall) → L4 **56,321.12** → S1 **56,297.76** (high-density support cluster, only 23 points apart) → PDL **56,209.65** → L5 **56,188.10** → L6 **56,132.25** → S2 **56,046.63** → OI-S **56,000** — the S1/L4 cluster (56,297.76–56,321.12) is the first major pause point where intraday bears should book 50% of positions, with the remainder targeting PDL and the L5/L6 zone. A break below PDL **56,209.65** on a 15-min close with above-average volume is the signal to hold the remaining bearish position toward OI-S **56,000**. |
| 🔴 OI-R: OI-R at **57,500** CE becomes a distant overhead ceiling in a gap-down scenario — it is 951+ points above the lower end of a significant gap-down opening and is structurally irrelevant for intraday scalpers; however, its existence confirms that CE writers are positioned for BANKNIFTY to remain below 57,500 through expiry, which keeps any intraday recovery attempts from attracting aggressive institutional buying. The more relevant near-term CE resistance in a gap-down context is at the **57,000 strike** (Max Pain level), which is approximately 451 points above the close and will attract hedging-related selling on any intraday recovery rally. | 🟢 OI-S: OI-S at **56,000** PE is the dominant bear target and primary PUT monetization zone in a gap-down scenario — PE writers who are short 56,000 puts will face maximum pain as BANKNIFTY approaches this level and will begin aggressive buying of futures/spot to defend their positions, creating a powerful support dynamic that intraday traders should not ignore. Any BANKNIFTY session that reaches **56,000** should be treated as a high-probability reversal zone — short positions should cover 50–70% of exposure here, and options traders should look to sell elevated ATM put premium as IV spikes on the approach to this OI-S wall. |
⚡ Key Trigger: The bear confirmation trigger is a **30-min candle close below BC 56,416.73** — this confirms that the ascending CPR structure has been negated and the session is controlled by sellers, activating the downside path toward L4 **56,321.12** and S1 **56,297.76**; the bull recovery trigger is a **30-min close above TC 56,504.83**, which reclaims the full CPR band and restores bullish bias targeting PDH **56,623.80** and H3 **56,662.79**. The 88-point wide CPR band (BC 56,416.73 to TC 56,504.83) means that a price trading inside the band for 30 minutes signals genuine indecision — traders should reduce position size and wait for the definitive candle close beyond either boundary before committing to a directional trade.
◆ Near Flat Open — Open ≈ Prev Close (±0.05%)
◆ Neutral
Open lands: A flat open of ±0.05% from yesterday's close of 56,548.90 places BANKNIFTY between approximately **56,521 and 56,577** — since yesterday's close at 56,548.90 is already above TC 56,504.83, a flat open also opens above the entire ascending CPR band, the most favorable structure for intraday bulls heading into the session.
CPR role: Decision zone with bullish lean — the CPR band (BC 56,416.73 to TC 56,504.83) acts as the primary intraday support zone from below, with a flat open above it creating a setup where bulls have structural foundation and bears must break through the entire 88-point CPR band to gain control.
Near Flat (±0.05%)
A flat open for BANKNIFTY in this Ascending Medium CPR structure creates a high-information setup because price opens above TC **56,504.83** — the entire 88-point CPR band (BC 56,416.73 to TC 56,504.83) sits below the open and acts as a tiered support system where bulls maintain structural control as long as TC is not breached on a 30-min close. The specific levels that define the day's directional bias are TC **56,504.83** (top of CPR, first support below flat open), P **56,460.78** (pivot, second support), and BC **56,416.73** (bottom of CPR, critical bear trigger) — a session that opens flat and slowly drifts toward TC without breaking it is behaving in a bullish balanced structure characteristic of a transitional market, while a swift early break of TC signals an intraday reversal. The CPR width of 0.16% (Medium) means this is not expected to be a one-directional trend day — the session will likely see at least one significant counter-trend move, and traders should plan for both a test of the CPR band from above and a test of PDH **56,623.80** from below as early price discovery unfolds. The Max Pain at **57,000** creates a directional gravity toward the upside from the flat open — options market makers benefit from BANKNIFTY settling near 57,000 on 29-Sep expiry, and a flat opening session may see slow but steady drift toward R1 **56,711.91** and eventually H4 **56,776.68** as gamma-neutral positioning by market makers supports price; the bull trigger is a **30-min close above PDH 56,623.80** (confirming upside momentum) and the bear trigger is a **30-min close below BC 56,416.73** (confirming CPR breakdown).
|
▲ Upside Path → OI-R The upside path from a flat open flows from PDH **56,623.80** → H3 **56,662.79** → R1 **56,711.91** → H4 **56,776.68** → R2 **56,874.93** → H5 **56,909.70** → Max Pain **57,000** → H6 **56,965.55** → R3 **57,126.06** → OI-R **57,500** — the straddle of 621.8 points theoretically encompasses the full range from 56,500 ± 622, and the upside path exhausts the straddle at approximately 57,122, very close to R3 **57,126.06**, making this level the maximum upside target for a one-standard-deviation move. Two consecutive 15-min candles above H3 **56,662.79** with increasing volume confirms genuine institutional participation and reduces the probability of mean-reversion back to the CPR band. |
▼ Downside Path → OI-S The downside path from a flat open begins with a breach of TC **56,504.83** → P **56,460.78** → BC **56,416.73** → L3 **56,435.01** (note: L3 at 56,435.01 is inside the BC-TC band, indicating extreme compression at the mean) → L4 **56,321.12** → S1 **56,297.76** (23-point cluster, retail stop-loss magnet) → PDL **56,209.65** → L5 **56,188.10** → L6 **56,132.25** → S2 **56,046.63** → OI-S **56,000**. The L4/S1 cluster (56,321.12–56,297.76) is the first high-probability reversal zone for intraday bears to book profits — below PDL **56,209.65**, the session's downside momentum enters extreme territory that requires very significant macro catalysts to sustain. |
| 🔴 OI-R: OI-R at **57,500** CE is the options market's defined ceiling for BANKNIFTY — in a flat-open scenario, this level is 951 points above the open and defines the absolute maximum upside for the current options cycle ending 29-Sep-2026; CE writers at this strike will sell futures aggressively if BANKNIFTY approaches 57,200–57,300, making the zone above R3 **57,126.06** highly treacherous for long positions. For intraday flat-open traders, the more relevant CE ceiling is at **57,000** (Max Pain), where market maker hedging flows will create natural supply on any sustained rally — use R3 **57,126.06** as the first major upside target and OI-R **57,500** as the ultimate ceiling for the week. | 🟢 OI-S: OI-S at **56,000** PE is the structural floor defined by PE writing activity — in a flat-open scenario, this level is 549 points below the open and confirms that the options market has strong institutional support well below current prices, reducing the probability of a catastrophic intraday selloff and supporting the balanced-transitional market structure assessment. The 56,000 PE wall means that bear trades initiated at BC **56,416.73** have a natural profit target near **56,000**, and PE writers will create increasingly aggressive buying support as price approaches this level, making it both the maximum bear target and the reversal trigger for the session. |
⚡ Key Trigger: **First 30-min close above PDH 56,623.80 = bull day confirmed targeting H3 56,662.79 and R1 56,711.91; first 30-min close below BC 56,416.73 = bear day confirmed targeting L4 56,321.12 and S1 56,297.76** — PDH **56,623.80** is the specific price level where yesterday's session high attracted selling and where fresh buyers need to demonstrate conviction by closing above it on a 30-min candle with volume. The market psychology driving this level is that institutional players who sold at PDH **56,623.80** yesterday are now watching whether new buyers can absorb their supply — a 30-min close above PDH with above-average delivery triggers their stop-losses and creates a self-reinforcing breakout dynamic toward H3 **56,662.79** and the Max Pain target of **57,000**.
SENSEX
Ascending — Narrow (Width 0.04%)
▲ Bullish
Market Structure Trending (up or down trend) | Straddle ATM 74,800 straddle priced at **372.85 pts** (Call 213.7 + Put 159.15), implying an expected intraday move of approximately ±373 points from 74,800, defining a session range of roughly **74,427 to 75,173** — the straddle is notably asymmetric with Call premium (213.70) significantly higher than Put premium (159.15), suggesting the options market assigns a meaningfully higher probability to upside movement or elevated call demand in SENSEX. | Max Pain Max Pain at **74,800** for both Week (24-Sep-2026) and Month (24-Sep-2026) expiry — today IS the expiry day for SENSEX Week and Month contracts, meaning max pain gravity at **74,800** will be the most powerful intraday magnetic force; option sellers who have written positions need SENSEX to expire near 74,800, creating intense pin risk and reducing the probability of sustained directional moves. |
Tomorrow's Complete Level Map
OI-R: 76,000 R3: 75,375.22 H6: 75,203.25 H5: 75,153.95 R2: 75,174.48 H4 ▶: 75,033.87 R1: 75,001.36 PDH: 74,973.74 H3 ↩: 74,931.06
TC: 74,814.43 P: 74,800.62 BC: 74,786.81
L3 ↩: 74,725.44 PDL: 74,599.88 S1: 74,627.50 L4 ▶: 74,622.63 S2: 74,426.76 L5: 74,502.55 L6: 74,453.25 S3: 74,253.64 OI-S: 73,000
↩ = Camarilla reversal point | ▶ = Camarilla breakout/breakdown trigger | OI-R/OI-S = Options wall (CE/PE max OI)
▲ Higher Open (Gap Up) — Open > Prev Close
▲ Bullish
Open lands: SENSEX's previous close of 74,828.25 is above TC 74,814.43, so a gap-up open places price even further above the entire ascending CPR band (BC 74,786.81 to TC 74,814.43) — a gap-up would open somewhere between 74,865 and 75,200+ depending on gap size, well above the 27.62-point narrow CPR band that will act as a strong support foundation below.
CPR role: Strong launch pad — the narrow ascending CPR band (BC 74,786.81 to TC 74,814.43, width only 27.62 points) acts as a compressed spring support zone; in a gap-up, this extremely narrow band confirms the Trending market structure and suggests any dip that holds above TC 74,814.43 is a high-probability continuation entry.
Minor Gap (0.05–0.25%) — Structure Dominant
A minor gap-up of 0.05–0.25% would open SENSEX between approximately **74,865 and 75,015**, placing price above TC **74,814.43** and likely near or above H3 **74,931.06**, in the zone between H3 and R1 **75,001.36** — the Ascending Narrow CPR (0.04% width) combined with the Trending market structure is the highest-conviction bullish setup available, meaning the first 15-min candle is the primary confirmation tool (Narrow CPR rule). The asymmetric straddle (Call 213.70 > Put 159.15) confirms that the options market is already leaning bullish, and a minor gap-up into the H3–R1 zone at **74,931–75,001** directly validates this positioning; the first 15-min candle above H3 **74,931.06** is the bull trigger for continuation toward R1 **75,001.36** and H4 **75,033.87**. Given today is SENSEX expiry day (both Week and Month Max Pain at **74,800**), there is an intense pin risk — the opening gap above Max Pain will create a tug-of-war between momentum buyers pushing toward R1 **75,001.36** and option sellers who need SENSEX to pin near **74,800**, and the 15-min candle direction in the first 15 minutes will determine which force wins.
Significant Gap (0.25–0.5%) — Balanced
A significant gap-up of 0.25–0.50% would open SENSEX between approximately **75,015 and 75,202**, placing price above R1 **75,001.36** and at or above H4 **75,033.87**, directly into the H4–H5 **75,153.95** resistance zone — this is a very significant gap on an expiry day because it opens above the entire Traditional R1 level, and the gap-fill probability toward Max Pain **74,800** becomes extremely high given expiry-day mean-reversion dynamics. Delta-hedging on SENSEX expiry day creates a powerful pull toward the Max Pain strike of **74,800** (the pivot P is **74,800.62**, essentially identical to Max Pain) — a significant gap-up above R1 will face aggressive selling from option sellers who are defending the **74,800** pin, and the first 15-min candle should be watched for a rejection pattern signaling a gap-fill trade toward TC **74,814.43** and then the P/Max Pain zone **74,800**. If the significant gap sustains with strong buying (e.g., based on global overnight cues), the next targets are H5 **75,153.95** and R2 **75,174.48**, but these should be treated as scalp targets with tight stops given the expiry-day pin risk.
Large Gap (>0.5%) — Gap Direction Dominant
A large gap-up exceeding 0.50% would open SENSEX above approximately **75,202**, potentially at or above H6 **75,203.25** — this is an extraordinary gap on an expiry day, placing price into extreme Camarilla territory and far above the Max Pain pin zone of **74,800**, creating very high gap-fill probability toward P **74,800.62** as expiry-day dynamics dominate. On expiry day, a large gap-up above H6 **75,203.25** almost guarantees an intraday reversal back toward the Max Pain level of **74,800** as CE writers at 75,000 and 75,200 aggressively sell futures to hedge their short delta exposure — the trade in this scenario is to wait for a 15-min rejection candle and then initiate a short targeting P **74,800.62** and BC **74,786.81** with a stop above H6 **75,203.25**. The straddle of 372.85 points implies a maximum move of ±373 from 74,800, and a large gap-up beyond H6 would exceed this, making any position above **75,174** (R2) an extreme risk zone where the reward/risk ratio shifts against bulls.
|
▲ Upside Path → OI-R The upside path in a gap-up scenario flows from H3 **74,931.06** → PDH **74,973.74** → R1 **75,001.36** → H4 **75,033.87** → H5 **75,153.95** → R2 **75,174.48** → H6 **75,203.25** → R3 **75,375.22** → OI-R **76,000** — given today is expiry day, the probability of reaching OI-R **76,000** in a single session is very low (requires a 1,172-point move from close), and the realistic intraday upside targets are R1 **75,001.36** (first partial) and H4 **75,033.87** (second partial), with R2 **75,174.48** being the maximum plausible bull extension within the straddle's implied range. Each level above R1 represents decreasing probability on an expiry day as CE writers become more aggressive sellers of futures to protect their short positions. |
▼ Downside Path → OI-S The downside failure path in a gap-up begins with a rejection at H3 **74,931.06** on the first 15-min candle, pulling price back toward TC **74,814.43** and the Max Pain/P level **74,800.62** — on expiry day, this is the high-probability gap-fill trade with the P level at **74,800.62** serving as a magnetic target. Below P **74,800.62**, the path continues to BC **74,786.81** → L3 **74,725.44** → S1 **74,627.50** → L4 **74,622.63** (these two are only 5 points apart, a powerful dual-level support cluster) → PDL **74,599.88** → L5 **74,502.55** → OI-S **73,000** — the L4/S1 zone (74,622.63–74,627.50) is the most important intraday support cluster below Max Pain and should be the primary target for any gap-fill trade initiated on an H3 rejection. |
| 🔴 OI-R: OI-R at **76,000** CE is the ultimate ceiling for SENSEX defined by CE writing activity — on today's expiry day (both Week and Month), this level is 1,171.75 points above the close and is completely irrelevant as an intraday target; however, its existence explains why CE writers at lower strikes (75,000–75,200) are aggressive sellers, as they are protecting short-call positions in a well-defined range. For today's expiry session, the functional OI-R ceiling is not **76,000** but rather the **75,000** strike CE (which is within the straddle range), and intraday bulls should treat any approach to R1 **75,001.36** as the effective options ceiling for the day. | 🟢 OI-S: OI-S at **73,000** PE is the structural floor defined by PE writing — on expiry day, this level is 1,828 points below the close and is the most distant floor possible, confirming that the broader options market has tremendous downside protection built in for SENSEX. For today's expiry session, the **73,000** PE support confirms that put writers are extremely comfortable at current levels and there is no systematic risk from that direction — the functional PE support for the day is the **74,800** Max Pain (which equals P **74,800.62**), and traders should view any dip toward this level as a buying opportunity given the expiry-day pinning mechanics and the massive OI-S base at 73,000. |
⚡ Key Trigger: **First 15-min candle close above H3 74,931.06 = bull confirmation (Narrow CPR rule); rejection at H3 74,931.06 within the first 15 minutes = gap-fill trade targeting Max Pain 74,800 and TC 74,814.43** — the Narrow CPR (0.04% width) and Trending market structure mandate a 15-min candle confirmation (not 30 minutes) as the definitive directional signal, making the H3 level the most important 15-minute test level of the session. On this expiry day, the first 15-min candle above H3 **74,931.06** with above-average volume confirms that momentum buyers have overwhelmed expiry-day pin dynamics and the session will trend toward R1 **75,001.36**; a 15-min rejection below H3 confirms that expiry-day pinning forces are dominant and SENSEX will gravitate back toward Max Pain **74,800** through the session.
▼ Lower Open (Gap Down) — Open < Prev Close
▼ Bearish
Open lands: SENSEX's previous close of 74,828.25 is above TC 74,814.43 — a gap-down open would initially land price between TC 74,814.43 and BC 74,786.81 (minor gap), near P 74,800.62 (which is essentially equal to Max Pain 74,800), or below BC 74,786.81 for a more significant gap; this creates a unique expiry-day scenario where even a minor gap-down lands directly on the Max Pain pin zone.
CPR role: Overhead resistance and expiry pin zone — the ultra-narrow CPR band (BC 74,786.81 to TC 74,814.43, only 27.62 points wide) in a gap-down simultaneously acts as overhead resistance AND the Max Pain pin zone, creating a complex setup where option sellers actively want SENSEX near 74,800 while bears want a breakdown below BC 74,786.81.
Minor Gap (0.05–0.25%) — Structure Dominant
A minor gap-down of 0.05–0.25% would open SENSEX between approximately **74,641 and 74,791**, placing price inside the CPR band or just below BC **74,786.81** — critically, this places the open directly around the Max Pain level of **74,800** and P **74,800.62**, which is the most powerful expiry-day magnet. The Narrow CPR (0.04%) and Trending structure mandate that the first 15-min candle is the definitive signal — a 15-min close above TC **74,814.43** confirms that the minor gap-down is a false signal and the expiry-day pin is intact, targeting a slow drift back toward Max Pain **74,800** and then potentially H3 **74,931.06** if momentum builds. A 15-min close below BC **74,786.81** confirms bearish continuation with the CPR band acting as overhead resistance, targeting L3 **74,725.44** and then the S1/L4 cluster (**74,627.50–74,622.63**) as the primary intraday bear targets on expiry day.
Significant Gap (0.25–0.5%) — Balanced
A significant gap-down of 0.25–0.50% would open SENSEX between approximately **74,641 and 74,641–74,641**— specifically between **74,454 and 74,641**, placing price below BC **74,786.81** and below PDL **74,599.88** at the lower end, with opening price near L4 **74,622.63** or L5 **74,502.55** — this is a structurally bearish scenario on SENSEX expiry day. In a significant gap-down, the CPR band (BC 74,786.81 to TC 74,814.43) becomes a 27-point overhead resistance band that is now approximately 145–284 points above the open — the 30-min reclaim of BC **74,786.81** is required for any recovery signal, and failure to reclaim within 60 minutes confirms a bearish expiry-day session. The Max Pain at **74,800** now acts as overhead resistance rather than a magnet — option sellers who were writing near **74,800** are facing losses on short puts and will defensively buy futures near PDL **74,599.88** and L4 **74,622.63**, creating a natural support cluster in this zone that may limit the downside.
Large Gap (>0.5%) — Gap Direction Dominant
A large gap-down exceeding 0.50% would open SENSEX below approximately **74,454**, near or below L5 **74,502.55** and approaching L6 **74,453.25** — this is extreme Camarilla territory on expiry day, creating a dual dynamic of expiry-related forced covering (from put writers who are now deeply in-the-money) and momentum selling from leveraged positions. On expiry day, a large gap-down of this magnitude would create very significant options expiry losses for PE writers at 74,500 and 74,800 strikes — their forced covering of short-put positions by buying futures creates a violent bounce potential from the L5 **74,502.55** / L6 **74,453.25** zone, and traders should watch for a 15-min stabilization candle near these levels as the potential reversal signal. The straddle of 372.85 points implies the maximum move from 74,800 is approximately ±373 points, and a large gap-down to L5 **74,502.55** (298 points below Max Pain) is within this range — the full downside straddle target of approximately **74,427** (74,800 minus 373) aligns remarkably closely with S2 **74,426.76**, making this the maximum statistical bear target for the session.
|
▲ Upside Path → OI-R The recovery path in a gap-down scenario flows from below BC **74,786.81** → BC **74,786.81** → P **74,800.62** (Max Pain pin target) → TC **74,814.43** → H3 **74,931.06** → PDH **74,973.74** → R1 **75,001.36** — a recovery above TC **74,814.43** on a 15-min close is the first major confirmation, and a subsequent hold above P **74,800.62** with H3 as the next target confirms that expiry-day option sellers are supporting the market. The key distinction between a dead-cat bounce and genuine recovery is whether SENSEX posts two consecutive 15-min closes above TC **74,814.43** — two consecutive closes confirm institutional support and target PDH **74,973.74** as the next resistance level. |
▼ Downside Path → OI-S The downside path from below BC **74,786.81** targets L3 **74,725.44** → S1 **74,627.50** → L4 **74,622.63** (dual-level cluster, only 5 points apart, extremely strong support) → PDL **74,599.88** → L5 **74,502.55** → L6 **74,453.25** → S2 **74,426.76** (maximum straddle target, 373 pts below Max Pain) → S3 **74,253.64** → OI-S **73,000**. The S1/L4 cluster (74,627.50–74,622.63) is the most important intraday support below Max Pain and should be the first major profit-taking zone for bearish positions — retail stop-losses below PDL **74,599.88** will accelerate the move to L5 **74,502.55** if that level breaks. |
| 🔴 OI-R: OI-R at **76,000** CE is structurally irrelevant in a gap-down scenario on expiry day — it is more than 1,171 points above the close and represents the multi-session ceiling rather than an intraday reference point; however, it confirms that the options market's range for the full month expiry cycle was extremely well-defined and that CE writers at 76,000 are comfortable at current levels. The functional overhead resistance in a gap-down context is the CPR band (BC 74,786.81 to TC 74,814.43) combined with the Max Pain level **74,800** — these 27-point levels are the real ceiling for the session, not OI-R at 76,000. | 🟢 OI-S: OI-S at **73,000** PE becomes the critical structural floor on expiry day — PE writers who are short 73,000 puts are sitting on large profits at current levels (SENSEX is 1,828 points above this strike) and will aggressively buy futures if a gap-down threatens the broader market structure; their buying activity well above **73,000** provides a second layer of support beneath the session's trading range. For expiry-day traders, the **73,000** OI-S confirms that any intraday dip is very likely to find institutional buying between the session low and **73,000** — the zone of **74,427–74,454** (S2 and L6) represents the maximum realistic intraday bear target, and any session that approaches this zone should expect significant PE writer covering activity. |
⚡ Key Trigger: **First 15-min candle close above TC 74,814.43 = bull recovery and expiry pin confirmed (Narrow CPR, first 15-min rule); first 15-min close below BC 74,786.81 with no recovery = bear day with L3 74,725.44 and S1 74,627.50 as primary targets** — the TC at **74,814.43** is the exact structural fulcrum where bearish gap-down momentum must be reversed; since the CPR is only 27.62 points wide (Narrow, 0.04%), a 15-min confirmation is both necessary and sufficient for the directional call. On expiry day specifically, the **74,800** Max Pain level exerts gravitational force — a gap-down that opens below BC **74,786.81** but recovers above TC **74,814.43** within 15 minutes suggests option market makers are buying to protect the **74,800** pin, a very high-probability bull signal unique to expiry sessions.
◆ Near Flat Open — Open ≈ Prev Close (±0.05%)
◆ Neutral
Open lands: A flat open of ±0.05% from yesterday's close of 74,828.25 places SENSEX between approximately **74,791 and 74,865** — since yesterday's close at 74,828.25 is above TC 74,814.43, a flat open also opens above the entire ascending CPR band, and given the ultra-narrow 27.62-point width, even a ±0.05% open encompasses the entire CPR band from BC 74,786.81 to TC 74,814.43.
CPR role: Expiry-day compression zone and Max Pain pin — the ultra-narrow CPR (BC 74,786.81 to TC 74,814.43) overlaps almost perfectly with the Max Pain level of 74,800 and the Pivot P of 74,800.62, creating the highest-conviction options pin scenario where a flat open essentially opens ON the Max Pain target that option sellers are defending for today's expiry.
Near Flat (±0.05%)
A flat open for SENSEX on this Ascending Narrow CPR (0.04% width) is the most powerful setup of the three scenarios on an expiry day — the CPR band (BC 74,786.81 to TC 74,814.43) spans only 27.62 points and is centered almost exactly on the Max Pain level of **74,800** (P is **74,800.62**), meaning a flat open places SENSEX directly at the nexus of the CPR band AND Max Pain, creating an extraordinary compression zone where option sellers (who need expiry near 74,800) and the market's natural structural support (Narrow Ascending CPR = trending) will reinforce each other. The first 15-min candle in this setup is the single most important piece of market information for the session — the Narrow CPR and Trending market structure mandate a 15-min confirmation rule, and the first candle's direction above TC **74,814.43** (bull) or below BC **74,786.81** (bear) defines the intraday trend for the remainder of the expiry session; there is no 'wait and see' in a Narrow CPR expiry-day flat open. The ultra-narrow 27.62-point CPR band means the energy compression is extreme — Narrow CPRs on expiry days have the highest probability of producing trend days where the first directional break extends to R1 **75,001.36** or S1 **74,627.50** without significant pullbacks, as both short-side and long-side delta-hedging flows amplify the initial move. Both the bull trigger (**first 15-min close above TC 74,814.43** targeting H3 **74,931.06** and R1 **75,001.36**) and the bear trigger (**first 15-min close below BC 74,786.81** targeting L3 **74,725.44** and S1 **74,627.50**) must be pre-planned before market open, because the combination of a Narrow CPR, Trending structure, and expiry-day gamma dynamics means the initial move after the first 15-min candle closes will be fast and provide little opportunity for late entries.
|
▲ Upside Path → OI-R The upside path from a flat open flows from TC **74,814.43** → H3 **74,931.06** → PDH **74,973.74** → R1 **75,001.36** (first partial profit level per Narrow CPR confirmation rules — take partials at first Traditional target) → H4 **75,033.87** → H5 **75,153.95** → R2 **75,174.48** (maximum straddle upside target, 374 pts above Max Pain) → H6 **75,203.25** → OI-R **76,000** as the ultimate ceiling. Per the Narrow CPR width rule, the first partial profit should be taken at R1 **75,001.36** with a trail stop to TC **74,814.43**, and the position should be exited near the Camarilla H4/H5 zone (**75,033–75,154**) rather than targeting OI-R **76,000** in a single expiry-day session. |
▼ Downside Path → OI-S The downside path from a flat open flows from BC **74,786.81** → L3 **74,725.44** → S1 **74,627.50** → L4 **74,622.63** (first partial profit on bear trade per Narrow CPR rule — take partials at first Traditional target S1) → PDL **74,599.88** → L5 **74,502.55** → L6 **74,453.25** → S2 **74,426.76** (maximum straddle downside target, ≈373 pts below Max Pain) → OI-S **73,000** as the ultimate floor. Per the Narrow CPR trail rule, the stop on a bear trade should be trailed to BC **74,786.81** once L3 **74,725.44** is broken, and the Camarilla L4/L5 zone (**74,622–74,502**) should be the target for the second partial profit before allowing the remainder to run toward straddle exhaustion near S2 **74,426.76**. |
| 🔴 OI-R: OI-R at **76,000** CE is the ultimate expiry cycle ceiling that CE writers have defended for the entire monthly cycle — on today's expiry day (both Week and Month), this level is irrelevant as an intraday target but its existence explains why SENSEX has been range-bound between 73,000 PE and 76,000 CE for the expiry cycle. The functional ceiling for today's flat-open expiry session is not **76,000** but rather H5 **75,153.95** and R2 **75,174.48** — these represent the maximum one-sigma move above Max Pain (74,800 + 373 straddle = 75,173), and CE writers at 75,000–75,200 strikes will be active sellers creating natural supply at these levels. | 🟢 OI-S: OI-S at **73,000** PE is the expiry cycle floor — its massive size confirms that PE writers at 73,000 are sitting on large profits with SENSEX at 74,828 (1,828 points above their short strike), and they will become buyers of futures if any intraday crash threatens to approach this level. For today's flat-open expiry session, OI-S at **73,000** functions as the macro safety net that keeps put premiums (including the ATM 74,800 put at 159.15) relatively contained — PE writers' collective short-put inventory at 73,000 provides the insurance that prevents catastrophic intraday selloffs, and the Maximum bear target for the session (S2 **74,426.76**) is still 1,427 points above OI-S, confirming that even a one-sigma bearish day leaves the OI-S wall unthreatened. |
⚡ Key Trigger: **First 15-min candle close above TC 74,814.43 = bull trending day targeting H3 74,931.06 → R1 75,001.36 → H4 75,033.87; first 15-min candle close below BC 74,786.81 = bear trending day targeting L3 74,725.44 → S1 74,627.50 → L4 74,622.63** — TC **74,814.43** is the exact structural fulcrum because it represents the upper boundary of the Narrow CPR band AND sits only 14 points above the Max Pain/Pivot level of **74,800.62**, meaning a 15-min close above it immediately signals that expiry-day gamma dynamics have been overwhelmed by directional momentum. The market psychology on an expiry day with Max Pain at **74,800** is that option sellers (who have written large positions at this strike) will fight hard to keep SENSEX near **74,800** — a decisive 15-min candle close beyond either CPR boundary means their hedging activity has JOINED the directional flow rather than opposing it, which is the most powerful confirmation signal available in options-dominated expiry sessions.
📊 VIX Insight: India VIX data is unavailable for this session, which creates a notable information gap for premium buyers and sellers — without VIX direction, traders must rely entirely on straddle pricing (NIFTY ±208.2 pts, BANKNIFTY ±621.8 pts, SENSEX ±372.85 pts) to gauge implied volatility expectations. The asymmetric straddle structures observed (SENSEX Call 213.70 vs Put 159.15; BANKNIFTY Call 410.95 vs Put 210.85) suggest the options market is pricing in a mild upside skew, implying that whatever the VIX level is, premium is marginally elevated on the call side — traders should be cautious about buying naked calls near resistance levels (H3, H4) as the elevated call premium suggests sellers are well-compensated, and premium selling (short straddles/strangles near Max Pain levels) may offer better risk-adjusted returns on an expiry day like SENSEX's 24-Sep-2026 settlement.
Overall View:
All three indices — NIFTY, BANKNIFTY, and SENSEX — enter 24 Sep 2026 with Ascending CPR structures above yesterday's closing prices, confirming a structural bullish bias that requires price to work its way into each respective CPR band for intraday continuation; however, the Balanced/Transitional market structures of NIFTY and BANKNIFTY counsel caution against aggressive directional bets without 30-min candle confirmation. SENSEX is the standout index for 24 Sep 2026 — it is on expiry day (both Week and Month settling), carries the highest-conviction Narrow CPR (0.04%), sits in a Trending market structure, and has Max Pain at **74,800** almost exactly matching its Pivot P at **74,800.62**, creating a powerful pin scenario that will define the session's character within the first 15 minutes. The interplay between NIFTY Max Pain at **23,500** (5 sessions away), BANKNIFTY Max Pain at **57,000** (+451 pts from close), and SENSEX Max Pain at **74,800** (today's expiry) suggests a coordinated options market structure where bulls have a theoretical edge — upside is supported by PE writing floors at NIFTY 23,000, BANKNIFTY 56,000, and SENSEX 73,000, while CE ceilings at NIFTY 24,000, BANKNIFTY 57,500, and SENSEX 76,000 define the range within which institutional option sellers will operate through the week.
All three indices — NIFTY, BANKNIFTY, and SENSEX — enter 24 Sep 2026 with Ascending CPR structures above yesterday's closing prices, confirming a structural bullish bias that requires price to work its way into each respective CPR band for intraday continuation; however, the Balanced/Transitional market structures of NIFTY and BANKNIFTY counsel caution against aggressive directional bets without 30-min candle confirmation. SENSEX is the standout index for 24 Sep 2026 — it is on expiry day (both Week and Month settling), carries the highest-conviction Narrow CPR (0.04%), sits in a Trending market structure, and has Max Pain at **74,800** almost exactly matching its Pivot P at **74,800.62**, creating a powerful pin scenario that will define the session's character within the first 15 minutes. The interplay between NIFTY Max Pain at **23,500** (5 sessions away), BANKNIFTY Max Pain at **57,000** (+451 pts from close), and SENSEX Max Pain at **74,800** (today's expiry) suggests a coordinated options market structure where bulls have a theoretical edge — upside is supported by PE writing floors at NIFTY 23,000, BANKNIFTY 56,000, and SENSEX 73,000, while CE ceilings at NIFTY 24,000, BANKNIFTY 57,500, and SENSEX 76,000 define the range within which institutional option sellers will operate through the week.
Disclaimer: KRV Prime provides educational and informational content relating to financial markets. Articles, research, examples, charts, strategies and tools are provided for educational purposes and should not be interpreted as personalised investment advice or a guarantee of financial performance. Markets involve risk, including possible loss of capital. Past performance does not guarantee future results. KRV Prime is not a SEBI Registered Investment Adviser or Research Analyst.